
The Renewable Energy KPI Dashboard in Google Sheets is a powerful and user-friendly tool designed to help organizations in the renewable energy sector monitor, analyze, and optimize their energy performance. Whether you’re managing solar, wind, hydro, or geothermal projects, this dashboard provides a centralized platform to track key performance indicators (KPIs) and make data-driven decisions.

Key Features:
-
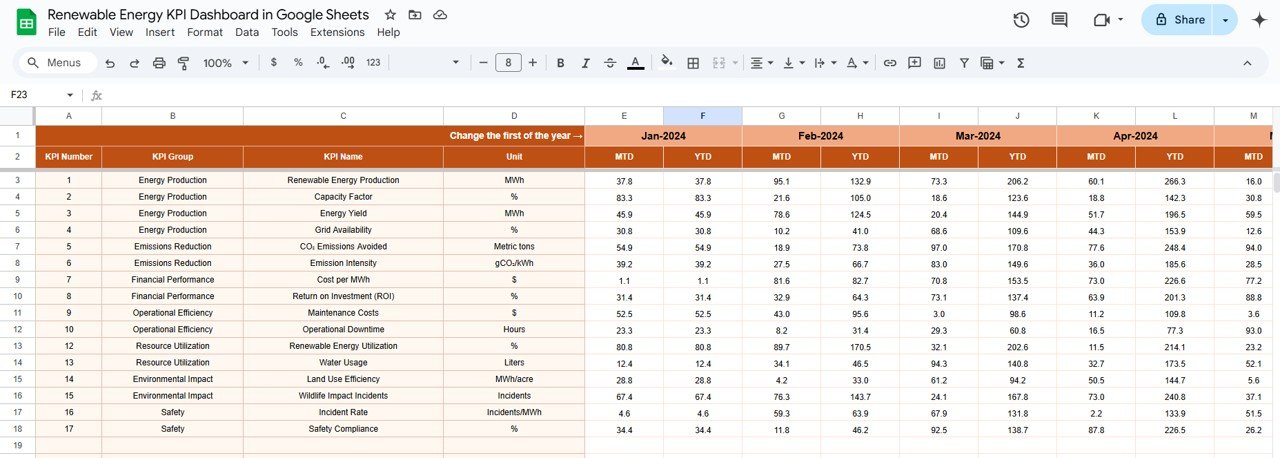
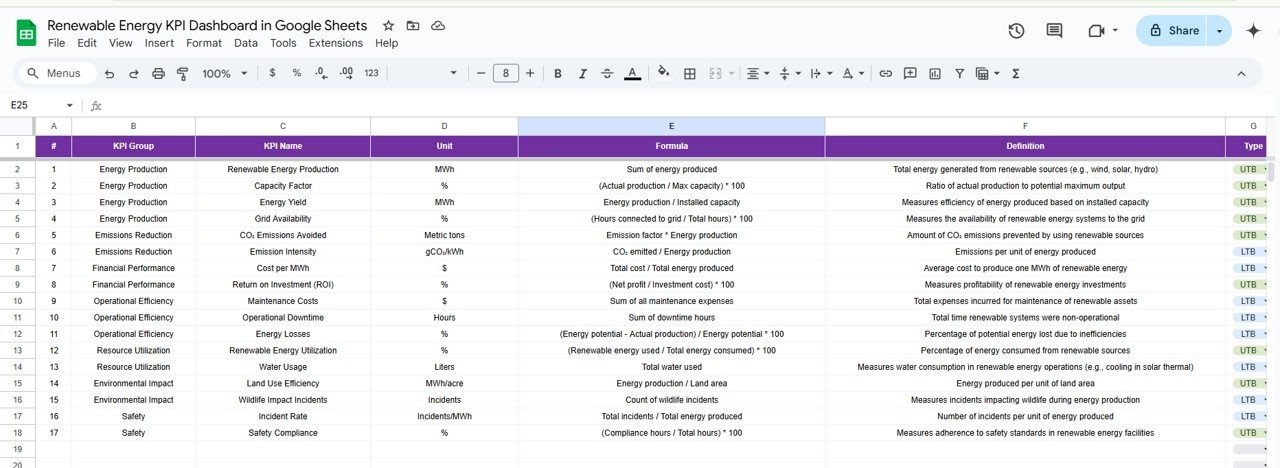
Customizable Metrics: Tailor the dashboard to your specific energy sources and KPIs, such as energy production, capacity utilization, efficiency ratios, and carbon offset calculations.
-
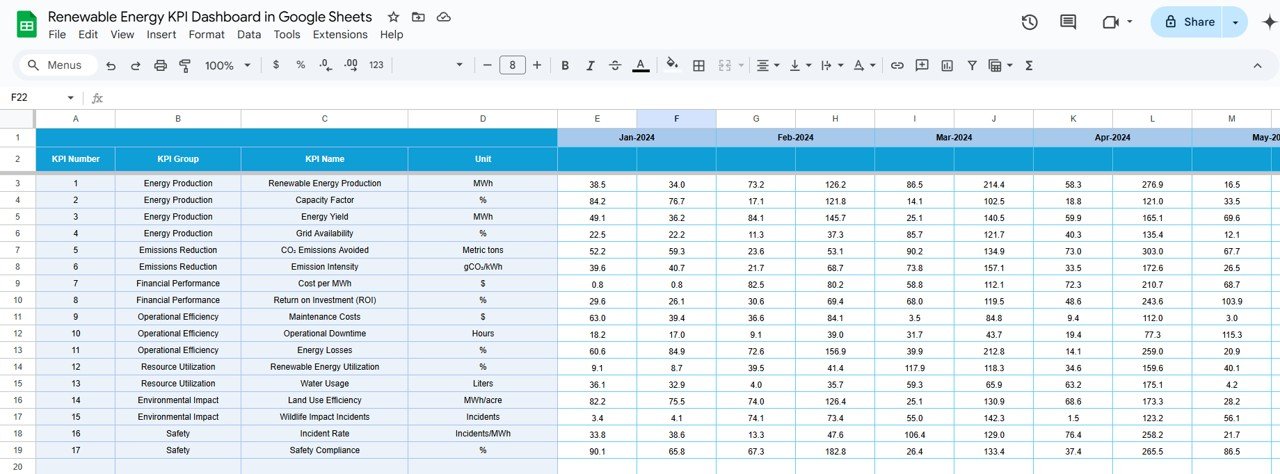
Real-Time Data Integration: Automatically update your dashboard with real-time data inputs, ensuring that your performance metrics are always current and accurate.
-
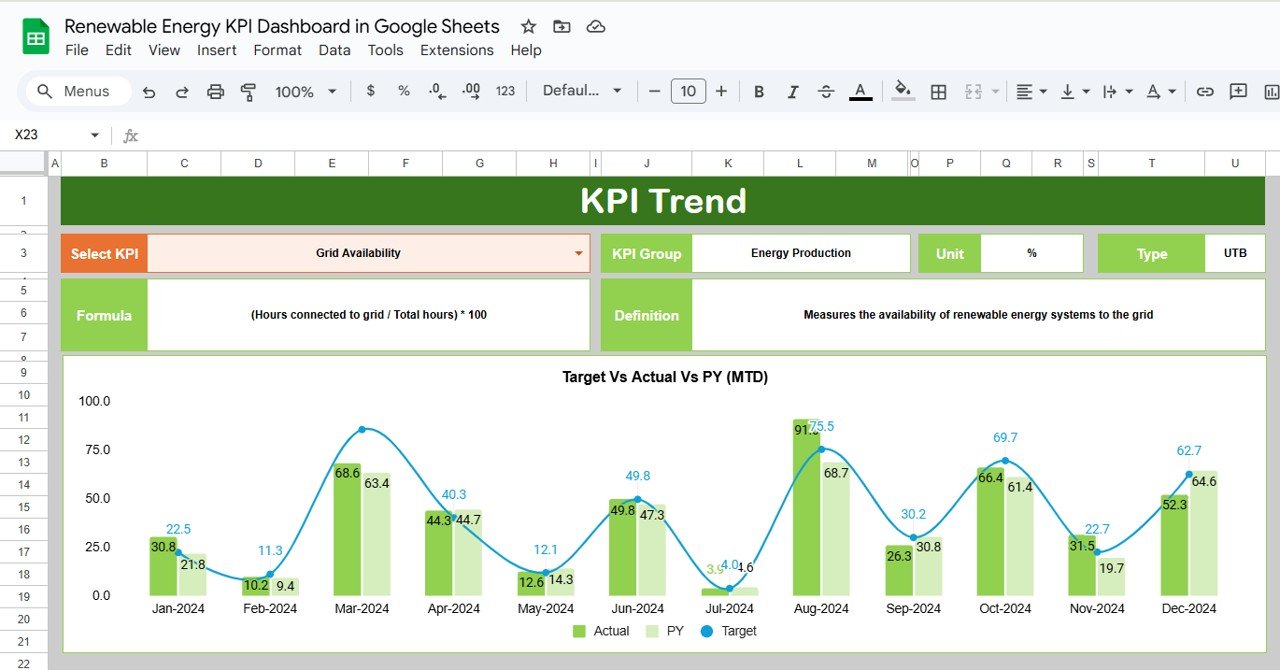
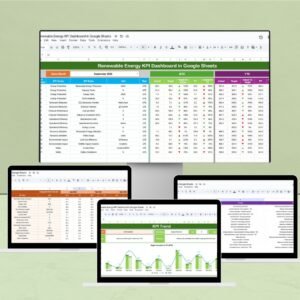
Interactive Visualizations: Utilize charts, graphs, and trend lines to visualize your data, making it easier to identify patterns, anomalies, and areas for improvement.
-
User-Friendly Interface: Navigate through the dashboard with ease, thanks to its intuitive design and layout, making it accessible for users with varying levels of technical expertise.
-
Collaboration Tools: Share the dashboard with team members and stakeholders to foster transparency and collaborative decision-making.
Benefits:
-
Enhanced Decision-Making: With real-time data and visualizations, make informed decisions that can improve energy production and reduce costs.
-
Increased Accountability: Track progress towards your energy goals and identify areas for improvement, promoting accountability within your organization.
-
Resource Optimization: By identifying trends and patterns, allocate resources more effectively to areas that require attention, ensuring optimal use of assets.
-
Regulatory Compliance: Stay compliant with environmental regulations by monitoring key metrics and ensuring that energy practices meet required standards.
How to Use:
-
Access the Template: Open the provided Google Sheets template link.
-
Customize Metrics: Modify the existing metrics or add new ones that align with your organization’s goals.
-
Input Data: Regularly update the dashboard with your organization’s data to keep it current.
-
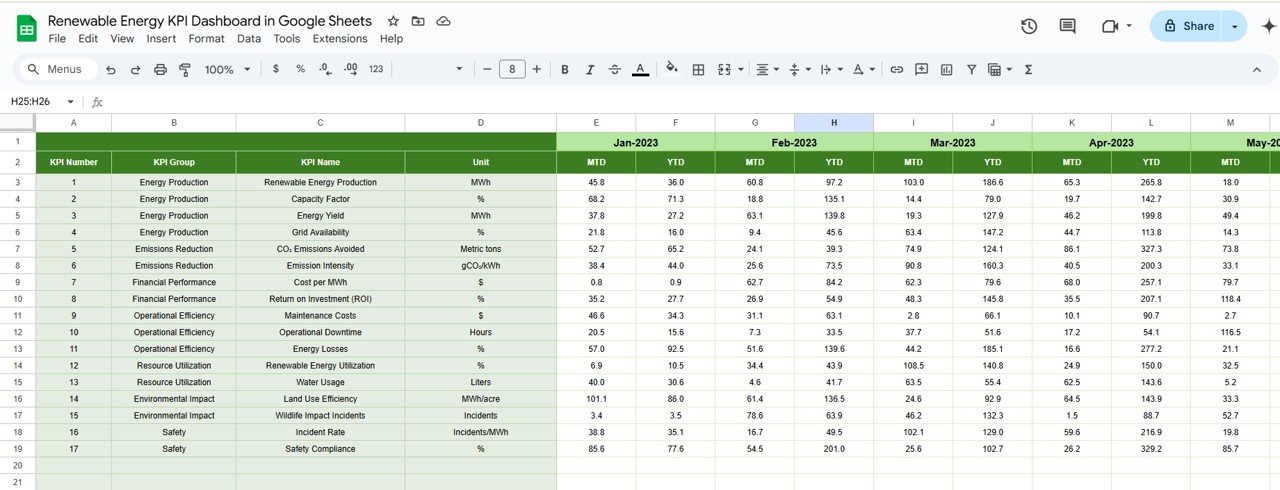
Analyze Trends: Use the visualizations to identify trends and make data-driven decisions.
-
Share Insights: Collaborate with team members and stakeholders by sharing the dashboard and discussing the insights gathered.
Who Can Benefit:
-
Renewable Energy Project Managers: Oversee the performance of energy projects and ensure they meet their objectives.
-
Sustainability Analysts: Assess the environmental impact of energy production and identify opportunities for improvement.
-
Operations Teams: Monitor daily operations and address any issues that may arise.
-
Regulatory Bodies: Ensure that energy practices comply with environmental standards and regulations.
By implementing the Renewable Energy KPI Dashboard in Google Sheets, organizations can enhance their ability to monitor performance, make informed decisions, and ultimately improve the efficiency and sustainability of their energy projects.
Click here to read the Detailed blog post
Visit our YouTube channel to learn
step-by-step video tutorials
Youtube.com/@PKAnExcelExpert


Reviews
There are no reviews yet.