
Managing refinery tenders is not just about tracking numbers—it is about controlling risk, cost, compliance, and timelines. Because refinery tenders involve high-value contracts, strict regulations, and multiple stakeholders, even a small oversight can lead to massive financial impact. That is exactly why the Refinery Tender KPI Dashboard in Excel is designed to become your single source of truth for tender performance.
This powerful yet easy-to-use Excel dashboard converts complex tender data into clear KPIs, trend insights, and performance comparisons—all without expensive BI tools. Instead of juggling multiple spreadsheets, refinery teams get one centralized dashboard that delivers clarity, speed, and confidence in every decision.
🚀 Key Features of Refinery Tender KPI Dashboard in Excel
✨ Interactive KPI Dashboard – Instantly track MTD and YTD performance with clean KPI cards and visuals
📅 Dynamic Month Selector – Change the month in one cell and watch the entire dashboard update automatically
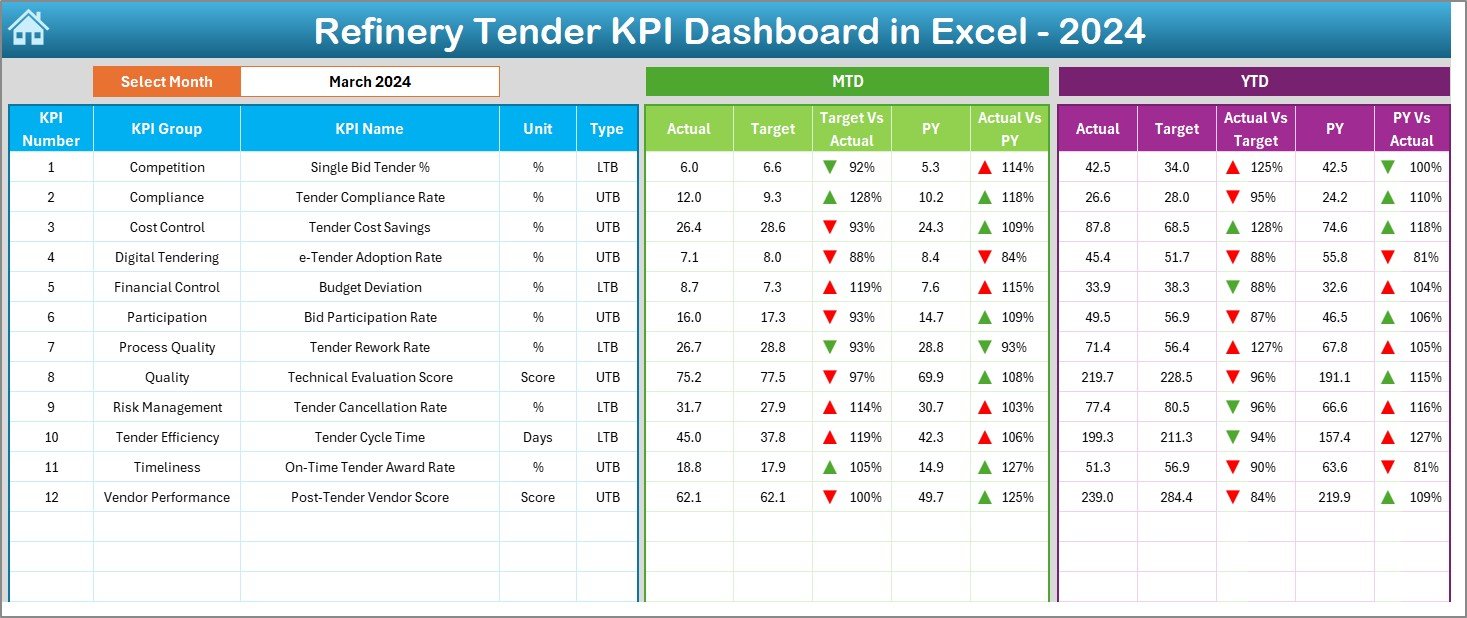
📊 Target vs Actual Analysis – Identify performance gaps using automated variance calculations
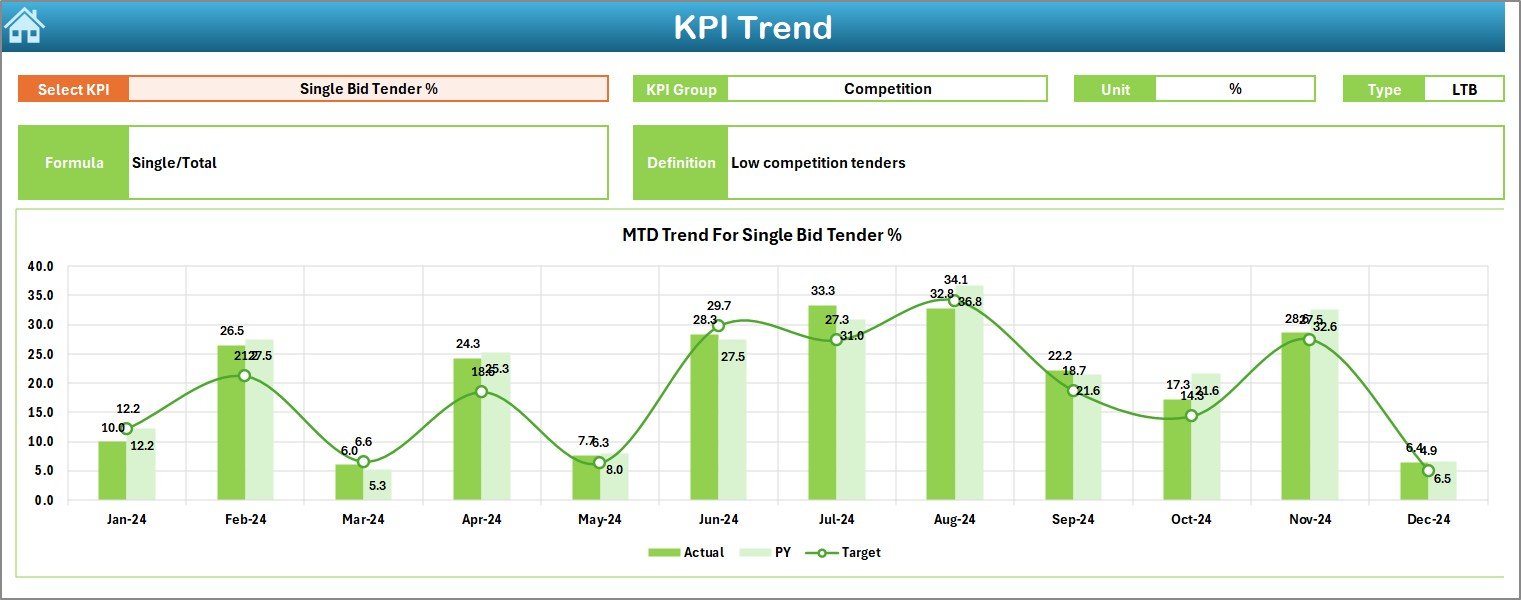
📈 Previous Year Comparison – Measure growth or decline with CY vs PY insights
🔽 Conditional Formatting Indicators – Visual up/down arrows highlight performance direction instantly
🧭 Quick Navigation Summary Page – Jump between worksheets using built-in navigation buttons
⚙️ Fully Customizable KPIs – Modify KPIs, targets, and formulas to match refinery requirements
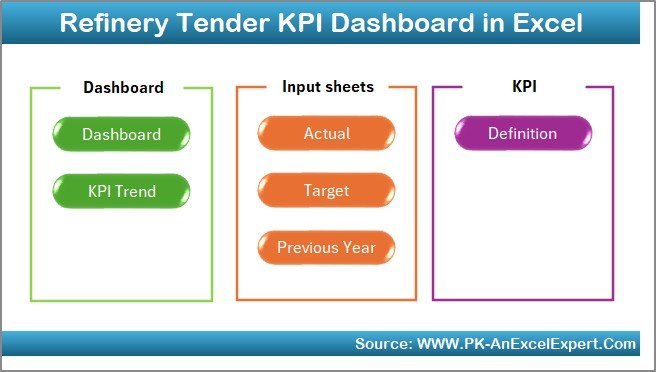
📂 What’s Inside the Refinery Tender KPI Dashboard
This Excel file is structured into 7 professionally designed worksheets, each serving a specific purpose:
📌 Summary Page – Acts as a navigation hub with buttons to access all major sections
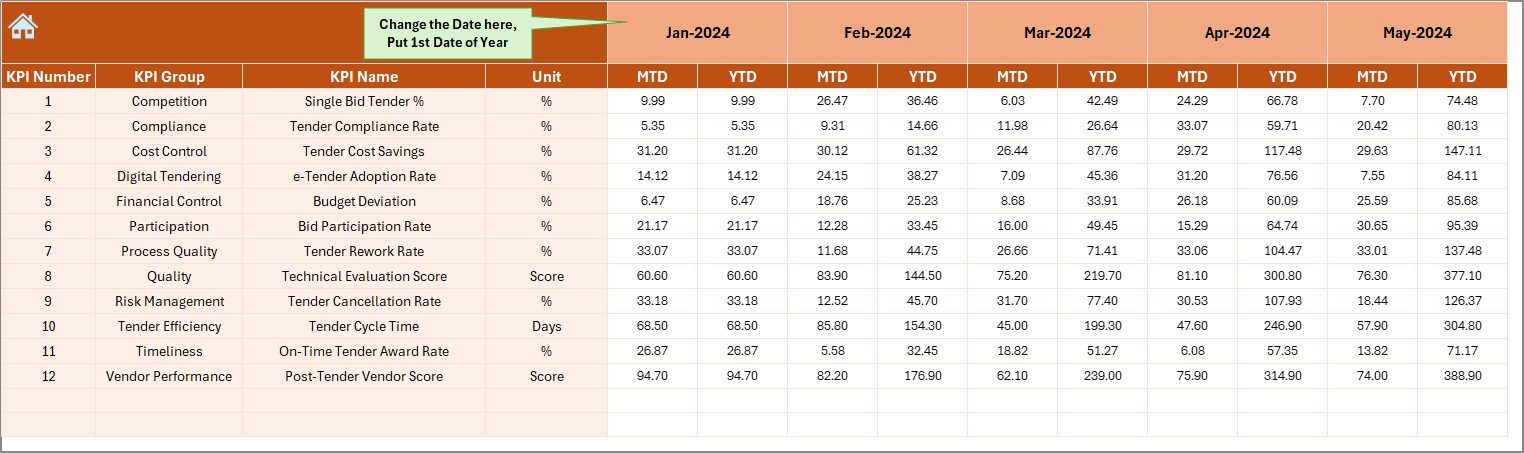
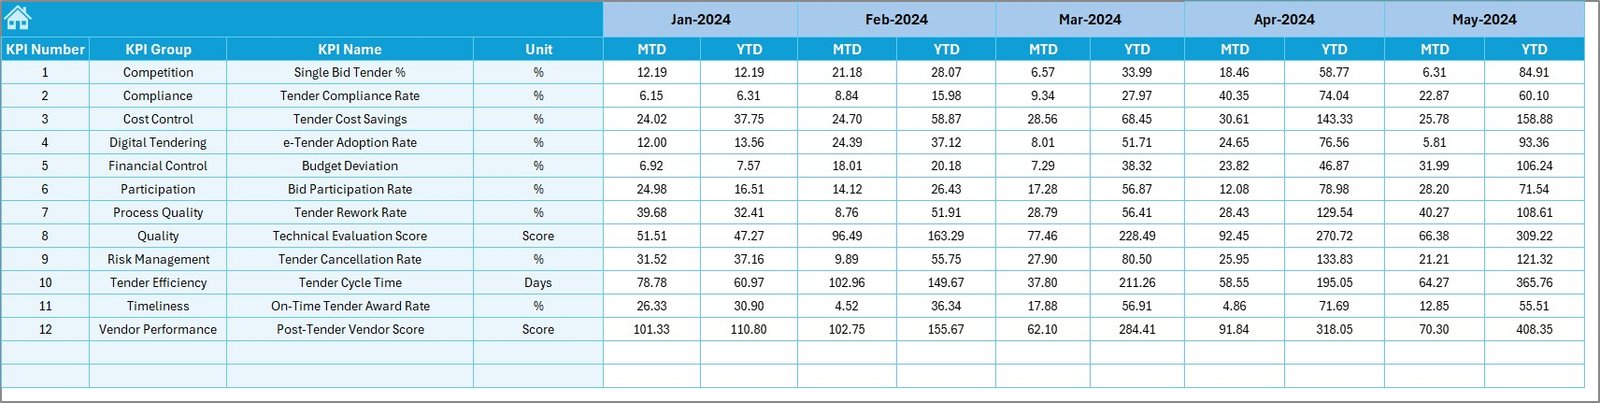
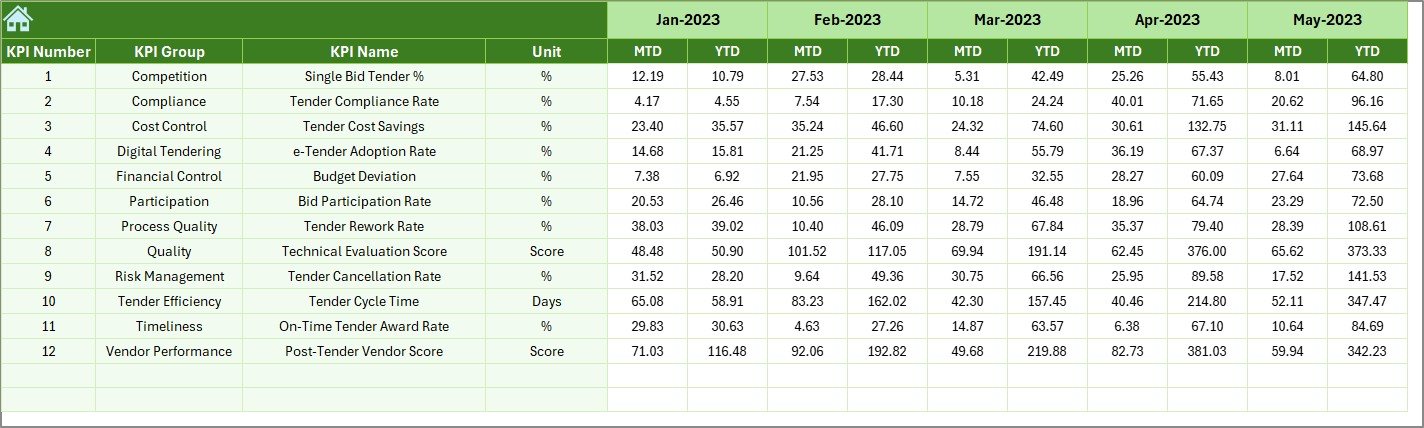
📌 Dashboard Sheet – Displays all core KPIs with MTD, YTD, Target, and Previous Year comparisons
📌 Trend Sheet – Shows KPI trends over time with MTD and YTD charts for better forecasting
📌 Actual Numbers Sheet – Dedicated area to enter current year performance data safely
📌 Target Sheet – Central location to define monthly and yearly performance targets
📌 Previous Year Sheet – Stores historical KPI data for year-over-year analysis
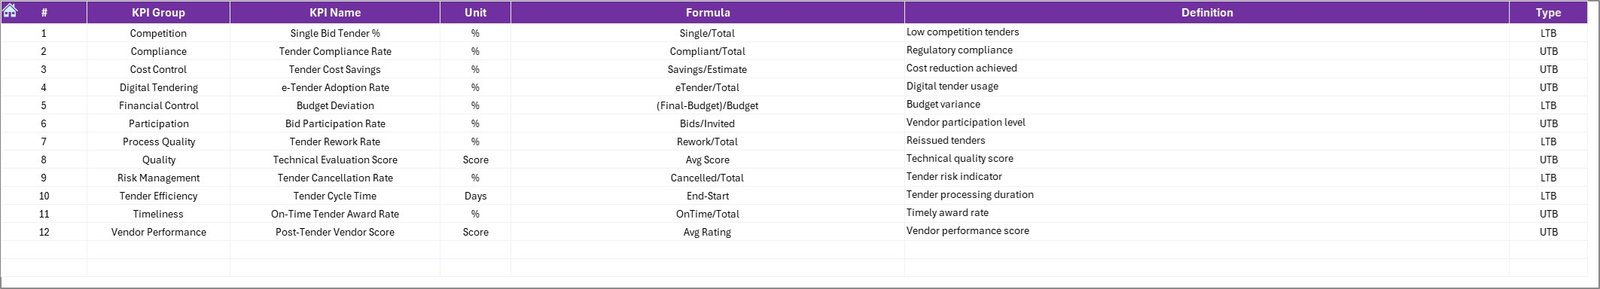
📌 KPI Definition Sheet – Documents KPI names, formulas, units, and definitions for consistency
This structure ensures clean data flow, zero confusion, and error-free reporting.
🛠️ How to Use the Refinery Tender KPI Dashboard
Using this dashboard is simple—even for non-technical users:
1️⃣ Enter KPI actual values in the Actual Numbers sheet
2️⃣ Define performance goals in the Target sheet
3️⃣ Add last year’s data in the Previous Year sheet
4️⃣ Select the desired month from the dashboard
5️⃣ Instantly analyze MTD, YTD, trends, and variances
Because formulas and visuals are already built, no advanced Excel skills are required.
👥 Who Can Benefit from This Refinery Tender KPI Dashboard
This dashboard is ideal for professionals who need accurate and fast tender insights, including:
🏭 Refinery Procurement Teams – Track tender volume, success rate, and delays
💼 Contract Management Teams – Monitor compliance and cycle time performance
💰 Finance & Cost Control Teams – Analyze savings, targets, and variances
📋 Project Management Offices (PMO) – Review tender timelines and execution efficiency
👔 Senior Management & Executives – Get a high-level snapshot for strategic decisions
Whether you manage tenders daily or review performance monthly, this dashboard fits seamlessly into your workflow.
Click here to read the Detailed blog post
Watch the step-by-step video tutorial:


Reviews
There are no reviews yet.