Managing purchasing operations in a refinery is never simple. High-value materials, strict compliance requirements, long-term supplier contracts, and volatile prices leave very little room for error. Even a minor delay or cost variance can quickly escalate into major financial losses.
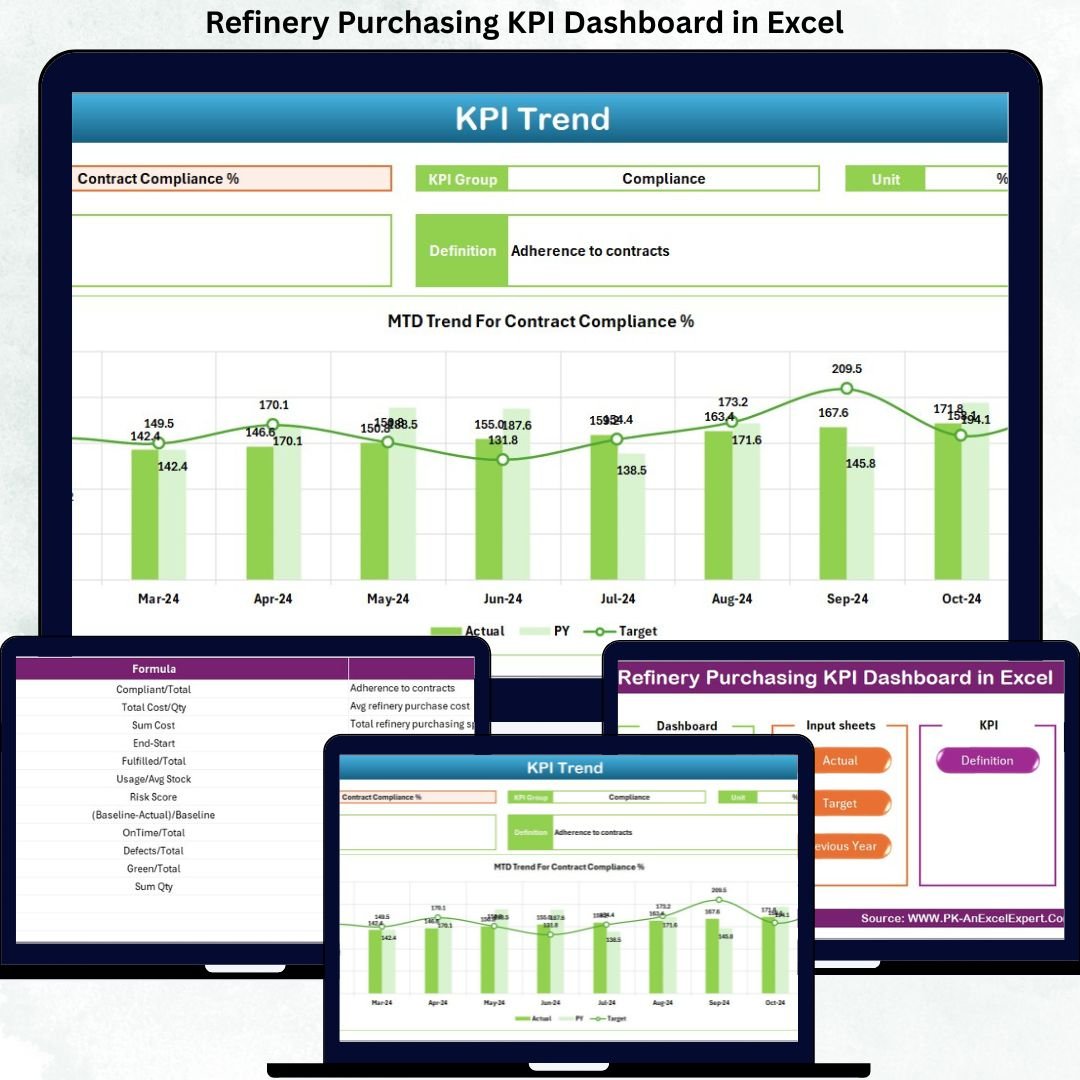
That is exactly why the Refinery Purchasing KPI Dashboard in Excel is designed to become your single source of truth for monitoring, analyzing, and improving refinery purchasing performance.
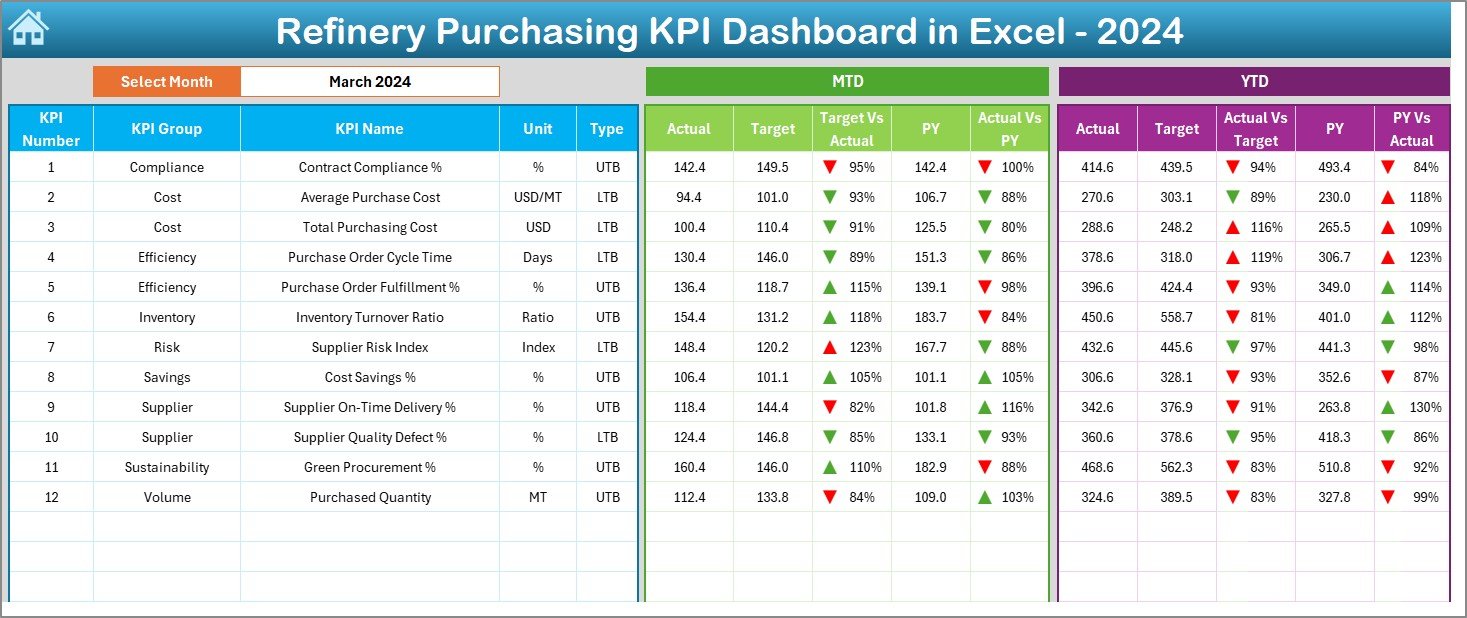
This ready-to-use Excel dashboard converts complex purchasing data into clear KPIs, comparisons, and trends—without relying on expensive BI tools or complicated systems. With dynamic MTD and YTD analysis, target vs actual comparisons, and intuitive visual indicators, purchasing teams gain instant visibility and control over refinery procurement operations.
🚀 Key Features of Refinery Purchasing KPI Dashboard in Excel
📊 Centralized KPI Monitoring – Track all refinery purchasing KPIs in one structured and interactive Excel dashboard.
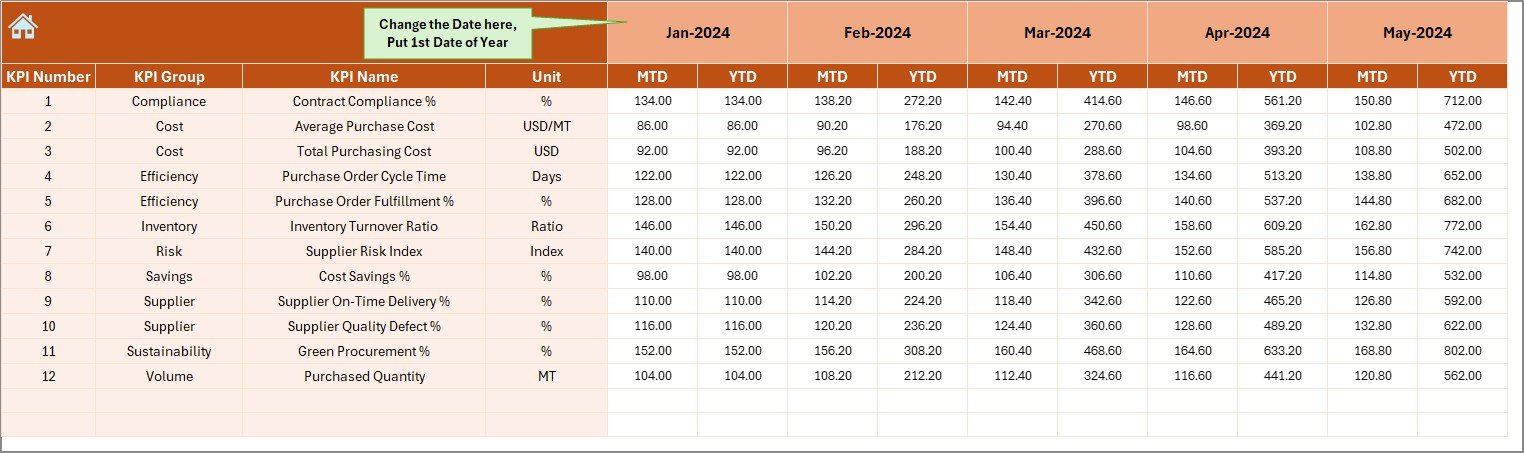
📅 Dynamic Month Selector – Change the reporting month from a single cell (D3) and watch the entire dashboard update instantly.
🎯 MTD & YTD Performance Tracking – Monitor short-term and long-term purchasing performance side by side.
📈 Target vs Actual Analysis – Identify performance gaps using automated comparisons and visual indicators.
🔁 Previous Year Benchmarking – Compare current results with historical data to evaluate improvement or decline.
⚡ Automatic Calculations – Eliminate manual work with built-in formulas and KPI logic.
🧭 Easy Navigation – Use the Summary Page with navigation buttons to jump between sheets instantly.
💼 Excel-Based & Flexible – No Power BI or external tools required—fully customizable inside Excel.
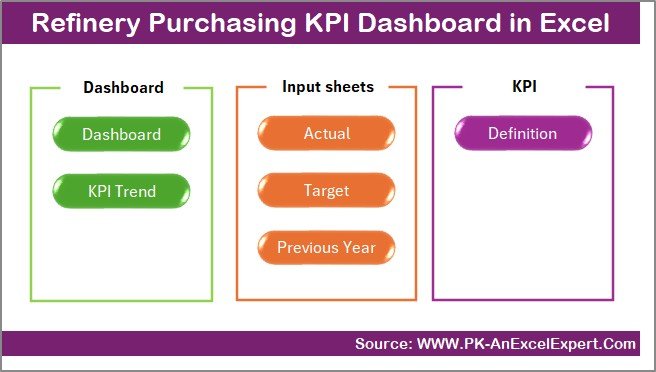
📂 What’s Inside the Refinery Purchasing KPI Dashboard in Excel
📄 Summary Page – Acts as an index and navigation hub with 6 quick-access buttons.
📊 Dashboard Sheet – Displays all purchasing KPIs with MTD & YTD actual, target, and previous-year comparisons using conditional formatting arrows.
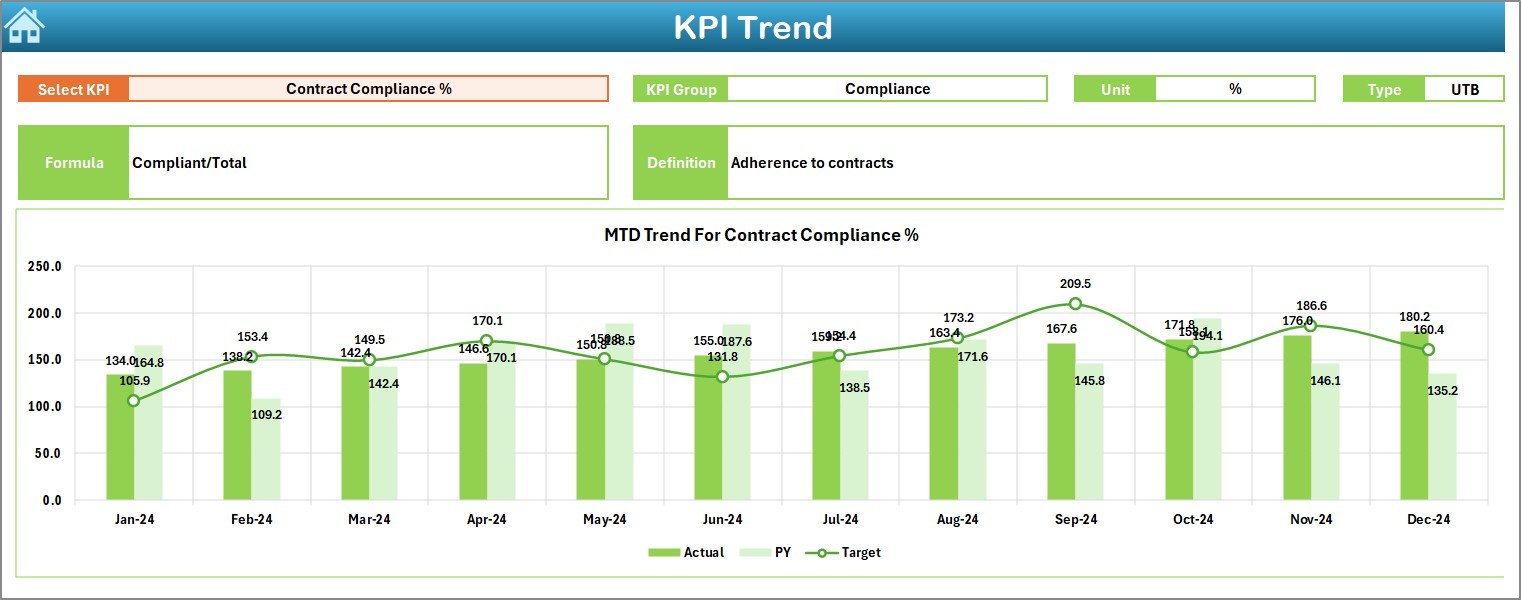
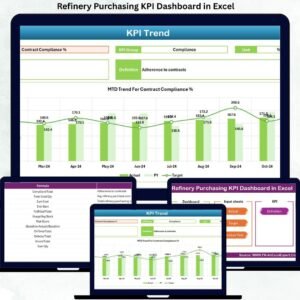
📉 Trend Sheet – Analyze KPI-wise MTD and YTD trends with KPI group, unit, formula, and definition visibility.
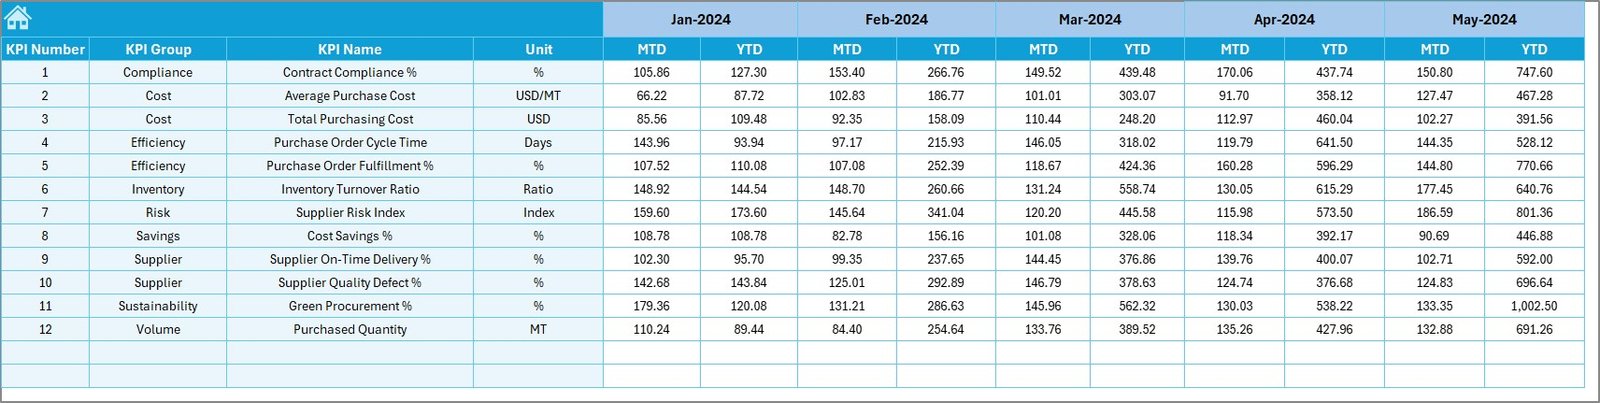
🧾 Actual Numbers Input Sheet – Enter real purchasing data with flexible month control.
🎯 Target Sheet – Define planned MTD and YTD purchasing targets for every KPI.
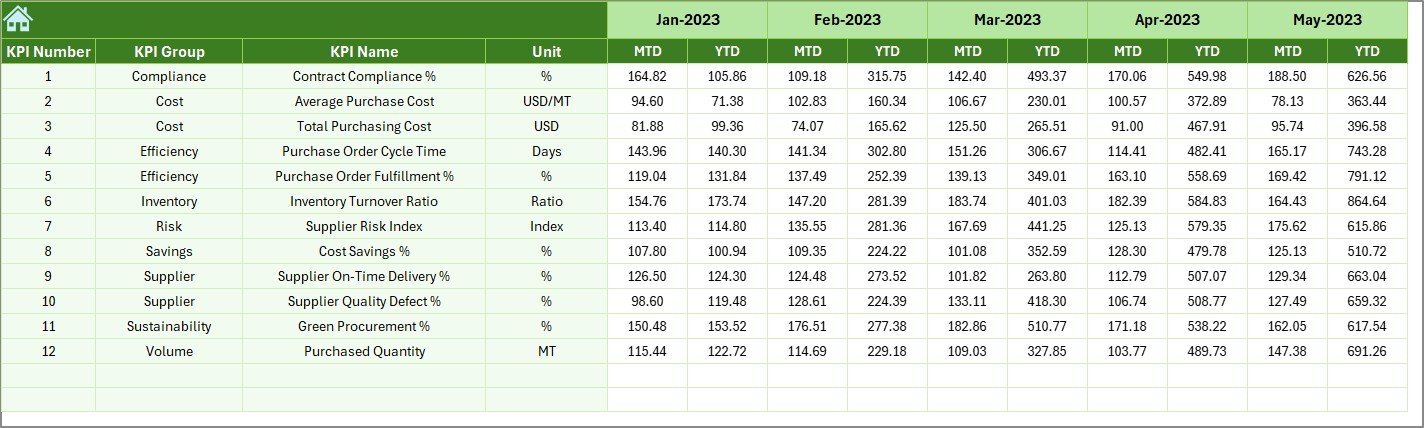
📆 Previous Year Sheet – Store historical purchasing data for benchmarking and trend comparison.
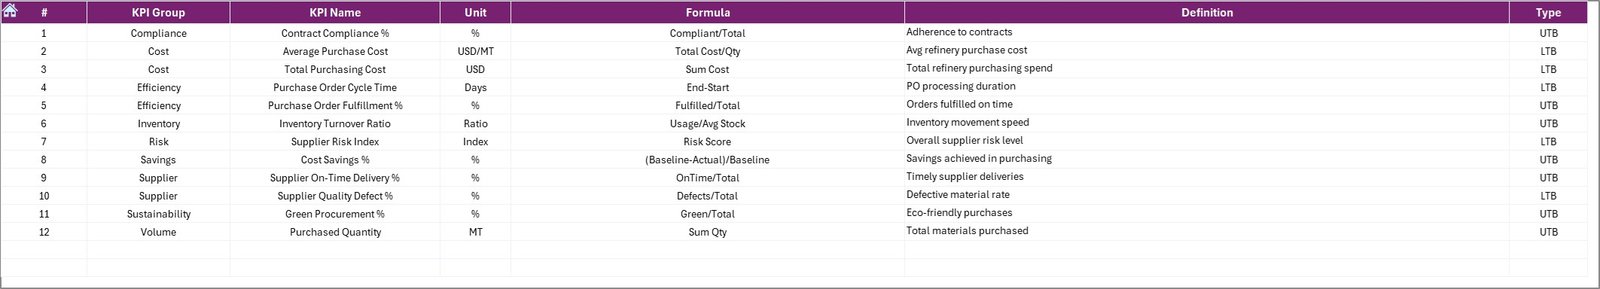
📘 KPI Definition Sheet – Clearly explains KPI names, formulas, units, and definitions for consistency across teams.
🛠️ How to Use the Refinery Purchasing KPI Dashboard in Excel
1️⃣ Enter actual purchasing data in the Actual Numbers sheet.
2️⃣ Define planned values in the Target Sheet.
3️⃣ Add historical data in the Previous Year Sheet.
4️⃣ Select the reporting month from the dashboard cell D3.
5️⃣ Review MTD and YTD performance, trends, and variances instantly.
No advanced Excel skills are required—basic Excel knowledge is enough to operate the dashboard confidently.
👥 Who Can Benefit from This Refinery Purchasing KPI Dashboard
🏭 Purchasing Managers – Track cost efficiency, savings, and supplier performance.
📦 Procurement Teams – Monitor operational KPIs and contract compliance.
📊 Supply Chain Analysts – Analyze trends and identify improvement opportunities.
💰 Finance Teams – Control budgets and evaluate purchasing impact.
🧑💼 Refinery Leadership – Make faster, data-driven purchasing decisions.
Click here to read the Detailed Blog Post
Watch the step-by-step video tutorial:


Reviews
There are no reviews yet.