Managing refinery projects is never simple. Large budgets, strict timelines, safety requirements, and multiple stakeholders make even small deviations expensive. When project data remains scattered across spreadsheets, visibility drops, decisions slow down, and risks increase.
That is exactly why the Refinery Project KPI Dashboard in Excel is designed to become your single source of truth for refinery project performance.
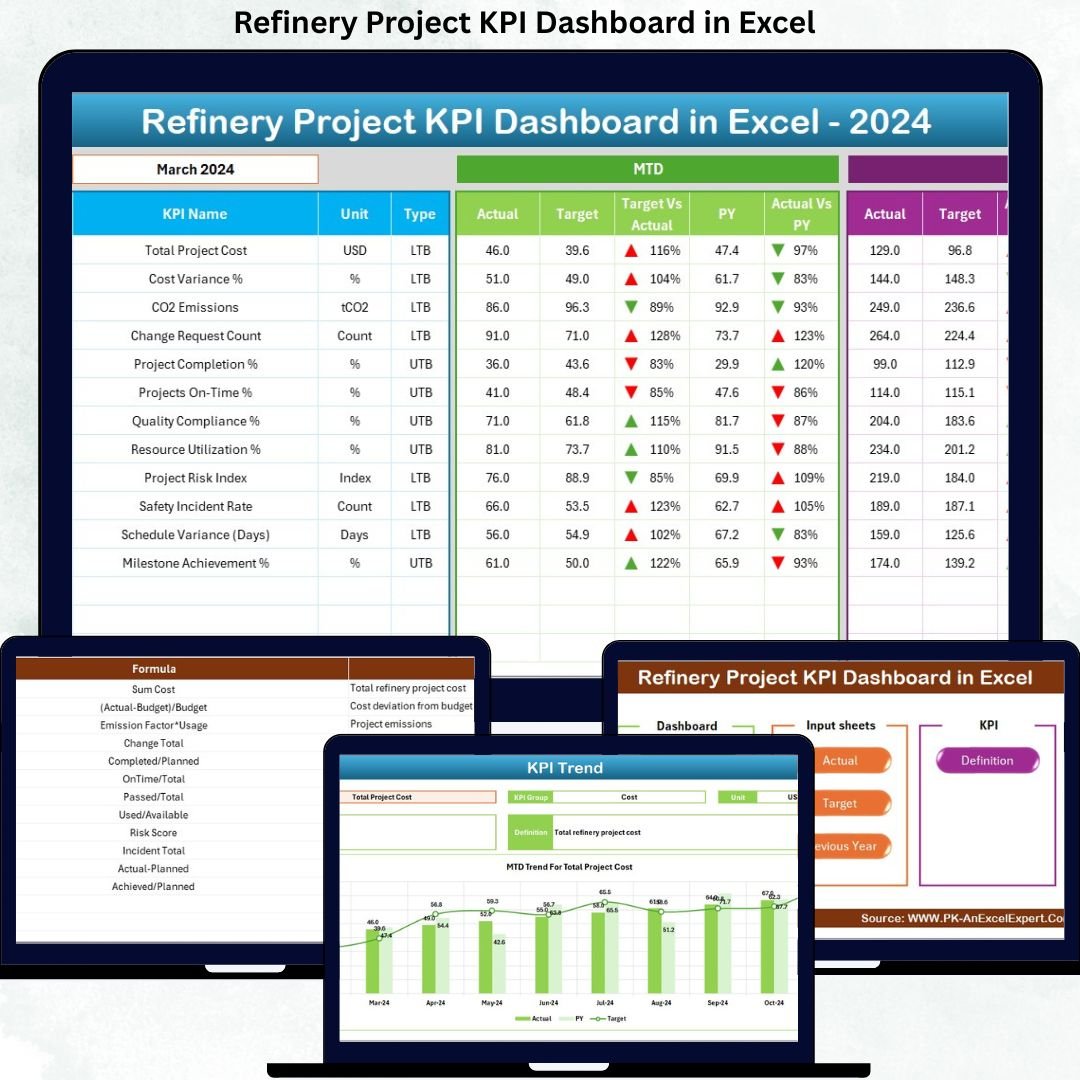
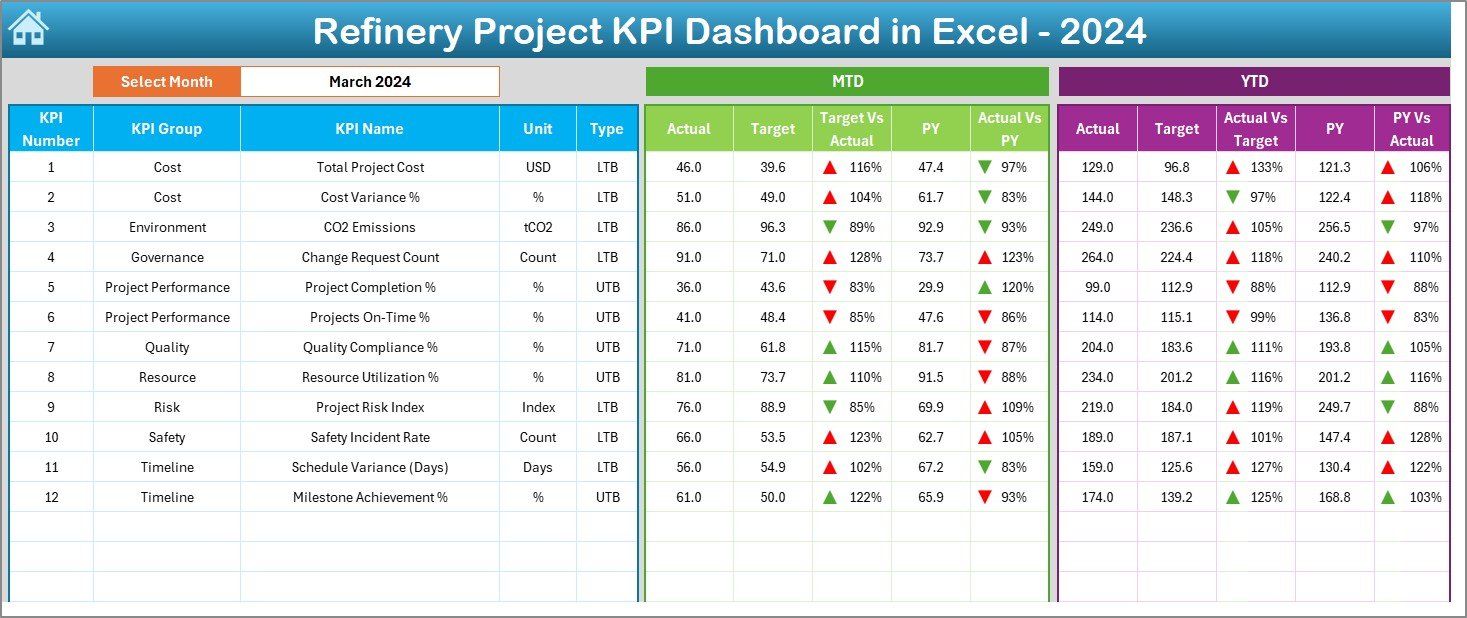
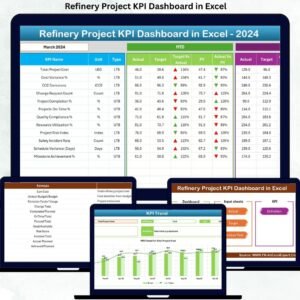
This ready-to-use Excel dashboard transforms complex refinery project data into clear KPIs, performance comparisons, and trend insights—without using expensive project management or BI tools. Instead of manually compiling reports, project teams gain instant visibility into MTD, YTD, Target, and Previous Year performance, all in one structured dashboard.
Built entirely in Microsoft Excel, this dashboard is easy to use, flexible, and accessible for both technical and non-technical users. Whether you manage plant expansions, shutdowns, pipeline projects, or equipment upgrades, this dashboard helps you stay in control from planning to execution.
✨ Key Features of the Refinery Project KPI Dashboard in Excel
🚀 Centralized KPI Monitoring
Track all refinery project KPIs in one structured and interactive Excel dashboard.
📅 Dynamic Month Selector
Change the reporting month from a single cell (D3) and watch the entire dashboard update automatically.
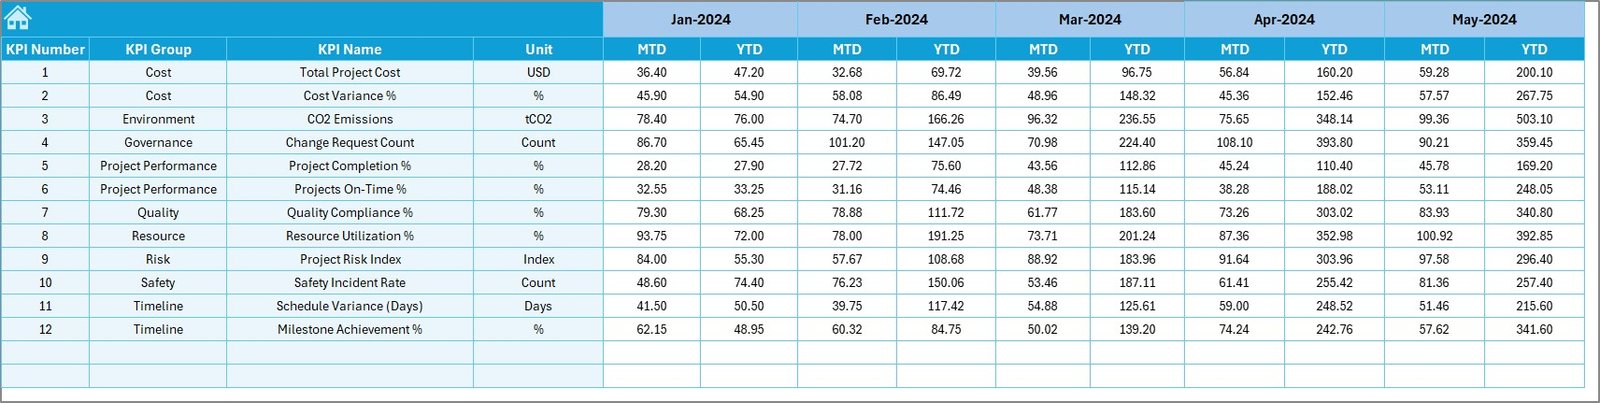
📊 MTD & YTD Performance Tracking
Monitor Month-to-Date and Year-to-Date performance with clear Actual, Target, and Previous Year values.
📈 Target vs Actual & PY Comparison
Instantly identify performance gaps using automated variance calculations.
🔽 Visual Performance Indicators
Conditional formatting with up/down arrows highlights improvement or decline instantly.
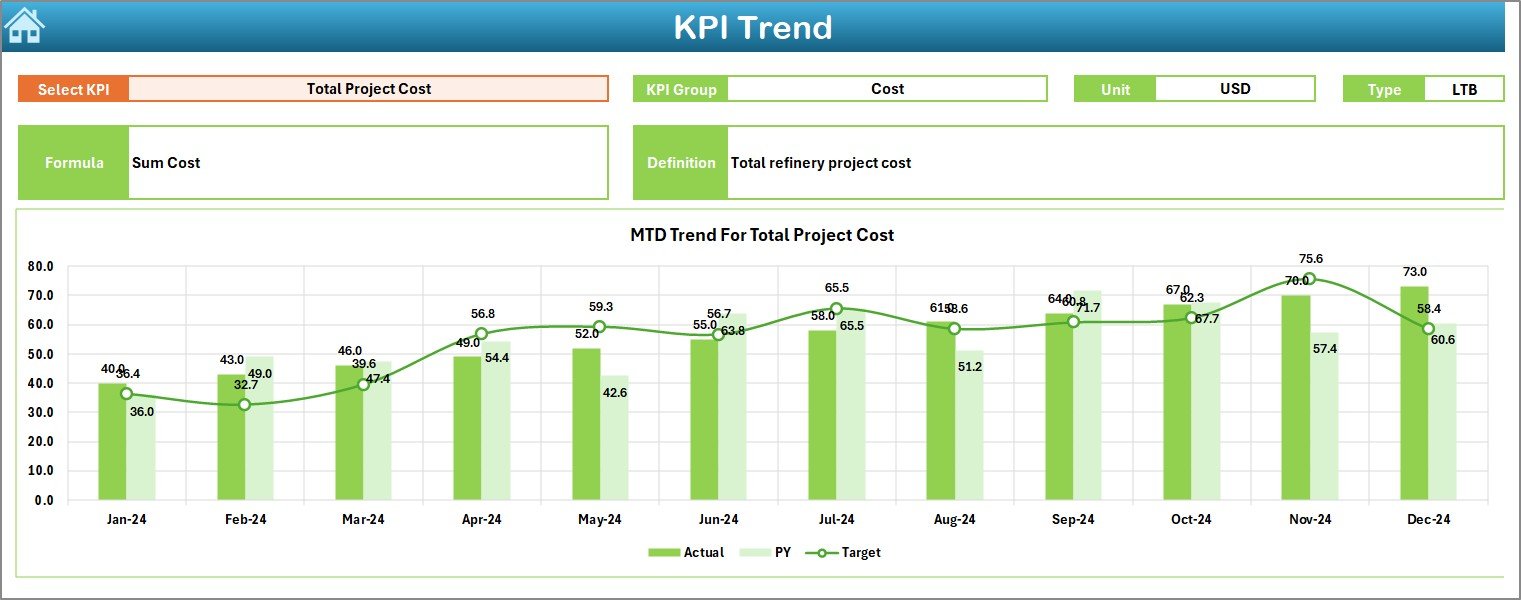
📉 Trend Analysis for Every KPI
Analyze KPI trends over time using dedicated MTD and YTD charts.
🧭 Quick Navigation Summary Page
Jump between worksheets instantly using built-in navigation buttons.
⚙️ Fully Customizable KPI Framework
Add, modify, or redefine KPIs easily using the KPI Definition sheet.
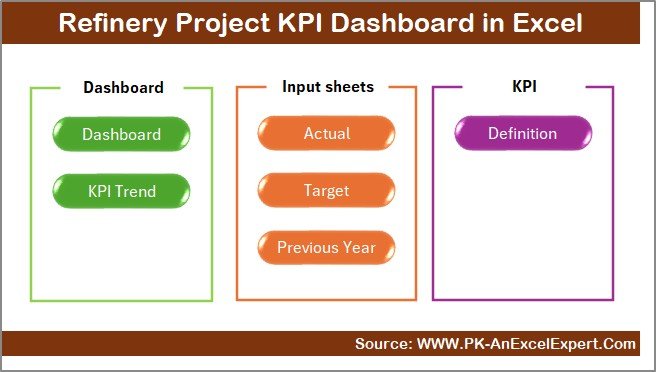
📦 What’s Inside the Refinery Project KPI Dashboard in Excel
This dashboard includes 7 professionally structured worksheets, each designed for a specific purpose:
📑 Summary Page – Navigation hub with one-click access to all worksheets
📊 Dashboard Sheet – Main KPI view with MTD, YTD, Target, and PY comparisons
📈 Trend Sheet – Detailed KPI trend analysis with KPI definitions
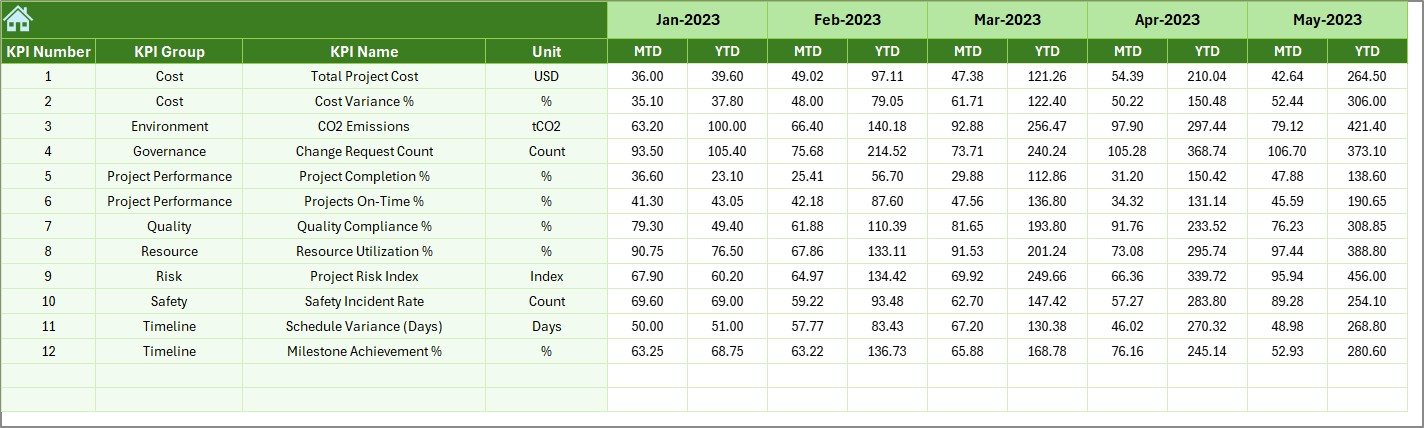
🧮 Actual Numbers Input Sheet – Structured input for actual project data
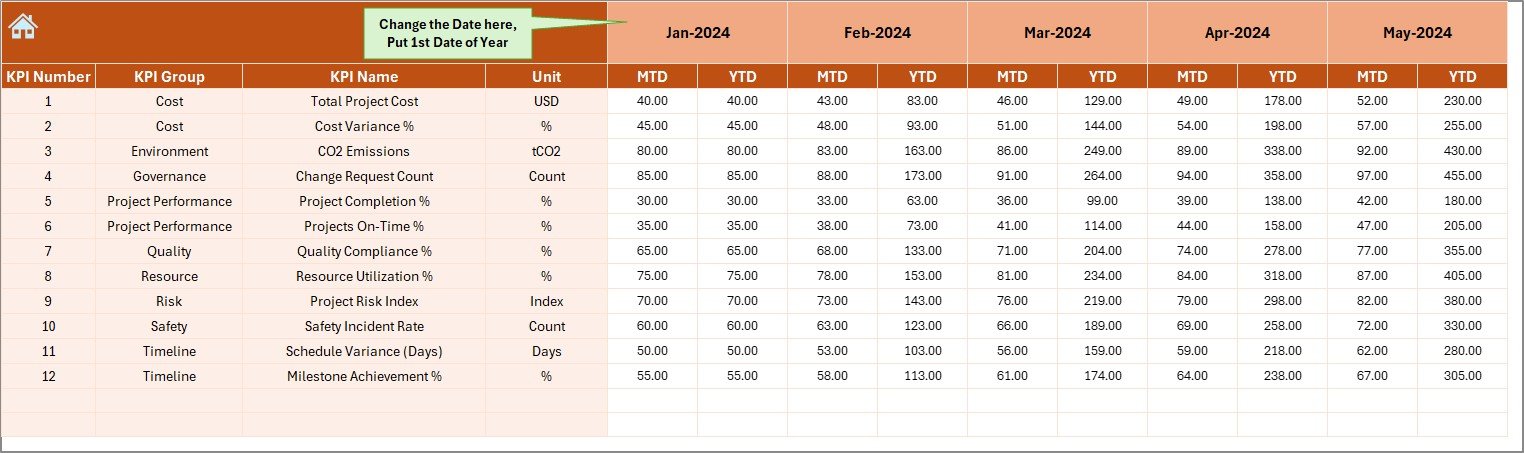
🎯 Target Sheet – Monthly and YTD target values for each KPI
📆 Previous Year Sheet – Year-over-year performance comparison
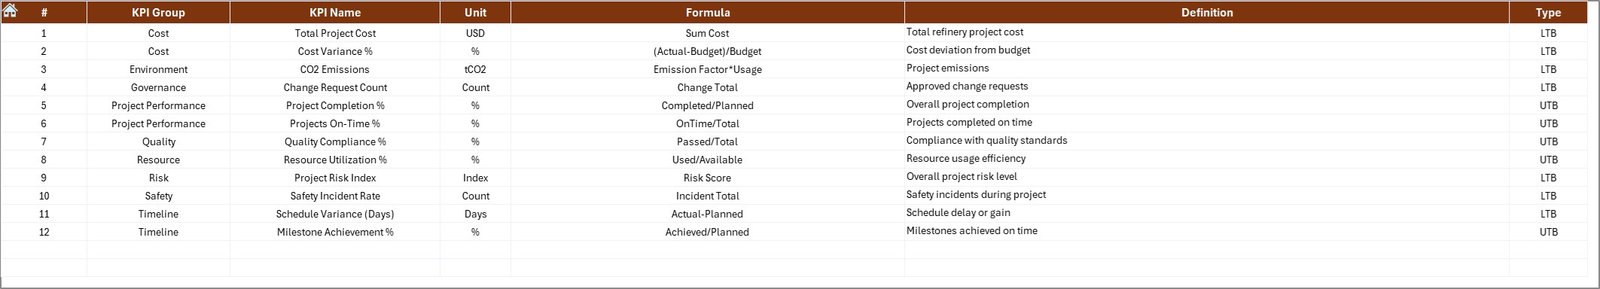
📘 KPI Definition Sheet – Clear KPI names, units, formulas, and definitions
This structure ensures clarity, consistency, and accuracy across all project reports.
🧭 How to Use the Refinery Project KPI Dashboard in Excel
Using the dashboard is simple and intuitive:
1️⃣ Enter actual project data in the Actual Numbers Input Sheet
2️⃣ Define monthly targets in the Target Sheet
3️⃣ Add previous year values in the Previous Year Sheet
4️⃣ Review and customize KPIs in the KPI Definition Sheet
5️⃣ Select the reporting month from cell D3
6️⃣ Instantly view KPIs, trends, and comparisons on the Dashboard and Trend sheets
All calculations and visuals update automatically, saving hours of manual effort.
👥 Who Can Benefit from This Refinery Project KPI Dashboard
This dashboard is ideal for:
👷 Refinery Project Managers – Track progress, delays, and performance
🏗️ Engineering Teams – Monitor execution KPIs clearly
📅 Planning & Scheduling Teams – Control timelines and milestones
💰 Finance & Cost Control Teams – Identify overruns early
⚙️ Operations Managers – Improve accountability
📊 Senior Management – Gain high-level performance visibility
Because it is Excel-based, teams can adopt it instantly without training or additional software.
Click here to read the Detailed Blog Post
Watch the step-by-step video tutorial:
🔗 Visit our YouTube channel to learn step-by-step video tutorials:
YouTube.com/@PKAnExcelExpert


Reviews
There are no reviews yet.