Managing refinery contracts is no small task. High-value vendor agreements, strict compliance clauses, penalty conditions, and long-term service commitments demand absolute control and real-time visibility. However, relying on scattered Excel sheets or static reports often leads to missed risks, delayed actions, and weak governance.
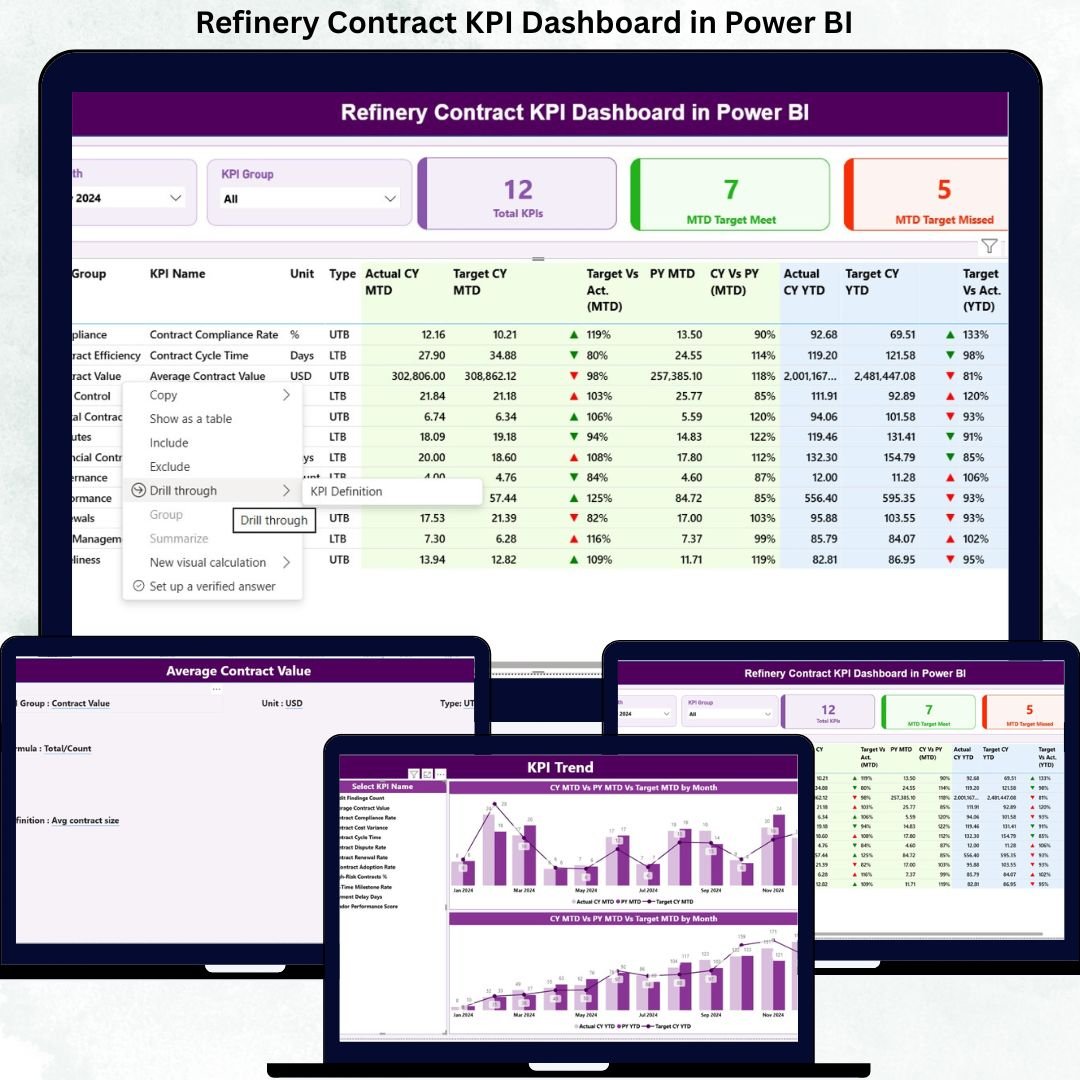
That is exactly why the Refinery Contract KPI Dashboard in Power BI is a must-have analytical solution for modern refineries. This ready-to-use dashboard transforms raw contract data into clear KPIs, visual indicators, performance trends, and target comparisons—all in one powerful Power BI report. As a result, refinery teams gain instant clarity and make faster, data-driven decisions with confidence.
🔑 Key Features of Refinery Contract KPI Dashboard in Power BI
📊 Centralized Contract Performance Tracking
Monitor all refinery contract KPIs from a single interactive dashboard instead of managing multiple files.
📅 Dynamic Month & KPI Group Slicers
Filter performance instantly by reporting month or contract category for focused and quick analysis.
🎯 MTD & YTD Target vs Actual Analysis
Track Month-to-Date and Year-to-Date performance with automated calculations.
🚦 LTB & UTB KPI Logic Support
Built-in logic for Lower the Better and Upper the Better KPIs ensures accurate status indicators.
📈 Trend Analysis with Combo Charts
Visualize Actual vs Target vs Previous Year trends to identify patterns and performance gaps.
📘 Drill-Through KPI Definitions
Understand KPI formulas, logic, and definitions instantly with a dedicated KPI Definition page.
⚡ Excel-Driven & Easy to Maintain
No complex integrations—just update Excel data and refresh Power BI.
📦 What’s Inside the Refinery Contract KPI Dashboard in Power BI
This digital product includes a professionally designed Power BI file with three structured pages:
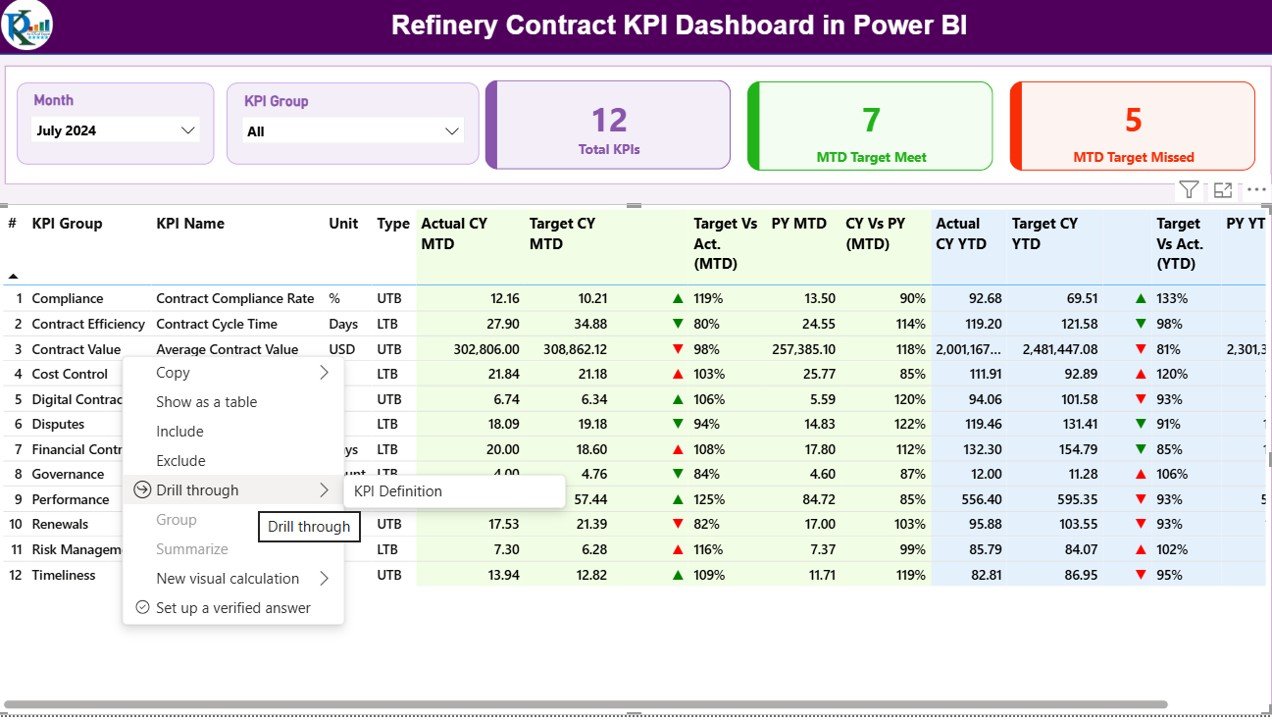
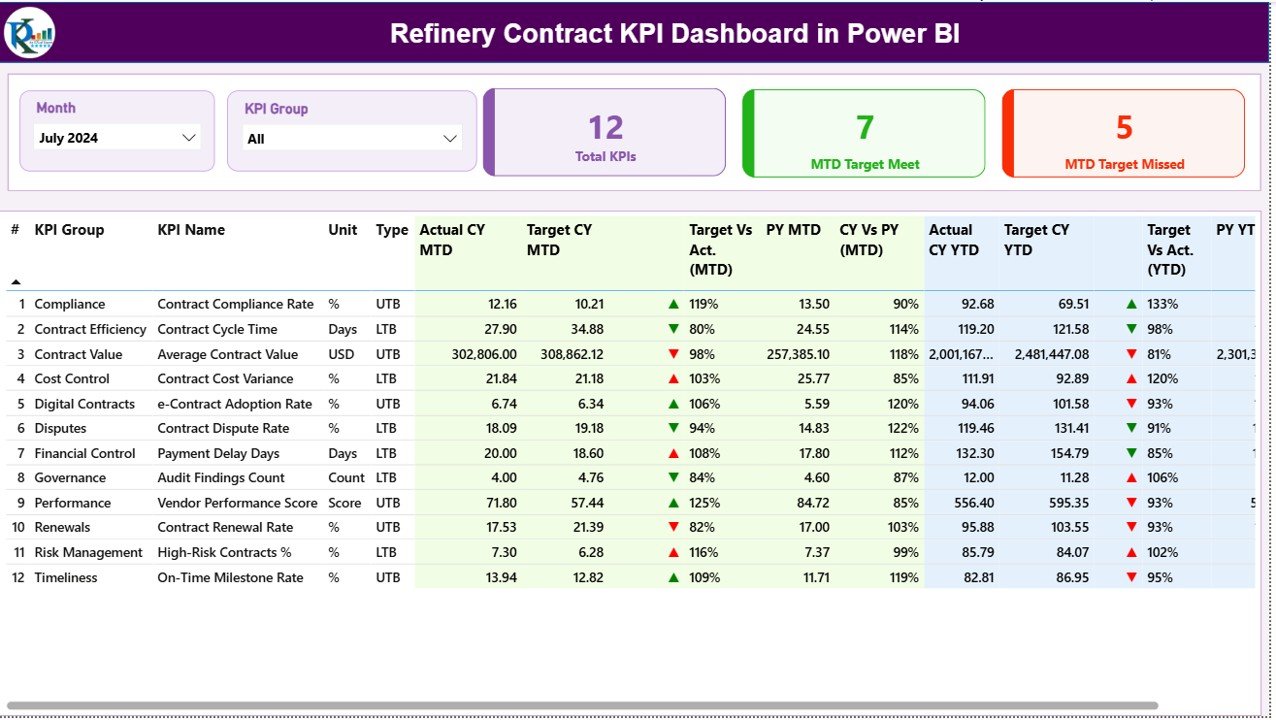
📍 Summary Page
A complete performance snapshot with KPI cards, dynamic slicers, and a detailed KPI table showing MTD and YTD results, icons, and comparisons with previous year values.
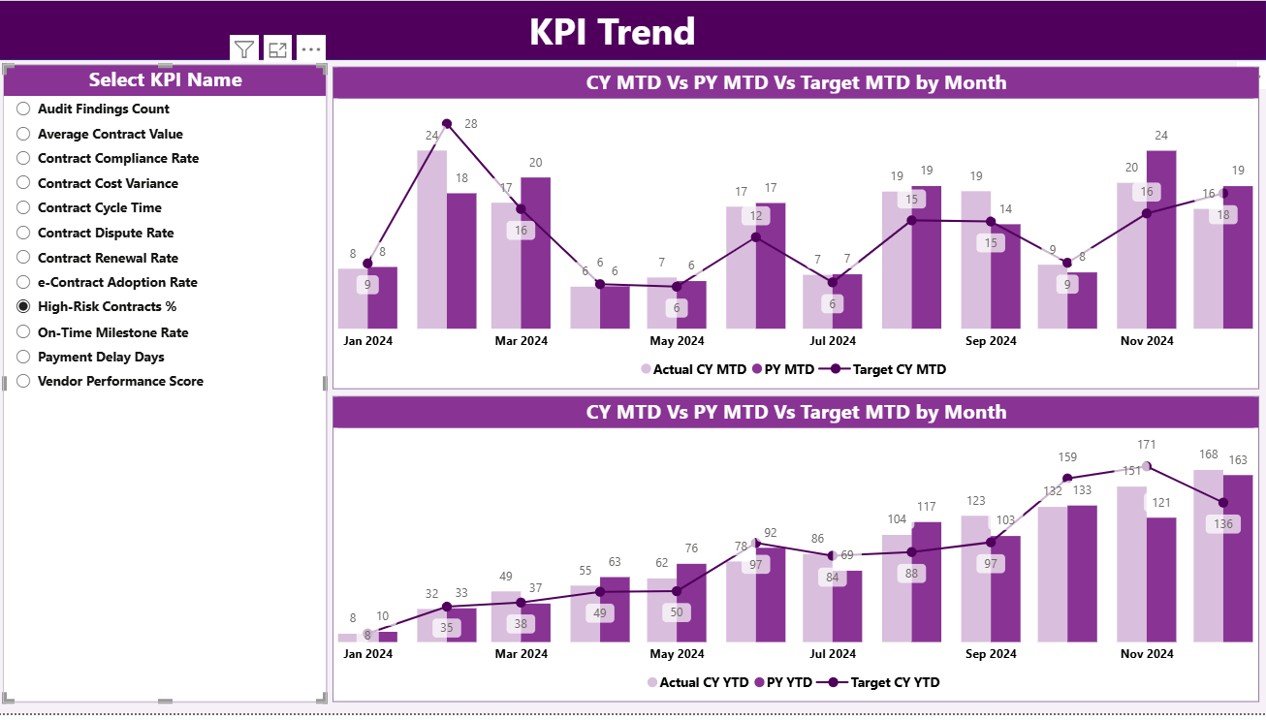
📍 KPI Trend Page
Two powerful combo charts display monthly MTD and YTD trends, helping teams identify improving or declining contract performance.
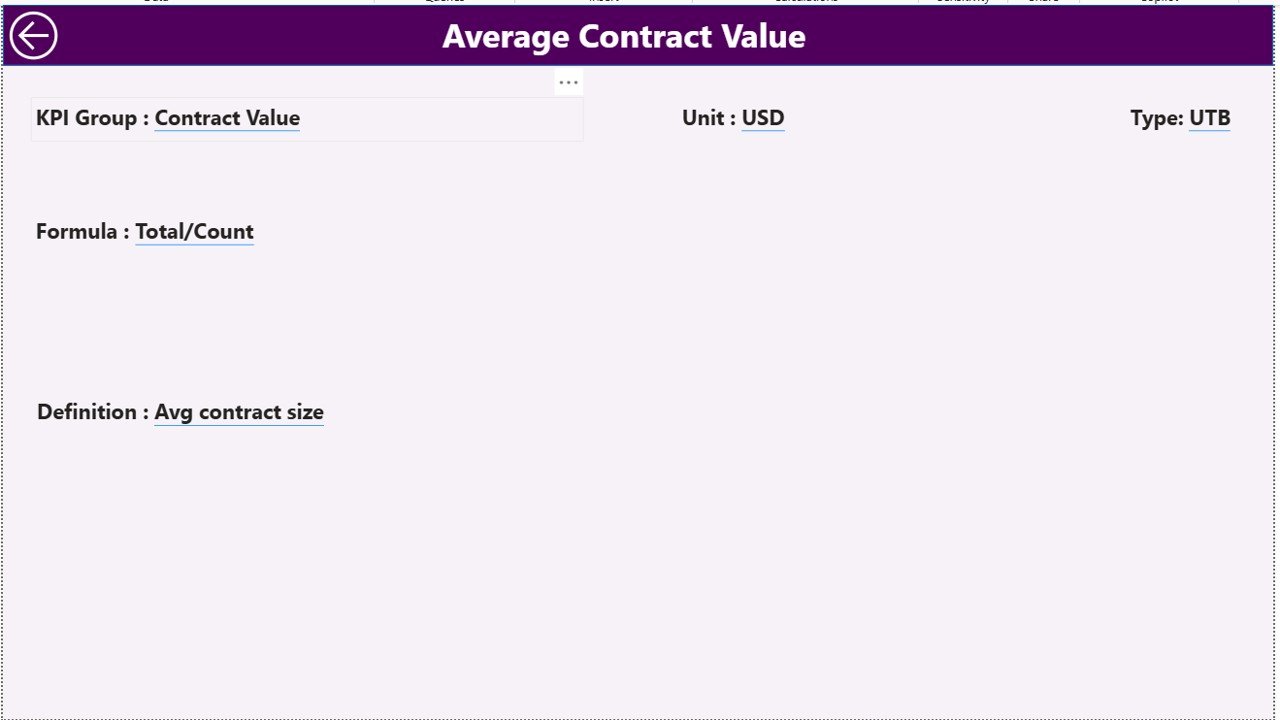
📍 KPI Definition Page (Drill-Through)
A hidden governance page showing KPI formulas, definitions, units, and logic—ensuring transparency and consistency.
Additionally, the dashboard connects to a structured Excel data model, including:
-
Input_Actual sheet
-
Input_Target sheet
-
KPI Definition sheet
This structure keeps the solution flexible, scalable, and easy to customize.
🛠 How to Use the Refinery Contract KPI Dashboard in Power BI
Using this dashboard is simple and efficient:
1️⃣ Enter actual KPI values in the Excel input sheet
2️⃣ Define monthly and yearly targets
3️⃣ Maintain KPI definitions and logic
4️⃣ Refresh the Power BI dashboard
5️⃣ Instantly analyze MTD, YTD, trends, and variances
Because of this design, even users with basic Power BI knowledge can operate it confidently.
🎯 Who Can Benefit from This Refinery Contract KPI Dashboard in Power BI
This dashboard is ideal for:
👔 Contract Managers – Monitor SLA compliance and contract health
📦 Procurement Teams – Track vendor performance and penalties
💰 Finance Teams – Analyze cost efficiency and contract value
⚙ Operations Managers – Identify operational risks early
📋 Compliance Officers – Support audit-ready reporting
🏢 Senior Leadership – Gain high-level visibility for strategic decisions
Its flexibility allows adaptation across multiple refinery contract categories.
Click here to read the Detailed Blog Post
Watch the step-by-step video tutorial:


Reviews
There are no reviews yet.