In today’s sustainability-driven world, recycling companies must operate with precision, transparency, and accountability. However, many recycling plants still rely on scattered spreadsheets and manual reports. As a result, managers struggle to track collection volumes, contamination rates, processing efficiency, and revenue per ton in one centralized view.
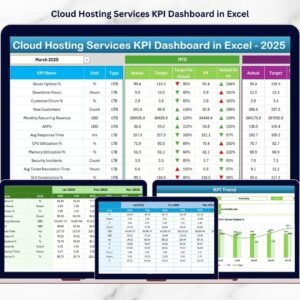
That’s exactly why we created the Recycling Companies KPI Dashboard in Excel — a powerful, ready-to-use performance management solution built specifically for recycling and waste management businesses.
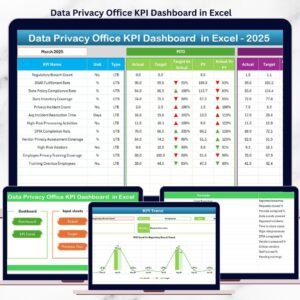
This interactive Excel dashboard transforms raw operational data into structured, meaningful insights. With automated MTD and YTD comparisons, target tracking, and previous year analysis, your organization gains full visibility into operational, financial, and sustainability performance.
Whether you run a material recovery facility (MRF), waste collection company, or recycling plant, this dashboard helps you monitor KPIs smarter and faster.
🔑 Key Feature of Recycling Companies KPI Dashboard in Excel
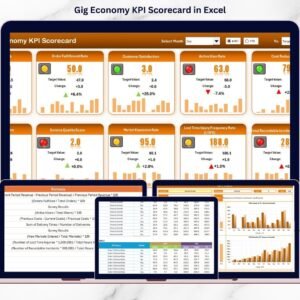
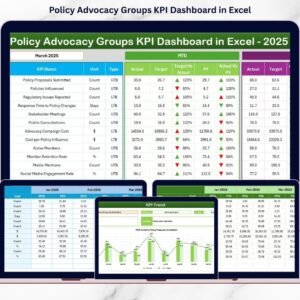
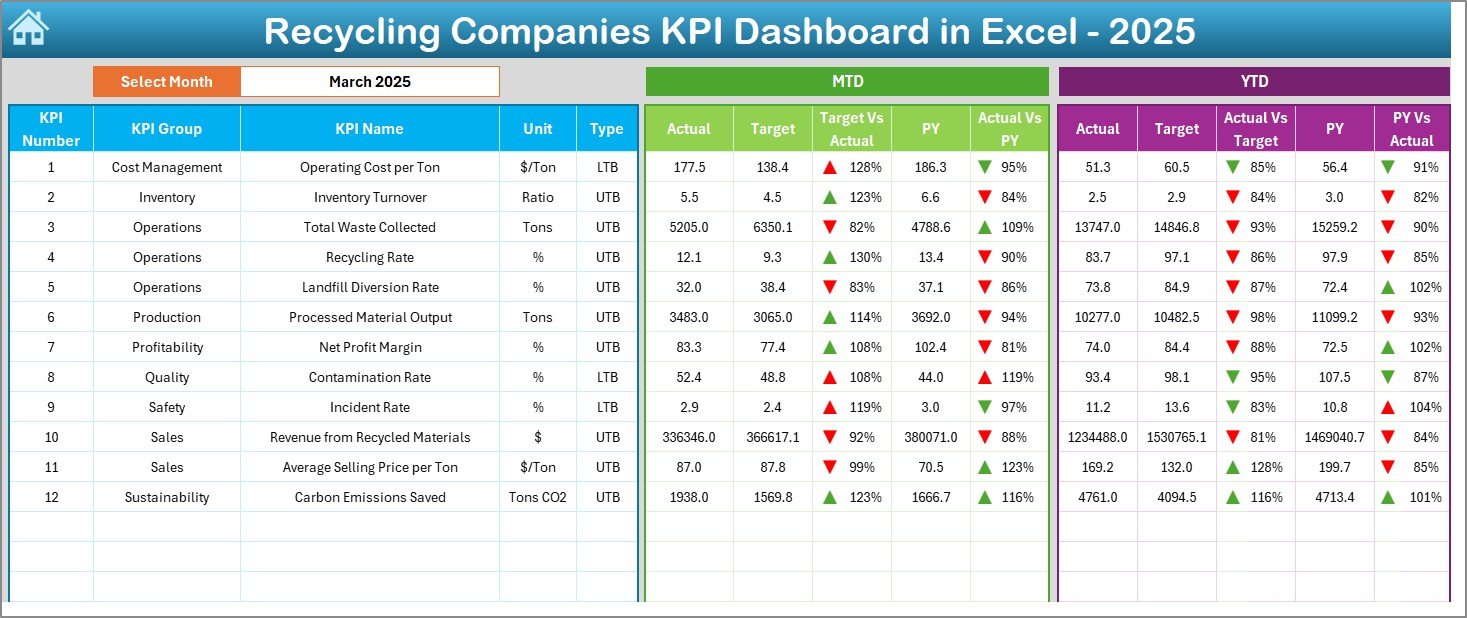
✨ Dynamic Executive Dashboard
Monitor all operational, financial, and sustainability KPIs in one consolidated view.
📊 Smart Month Selector (Cell D3)
Change the month and instantly update the entire dashboard.
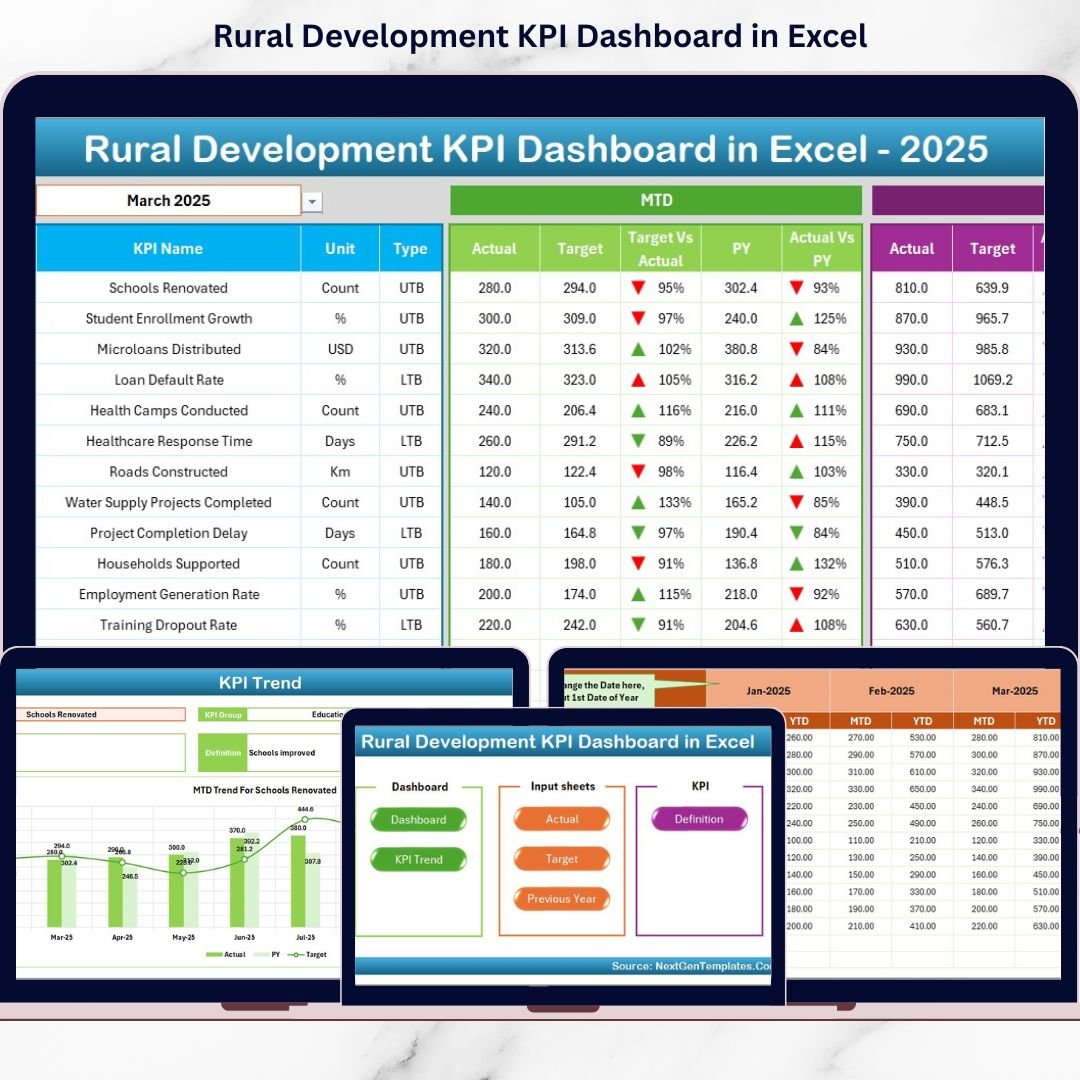
🎯 MTD & YTD Tracking
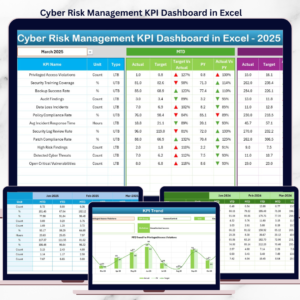
Compare Actual vs Target vs Previous Year with automated variance indicators.
📈 Conditional Formatting Arrows
Quickly spot performance improvements or declines with visual up/down signals.
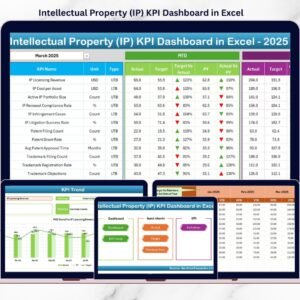
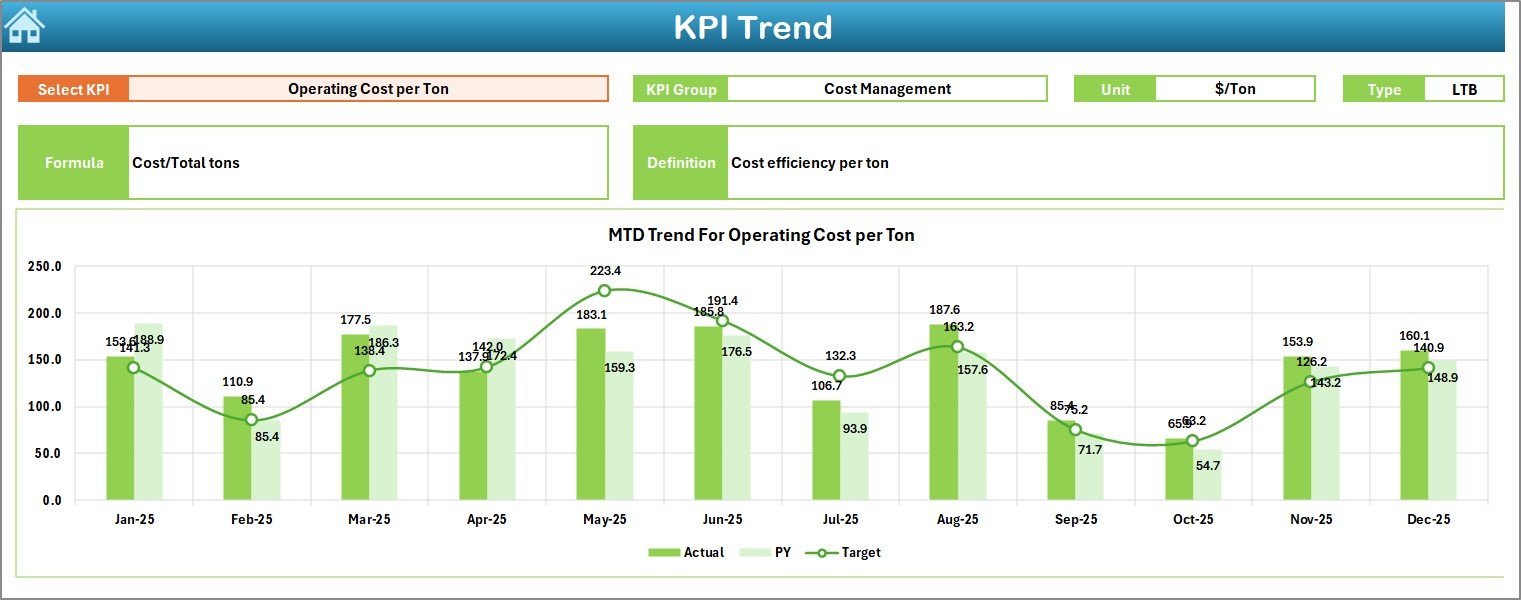
🔍 KPI Trend Deep Dive
Analyze individual KPIs using interactive trend charts.
🧭 User-Friendly Home Navigation
Six clickable buttons for smooth sheet navigation.
⚡ Automated Calculations
Built-in formulas eliminate manual reporting effort.
🧩 Fully Customizable Structure
Add or modify KPIs based on your recycling business needs.
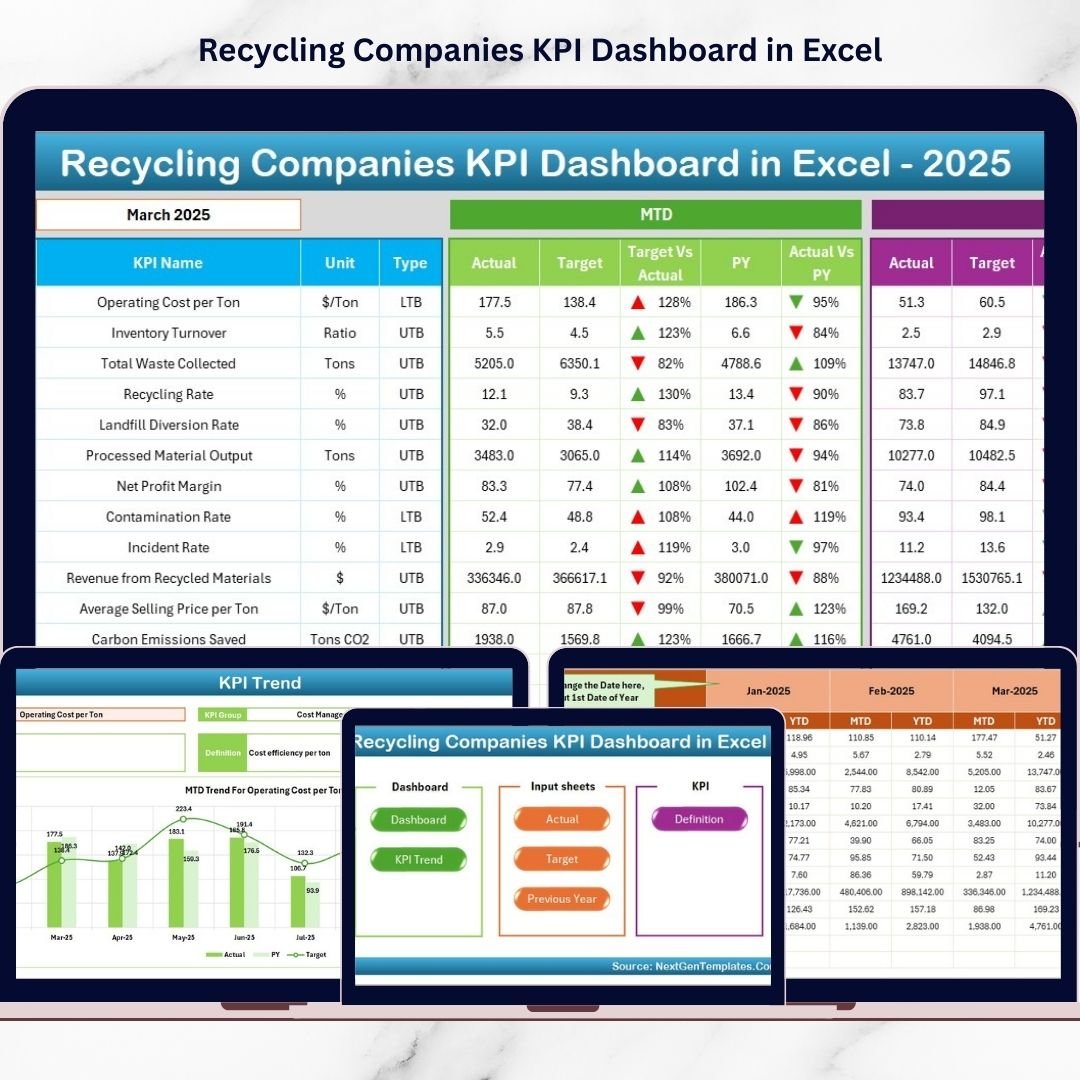
📦 What’s Inside the Recycling Companies KPI Dashboard in Excel
This template includes 7 structured worksheets designed for complete KPI control.
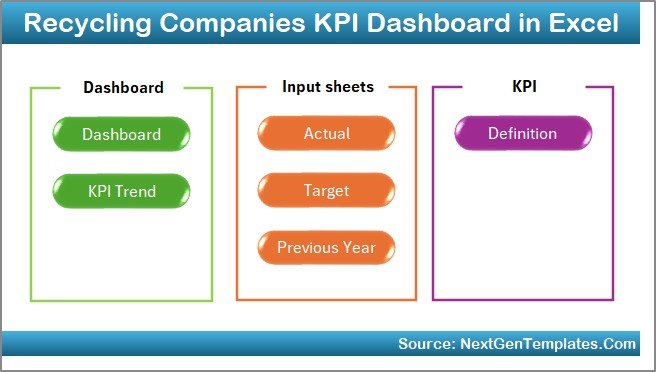
✔️ Home Sheet (Navigation Hub)
✔️ Dashboard Sheet (Main KPI Summary)
✔️ KPI Trend Sheet (Detailed Analysis)
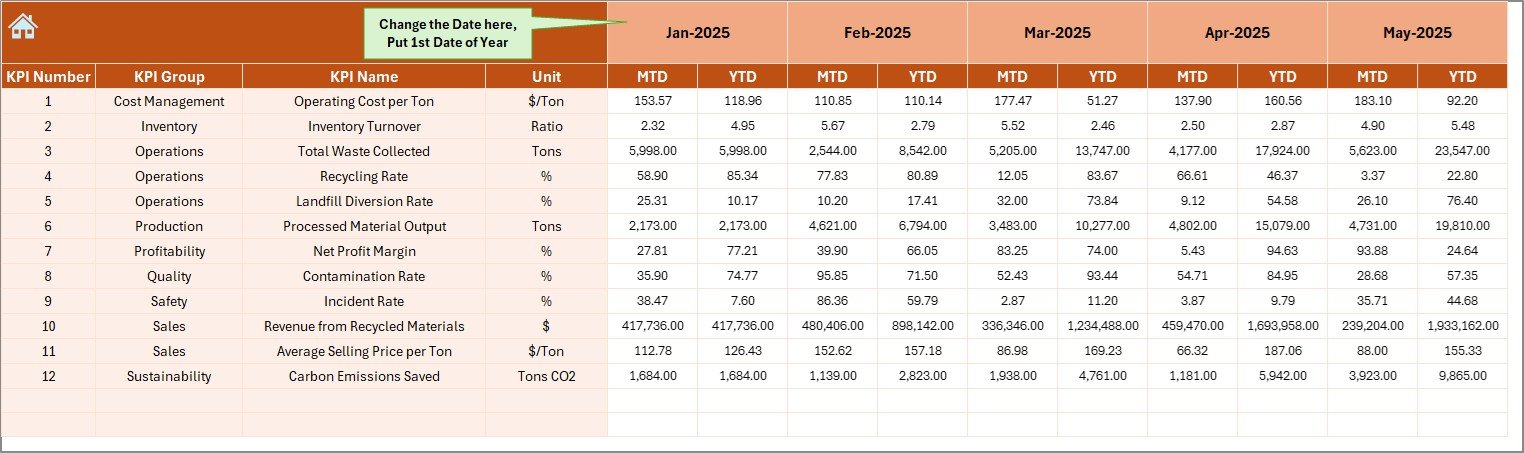
✔️ Actual Numbers Input Sheet
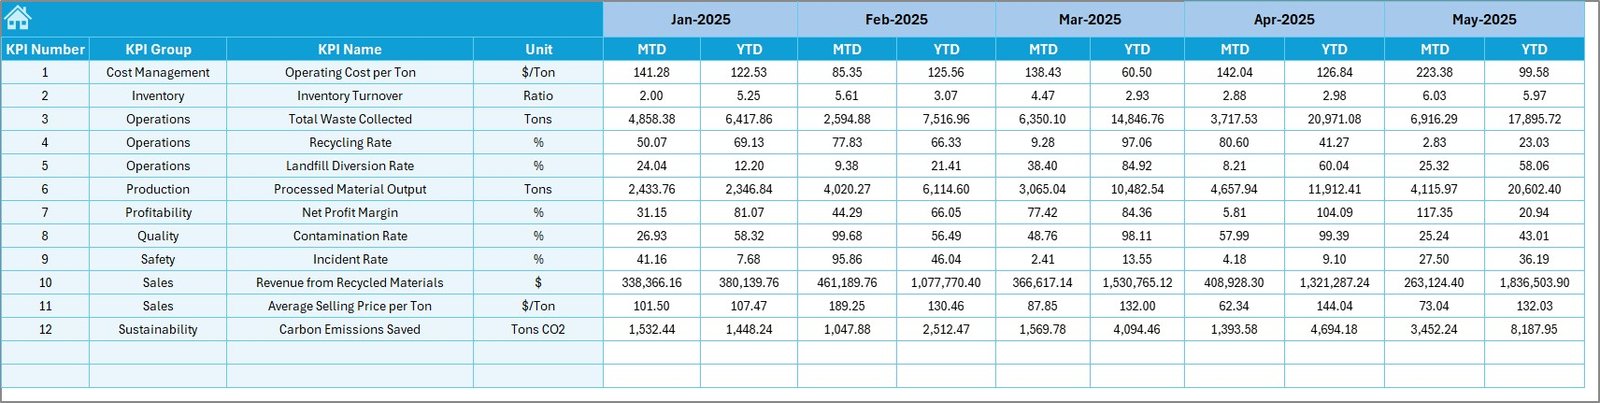
✔️ Target Sheet
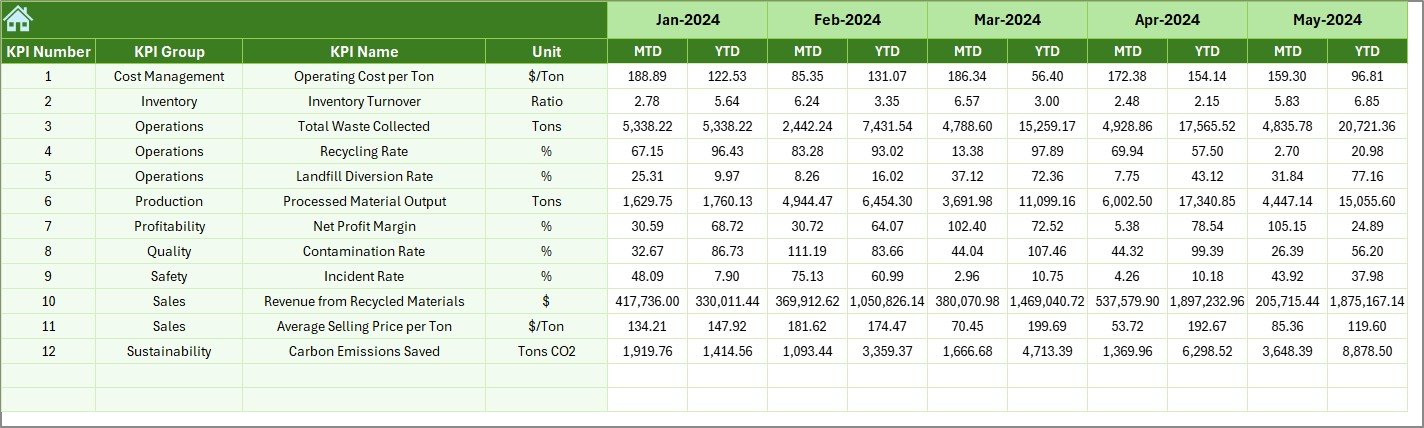
✔️ Previous Year Numbers Sheet
✔️ KPI Definition Sheet
Everything is pre-configured so you can start tracking performance immediately.
🛠️ How to Use the Recycling Companies KPI Dashboard in Excel
Getting started is simple and efficient.
Step 1: Download and open the Excel file
Step 2: Enter actual operational data in the Actual Numbers sheet
Step 3: Update target and previous year numbers
Step 4: Select the month in Cell D3
Step 5: Review KPI performance and trends
Within minutes, your recycling operations will have a professional analytics command center.
🎯 Who Can Benefit from This Recycling Companies KPI Dashboard in Excel
This dashboard is ideal for recycling and environmental service providers.
✅ Recycling Plant Managers
✅ Waste Management Companies
✅ Material Recovery Facilities (MRFs)
✅ Environmental Service Providers
✅ Operations Teams
✅ Finance Managers
✅ Sustainability Officers
If your organization wants stronger cost control, operational efficiency, and sustainability visibility, this tool is essential.
Why This Dashboard Is a Game-Changer
Unlike manual spreadsheets, this dashboard provides:
✔️ Centralized KPI monitoring
✔️ Real-time performance tracking
✔️ Target vs Actual comparison
✔️ Previous Year growth analysis
✔️ Operational efficiency tracking
✔️ Sustainability impact measurement
As a result, your business moves from reactive reporting to proactive performance management.
### Click hare to read the Detailed blog post
📺 Visit our YouTube channel to learn step-by-step video tutorials
👉 Youtube.com/@PKAnExcelExpert