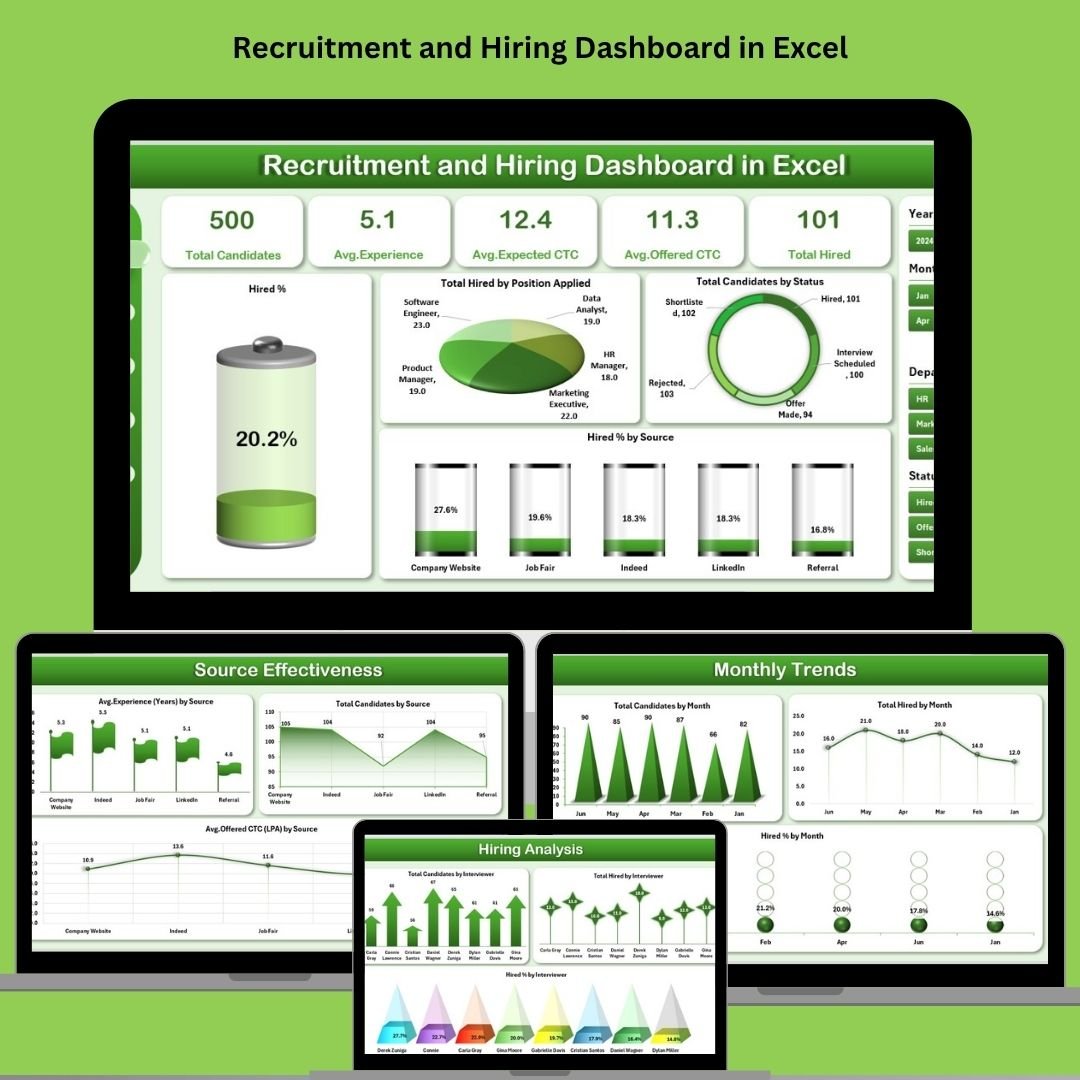

In today’s competitive hiring landscape, speed and precision matter. The Recruitment and Hiring Dashboard in Excel is the all-in-one tool your HR team needs to track, analyze, and optimize the entire recruitment process—without the need for expensive HR software. 📈💼
From sourcing candidates to evaluating interviewer success, this ready-to-use Excel dashboard provides real-time insights across every stage of recruitment. It empowers HR teams to make data-driven decisions, streamline workflows, and improve hiring outcomes—right from within Excel!
🔧 Key Features of the Recruitment and Hiring Dashboard
🧭 Page Navigator Panel
Quickly switch between multiple analytics views using the left-hand navigation menu. No more hunting for sheets—just one click to access:
-
Overview
-
Source Effectiveness
-
Department Analysis
-
Hiring Analysis
-
Monthly Trends
📊 Overview Page – Your Recruitment Control Room
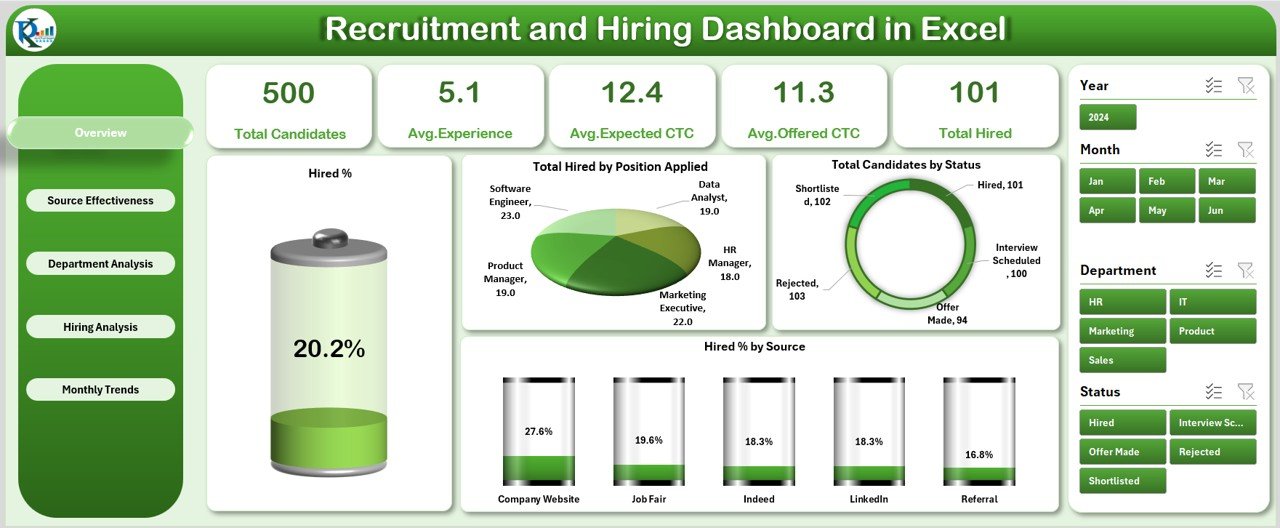
Get a complete snapshot of your recruitment pipeline with:
-
✅ Hired % – See the overall hiring rate
-
📌 Candidates by Status – Visualize active, rejected, and hired candidates
-
📍 Hired % by Source – Identify top-performing channels
-
📌 Total Hires by Role – Track which positions are being filled
-
🎯 Slicers for filtering by department, month, or source
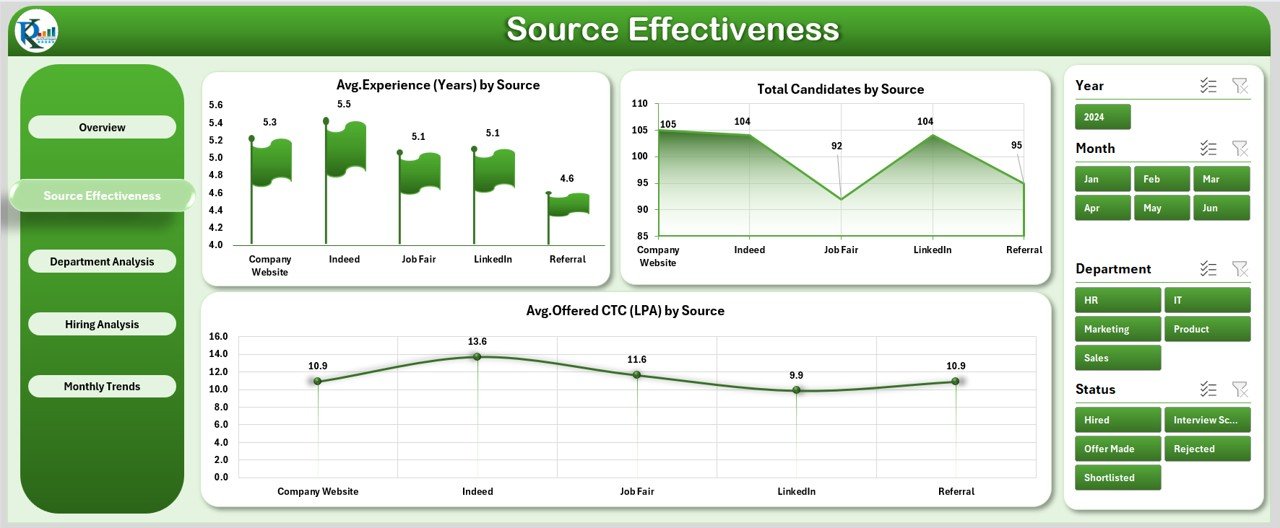
🔍 Source Effectiveness Page
Analyze how different channels perform:
-
Avg. Experience (Years) by Source
-
Avg. Offered CTC (LPA) by Source
-
Total Candidates by Source
Perfect for optimizing recruitment spending!
🏢 Department Analysis Page
Zoom into hiring metrics by department:
-
Hired % by Department
-
Avg. Experience by Department
-
Avg. Salary Offered (LPA) by Department
Use this page to balance hiring needs across teams.
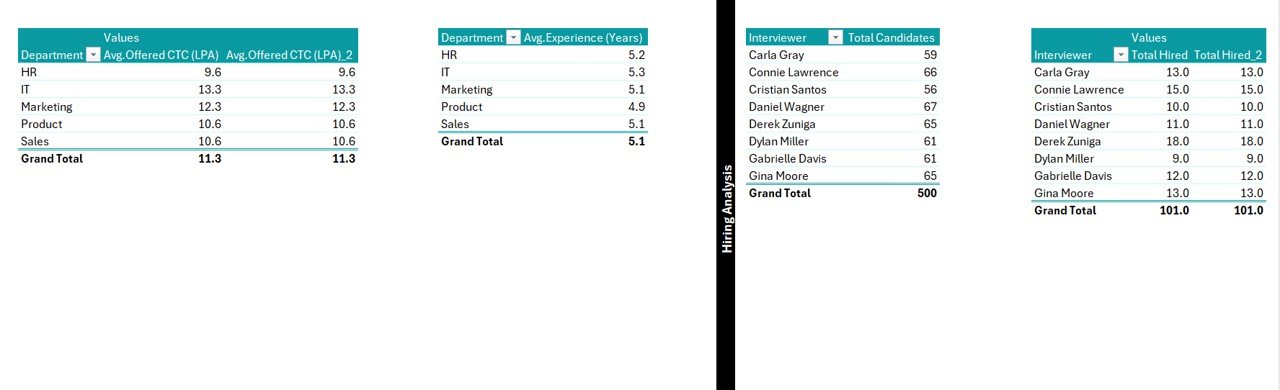
🧑⚖️ Hiring Analysis Page
Evaluate interviewers’ performance with:
-
Total Candidates Interviewed
-
Number of Hires by Interviewer
-
Hired % by Interviewer
Spot top recruiters and identify coaching needs.
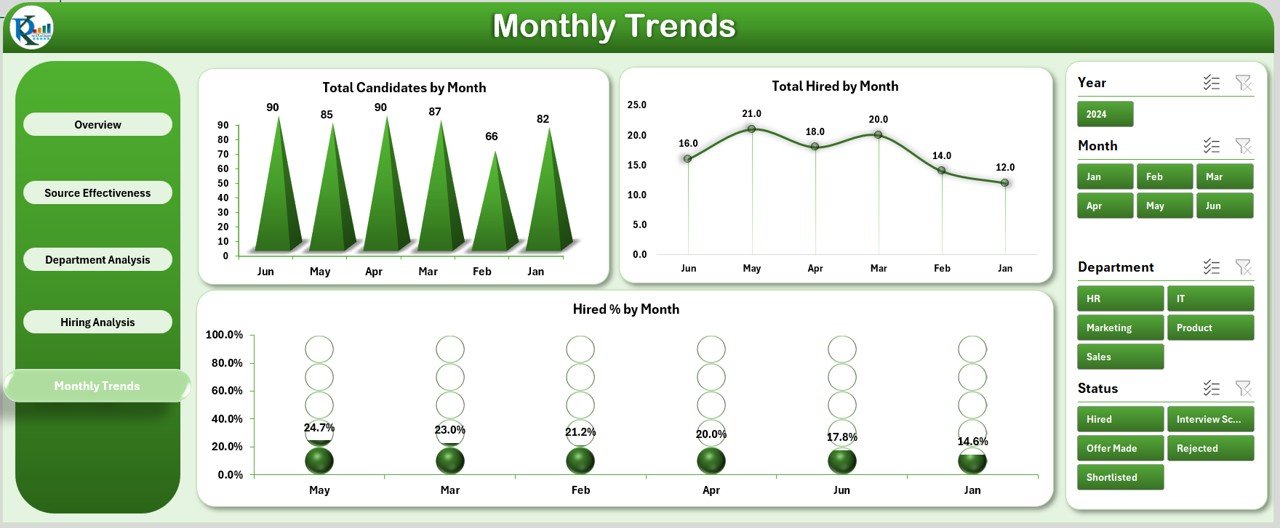
📆 Monthly Trends Page
Track recruitment over time:
-
Total Candidates per Month
-
Hires per Month
-
Hiring % by Month
Great for planning and identifying seasonal trends.
📂 What’s Inside the Excel Dashboard
Here’s what you get with the download:
✅ Excel-based dashboard with 5 detailed analysis pages
✅ Pre-built slicers, filters, and visuals
✅ Interactive KPIs, bar and line charts, and experience metrics
✅ Data import-ready structure for easy updating
✅ No coding or add-ins required—just Excel magic!
✅ Fully customizable for your hiring pipeline, stages, and metrics
🛠️ How to Use the Recruitment and Hiring Dashboard
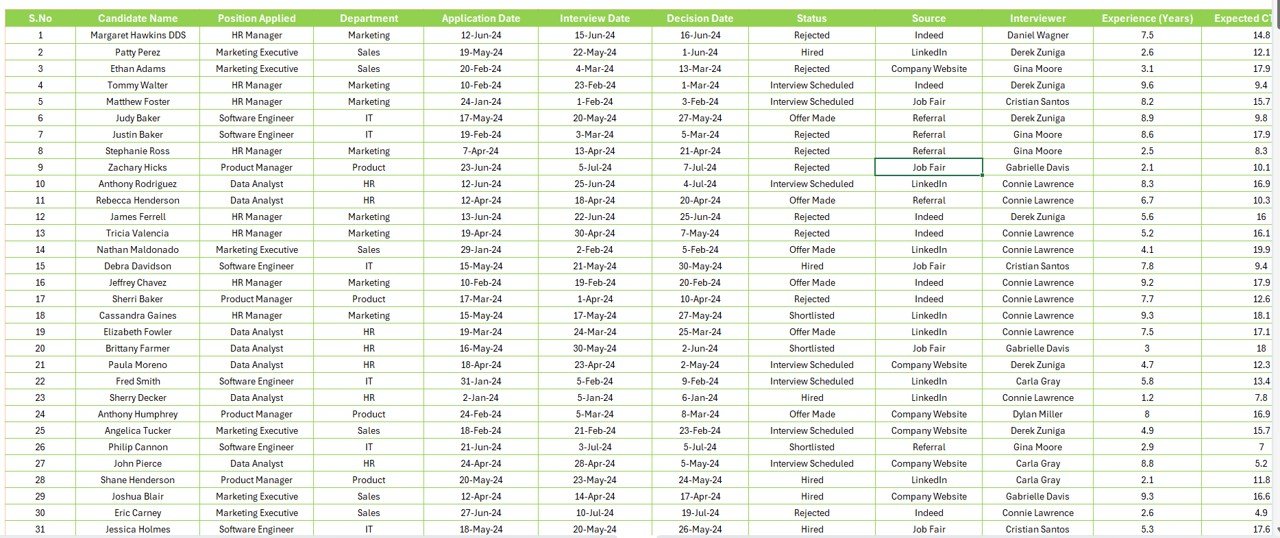
📁 Step 1: Input Candidate Data
Fill the data sheet with fields like name, role, experience, CTC, source, status, and interviewer.
📊 Step 2: Analyze with Slicers
Use slicers to filter by department, month, or source for focused insights.
📈 Step 3: Review KPIs and Trends
See real-time metrics on hiring success, source effectiveness, and monthly performance.
🎯 Step 4: Optimize Your Strategy
Use insights to shift hiring budget, improve recruiter training, or fine-tune sourcing strategies.
👥 Who Can Benefit from This Dashboard?
This Excel dashboard is ideal for:
👔 HR Managers – Get a 360° view of the hiring pipeline
🧑💻 Recruiters – Monitor source performance and candidate flow
🏢 Department Heads – Analyze hiring success and team growth
📊 Executives – Make data-driven staffing decisions
📈 Talent Acquisition Teams – Scale hiring effectively across locations
✅ Click here to read the Detailed blog post
🔗 Visit our YouTube channel to learn step-by-step video tutorials


Reviews
There are no reviews yet.