


In today’s highly competitive Real Estate Valuation Dashboard in Power BI market, relying on assumptions and gut feelings is no longer enough. Property values change rapidly, rental income fluctuates by location, and market trends evolve every month. Therefore, investors, developers, brokers, and property managers need a clear, data-driven valuation system to make confident decisions. That is precisely where the Real Estate Valuation Dashboard in Power BI becomes an essential solution.
This professionally designed Power BI dashboard converts scattered real estate data into interactive visuals, KPIs, and trend analysis. Instead of managing multiple spreadsheets, delayed reports, and manual calculations, you get a single, centralized dashboard that shows property valuation, rental performance, and market behavior instantly.
Built for real-world real estate operations, this dashboard helps stakeholders analyze portfolio health, identify growth opportunities, optimize rental income, and reduce investment risk—all with clarity and speed.
Key Features of Real Estate Valuation Dashboard in Power BI 🏢
📊 Executive Overview Page

Get a high-level snapshot of total valuation, total properties, properties under offer, and average rental income.
🎯 Interactive Slicers
Filter the entire dashboard by city, region, property type, segment, or month in seconds.
💰 Valuation & Rental Income Tracking
Monitor sale price valuation and monthly rental income across multiple dimensions.
🏘️ Property Type Analysis
Compare valuation, rental income, and property count by apartment, villa, commercial, or other property types.
📌 Segment-Level Insights
Analyze luxury, mid-range, and affordable segments to optimize investment allocation.
🌍 Region-Wise Performance Analysis
Understand which regions generate higher valuation, faster movement, and stronger rental demand.
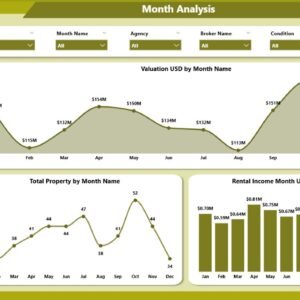
📈 Monthly Trend Analysis
Track valuation growth, property volume, and rental income trends over time.
🧭 Clean & Executive-Friendly Design
Professionally structured pages designed for quick decision-making and presentations.
What’s Inside the Real Estate Valuation Dashboard in Power BI 📂
📌 Overview Page
Includes KPI cards, interactive slicers, and visuals such as listed percentage, under-offer status by condition, rental income by city, and sale price by furnishing.
📌 Property Analysis Page
Displays valuation, property count, and rental income by property type.
📌 Segment Analysis Page
Provides valuation and rental insights across different market segments.
📌 Region Analysis Page
Shows region-wise valuation, properties under offer, and rental income distribution.
📌 Monthly Trends Page
Tracks valuation, total properties, and rental income trends month by month.
📌 Structured Data Model
Uses clean, standardized property data fields for fast and accurate Power BI analysis.
How to Use the Real Estate Valuation Dashboard in Power BI 🧭
1️⃣ Store property, valuation, and rental data in Excel or structured sources
2️⃣ Connect or refresh the data in Power BI
3️⃣ Use slicers to filter by city, region, segment, or time
4️⃣ Analyze valuation KPIs, rental income, and trends across pages
5️⃣ Use insights for investment planning, pricing strategy, and portfolio optimization
No advanced Power BI skills are required. If you can update data, you can use this dashboard confidently.
Who Can Benefit from This Real Estate Valuation Dashboard in Power BI 👥
✔ Real Estate Investors
✔ Property Developers
✔ Asset & Portfolio Managers
✔ Brokerage Firms
✔ Property Management Companies
✔ Financial & Market Analysts
✔ Real Estate Consultants
Any organization dealing with property valuation and rental income will gain immediate value from this dashboard.
Click here to read the Detailed Blog Post
🔗 Visit our YouTube channel to learn step-by-step video tutorials
Visit our YouTube channel to learn step-by-step video tutorials


Reviews
There are no reviews yet.