


In the fast-moving real-estate investment world, data clarity drives smarter investment decisions. The Real Estate Investment Trusts (REITs) Dashboard in Excel is a ready-to-use analytical solution that helps investors, fund managers, and analysts visualize performance, monitor risks, and manage property portfolios — all in one interactive Excel file.
Built entirely in Microsoft Excel, this dashboard transforms complex REIT datasets into clear, interactive visuals for better portfolio analysis and reporting. It enables you to track market value, ROI, occupancy, and risk level — giving investors full control over performance monitoring and decision-making.
Whether you manage commercial properties, residential developments, or diversified REIT funds, this dashboard provides the insights you need to identify trends, assess risks, and optimize returns. 💼🏙️
⚙️ Key Features of the REITs Dashboard in Excel
📊 5 Analytical Pages + 2 Support Sheets (Overview, REIT Name, Property Type, Region, Monthly Trends)
📅 Page Navigator: Quick side-panel navigation between analytical views.
🎯 KPI Cards & Summary Charts: View Active Investments, Risk Levels, and Market Value instantly.
🏢 Portfolio Breakdown: Analyze by REIT Name, Property Type, or Region.
📈 Trend Visualization: Monthly insights into performance and investment activity.
💡 Interactive Slicers & Filters: Filter by property type, month, or region.
🧾 Excel-Based Automation: Charts and KPIs update dynamically with refreshed data.
💻 Fully Editable Template: Customize metrics, visuals, and KPIs to fit your portfolio.
📊 What’s Inside the REITs Dashboard in Excel
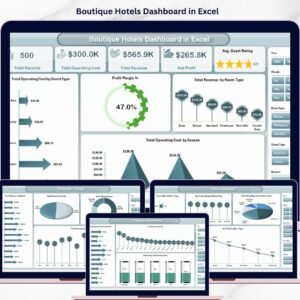
🏠 1️⃣ Overview Page – Portfolio Summary

The main control center of your REIT analytics.
-
Displays five KPI cards summarizing portfolio performance.
-
Charts show Active vs Inactive Investments, Market Value by Risk Level, and High-Risk Regions.
💡 Purpose: Provide a top-level snapshot of investment health and exposure.
💼 2️⃣ REIT Name Analysis Page – Fund-Wise Insights
Dive deeper into performance by REIT entity.
-
Compare Market Value, ROI (%), and Rental Income by REIT Name.
-
Track Active vs Pending Investments to identify progress bottlenecks.
💡 Purpose: Pinpoint top-performing trusts and underperforming ones.
🏢 3️⃣ Property Type Analysis Page – Asset Diversification
Evaluate how different property types contribute to revenue and risk.
-
View Market Value, Rental Income, and Net Income by Property Type.
-
Identify High-Risk Levels within categories like Office, Retail, or Residential.
💡 Purpose: Support smarter asset allocation for balanced portfolios.
🌍 4️⃣ Region Analysis Page – Geographic Distribution
Understand where your investments thrive.
-
Charts show Market Value, Net Income, and Rental Income by Region.
-
Track Acquired Investment Status across locations.
💡 Purpose: Analyze geographic strengths and make informed regional decisions.
📆 5️⃣ Monthly Trends Page – Performance Over Time
Monitor monthly investment activity and trends.
-
Visualize Market Value, Risk Level, and Rental Income Month by Month.
💡 Purpose: Identify growth patterns and predict future performance.
🧾 Support Sheets – Data & Configurations
-
Data Sheet: Enter and update raw data for REITs, ROI, and region.
-
Support Sheet: Contains slicer data, dropdown lists, and mapping tables.
💡 Purpose: Ensure all visuals update automatically upon refresh.
🌟 Advantages of Using the REITs Dashboard in Excel
✅ Comprehensive Portfolio View: Consolidate all REIT data in one file.
✅ Real-Time Insights: Instantly view updated investment metrics.
✅ Time-Saving Automation: Charts and pivots refresh automatically.
✅ Better Risk Management: Spot high-risk regions or sectors early.
✅ Professional Reports: Present investor-ready dashboards effortlessly.
✅ No Coding Required: 100 % Excel-based — simple, powerful, and cost-effective.
💡 How to Use the REITs Dashboard
1️⃣ Update the Data Sheet monthly with Market Value, ROI, and Income.
2️⃣ Refresh all PivotTables (Ctrl + Alt + F5).
3️⃣ Navigate pages using the left-panel Page Navigator.
4️⃣ Use slicers to filter by Month, Region, or Property Type.
5️⃣ Review KPI cards and visuals for actionable insights.
💡 Tip: Export charts as PDFs for investor presentations.
👥 Who Can Benefit from This Dashboard
🏢 Real Estate Fund Managers
💰 Investors & Portfolio Analysts
🏘️ Developers and Property Managers
📊 Financial Consultants
🏛️ Real Estate Research Firms
🧩 Conclusion
The Real Estate Investment Trusts (REITs) Dashboard in Excel brings together data visualization, automation, and analytics to transform how you manage and monitor real-estate investments.
By combining Excel’s power with intuitive design, this tool gives you a 360-degree view of your REIT portfolio — from returns to risks. It’s professional, customizable, and ideal for both small investors and institutional fund managers.
🏙️ Track. Analyze. Optimize. Your real-estate investments made smarter with NextGen Templates’ REITs Dashboard in Excel.


Reviews
There are no reviews yet.