


Rainfall patterns directly impact agriculture, water management, and urban planning. Tracking and analyzing rainfall data is essential for making informed environmental and operational decisions. The Rainfall Report Management Dashboard in Excel is a ready-to-use analytical tool that simplifies rainfall data tracking, visualization, and reporting — all within Microsoft Excel. 🌧️📊
Designed for meteorologists, researchers, and environmental agencies, this dashboard converts raw rainfall data into meaningful insights through dynamic charts, pivot tables, and slicers. It’s your complete weather intelligence solution for rainfall analysis and reporting.
☔ Key Features of the Rainfall Report Management Dashboard in Excel
📈 5 Analytical Pages:
Includes Overview, Rainfall Type, Season, State, and Month Analysis pages — each designed for deep, focused insights.
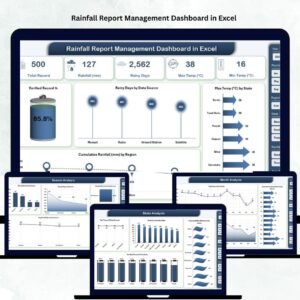
🏠 Overview Page:

Displays 5 KPI cards (Total Rainfall, Max Temp, Min Temp, Rain Days, Verified Record %) and 4 interactive charts — providing a complete snapshot of rainfall performance.
💧 Rainfall Type Analysis:
Categorizes rainfall as light, moderate, heavy, or storm rainfall — helping users analyze intensity, temperature correlation, and data verification rates.
🌤️ Seasonal Analysis:
View rainfall and temperature variations across seasons — summer, monsoon, winter, and post-monsoon.
🗺️ State-Wise Comparison:
Compare rainfall data by state or region to detect drought-prone or high-rainfall areas.
📆 Month Analysis:
Track monthly rainfall and detect unusual spikes or dry periods.
🧾 Verified Record % Metric:
Ensures data accuracy by highlighting verified vs. unverified records.
🎨 Interactive Filters & Navigation:
Use slicers to filter by state, region, month, or season with just one click.
💻 No Add-Ins Required:
Runs entirely in Excel — no macros, plugins, or extra software needed.
📦 What’s Inside the Rainfall Report Management Dashboard
When you download this Excel file, you’ll receive:
✅ Overview Page: A quick visual summary of rainfall KPIs.
✅ Rainfall Analysis Page: Insights by rainfall type and temperature range.
✅ Season Analysis Page: Seasonal trends and fluctuations.
✅ State Analysis Page: Geographic rainfall comparisons.
✅ Month Analysis Page: Month-over-month performance.
✅ Data Sheet: A well-structured data foundation that automatically feeds all visuals.
All charts and KPI cards are connected to this master data sheet, ensuring accuracy and consistency. Every time you update the dataset, visuals refresh instantly.
🧭 How to Use the Rainfall Report Management Dashboard in Excel
🪄 Step 1: Open the Excel dashboard file.
🪄 Step 2: Paste or import your rainfall dataset into the Data Sheet.
🪄 Step 3: Click Refresh All to update visuals and KPIs.
🪄 Step 4: Use filters to view results by region, season, or month.
🪄 Step 5: Analyze rainfall trends, temperature impact, and data verification.
No technical expertise is required — everything works automatically using Excel’s built-in features.
👥 Who Can Benefit from This Dashboard
🌾 Agricultural Organizations: Track rainfall patterns to improve irrigation planning.
🏛️ Government Agencies: Analyze state and seasonal rainfall performance.
🌎 Environmental Consultants: Evaluate rainfall impact on ecosystems and water systems.
📚 Researchers & Academics: Study rainfall data correlations and trends.
🏙️ Urban Planners: Use rainfall insights for drainage and disaster management strategies.
Whether for professional use or research, this Excel dashboard offers accurate, visually appealing, and actionable insights.
🌟 Why Choose This Excel Dashboard
✔️ Real-time rainfall insights with dynamic visuals.
✔️ Complete rainfall reporting in one file.
✔️ No macros or coding — easy for anyone to use.
✔️ Interactive slicers for state, month, and season filters.
✔️ Verified data tracking with accuracy checks.
✔️ Ready for presentations and official reports.
✔️ Cost-effective — runs entirely in Excel.
The Rainfall Report Management Dashboard in Excel transforms complex rainfall data into smart decisions. It’s fast, flexible, and beautifully designed for real-world analysis. 🌦️📈
### Click here to read the Detailed blog post
Visit our YouTube channel to learn step-by-step video tutorials


Reviews
There are no reviews yet.