Railway operations are complex, large-scale, and highly sensitive to delays, safety risks, and efficiency gaps. From train punctuality and asset utilization to safety compliance and passenger service quality, railway organizations must monitor dozens of KPIs every day. However, when performance data remains scattered across reports and manual spreadsheets, decision-making becomes slow and reactive.
That is exactly why the Railway KPI Dashboard in Google Sheets becomes a powerful and practical performance management solution.
This ready-to-use dashboard transforms railway operational data into a structured, visual, and decision-ready reporting system. It enables railway authorities, operations managers, infrastructure planners, and leadership teams to track critical KPIs related to punctuality, safety, utilization, and efficiency—all from a single, interactive Google Sheets dashboard.
Because the dashboard is built entirely in Google Sheets, it provides cloud-based access, real-time collaboration, automatic KPI calculations, and zero dependency on expensive BI or railway-specific software.
🚆 Key Features of the Railway KPI Dashboard in Google Sheets
📊 1. Centralized Railway KPI Monitoring
Track all essential railway KPIs in one place instead of managing multiple operational reports.
⏱️ 2. MTD & YTD Performance Tracking
Monitor Month-to-Date and Year-to-Date KPIs to balance daily operations with long-term strategy.
🎯 3. Target vs Actual & Prior-Year Comparison
Instantly compare current performance with targets and previous-year benchmarks.
📈 4. Visual Performance Indicators
Conditional formatting with up/down arrows highlights improvement or decline instantly.
🤝 5. Google Sheets-Based Collaboration
Operations, safety, and planning teams collaborate in real time with controlled access.
📦 What’s Inside the Railway KPI Dashboard in Google Sheets
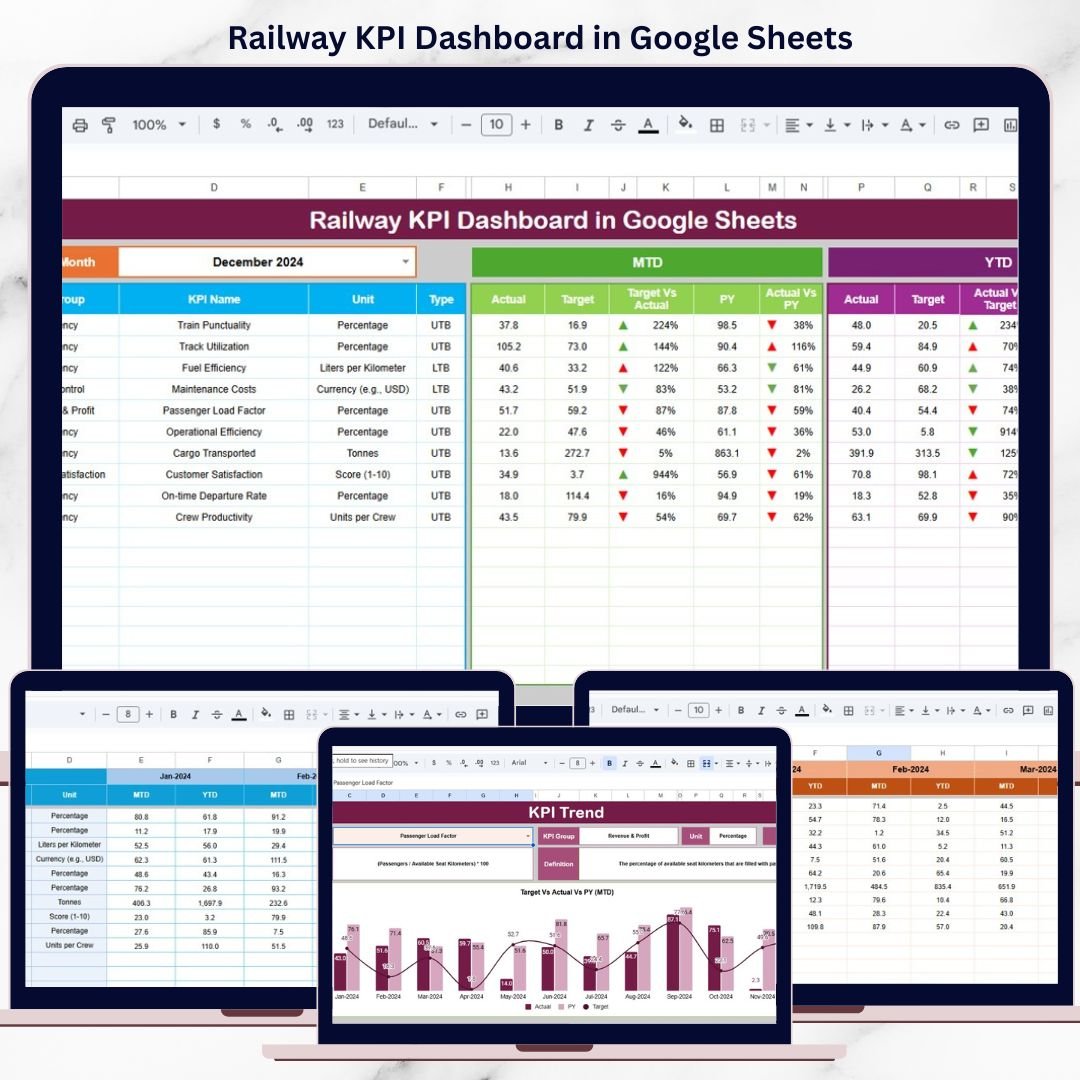
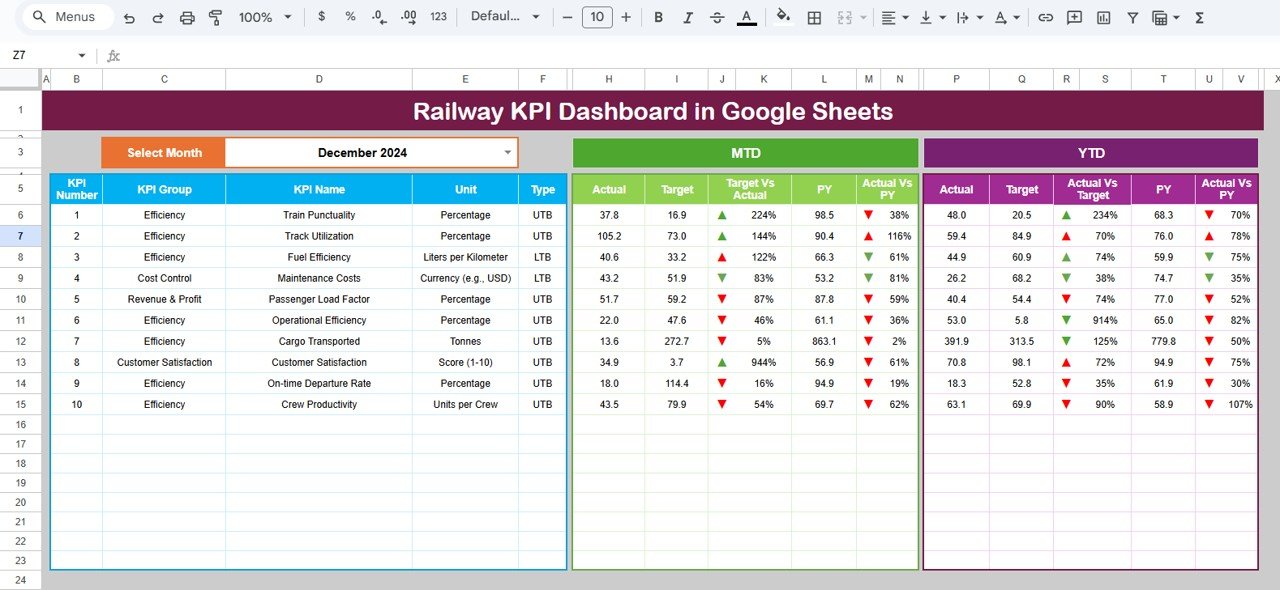
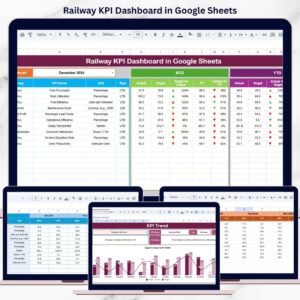
🖥️ Dashboard Sheet Tab – KPI Performance Overview
This is the main dashboard view where all railway KPIs appear at a glance.
📌 Month Selection
-
Month dropdown available in cell D3
-
Selecting a month updates all KPI values automatically
📌 KPI Metrics Displayed
-
MTD Actual
-
MTD Target
-
MTD Previous Year
-
Target vs Actual variance
-
Previous Year vs Actual variance
All variances use conditional formatting arrows for quick interpretation.
📌 YTD Performance
-
YTD Actual
-
YTD Target
-
YTD Previous Year
-
Trend indicators for long-term visibility
This structure supports both operational control and strategic review.
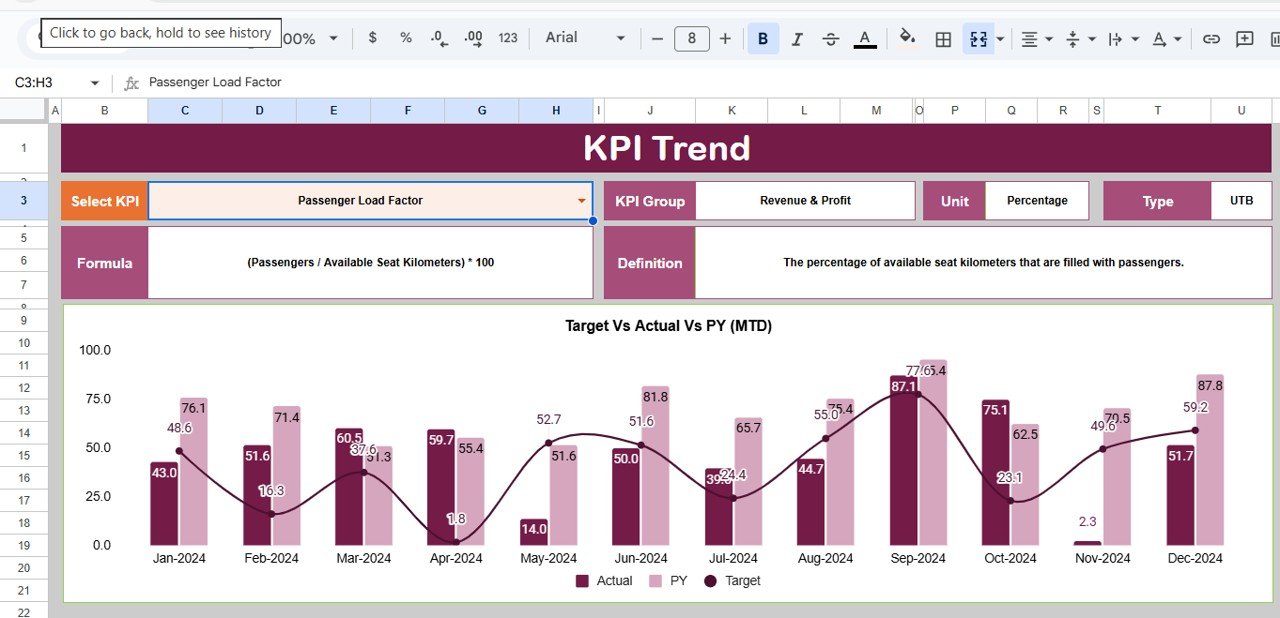
📊 KPI Trend Sheet Tab
This sheet explains and contextualizes each KPI.
🔍 KPI Selection
-
Select a KPI from the dropdown in cell C3
📘 KPI Details Displayed
-
KPI Group
-
Unit of Measurement
-
KPI Type (Lower the Better / Upper the Better)
-
KPI Formula
-
KPI Definition
This ensures KPI transparency and consistent understanding across teams.
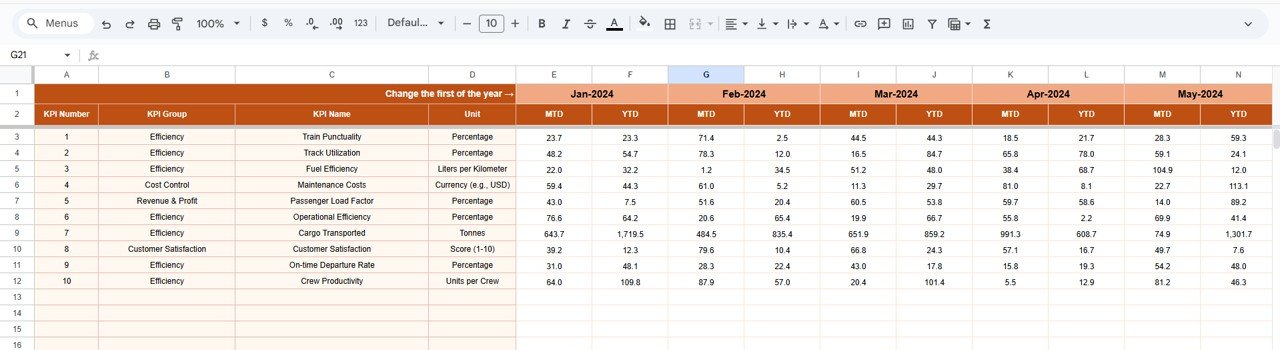
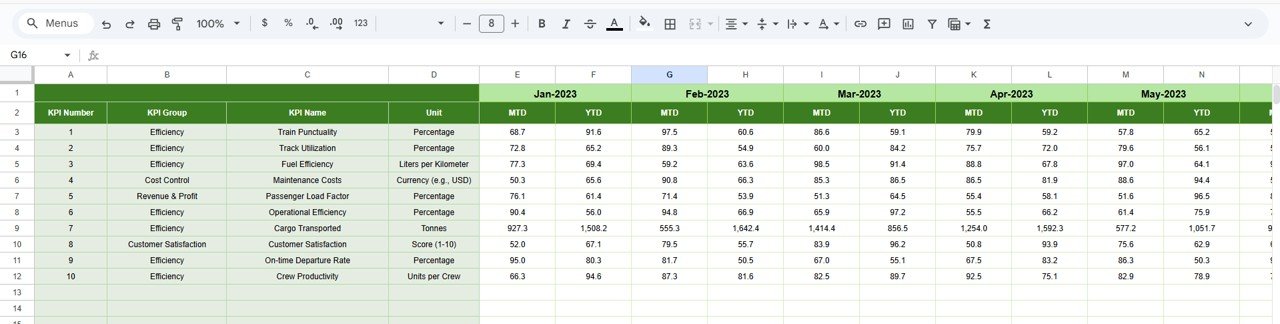
📋 Actual Number Sheet Tab
This sheet captures actual railway performance data.
-
Enter MTD and YTD actual values
-
Change the reporting month using cell E1
-
Enter the first month of the year to align YTD calculations
All dashboards and visuals update automatically.
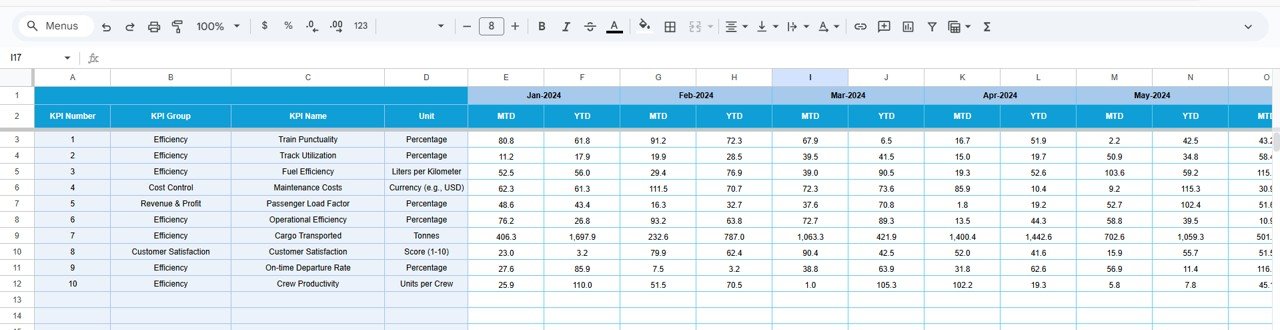
🎯 Target Sheet Tab
This sheet stores planned KPI targets.
-
Monthly MTD targets
-
Cumulative YTD targets
It enables structured performance benchmarking.
📆 Previous Year Number Sheet Tab
This sheet supports historical comparison.
-
Enter last year’s MTD and YTD KPI values
-
Enable year-over-year railway performance analysis
This is especially useful for seasonal travel and capacity trends.
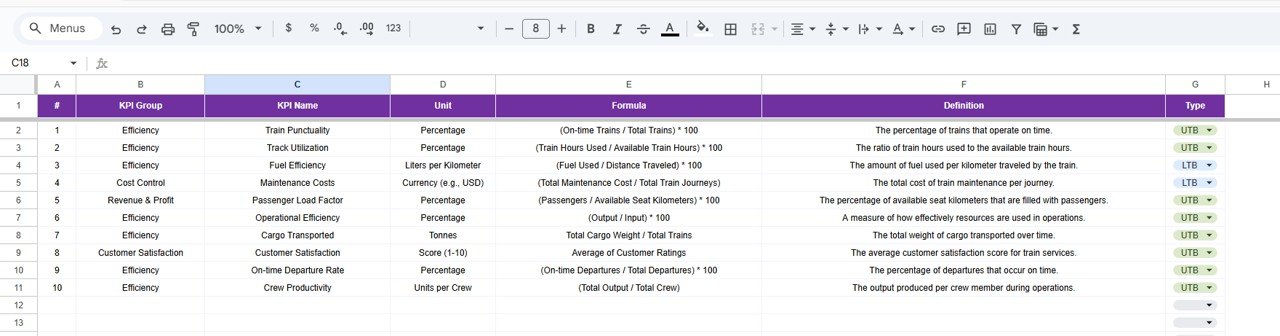
📘 KPI Definition Sheet Tab
The KPI master reference ensures governance and consistency.
-
KPI Name
-
KPI Group
-
Unit
-
Formula
-
KPI Definition
-
KPI Type (LTB / UTB)
🎯 Who Can Benefit from This Railway KPI Dashboard
🚆 Railway Operations Teams
Monitor punctuality, delays, and capacity utilization.
🏢 Infrastructure & Planning Teams
Analyze trends and plan network improvements.
🛡️ Safety & Compliance Teams
Track safety-related KPIs proactively.
📊 Transport Analysts
Identify performance gaps and improvement opportunities.
👔 Senior Management
Review operational performance at a glance.
### Click here to read the Detailed blog post
Watch the step-by-step video tutorial:


Reviews
There are no reviews yet.