
Managing radio shows and podcasts becomes challenging when your data is scattered across multiple files. Listener statistics, episode ratings, advertisement performance, monthly downloads, and engagement numbers often remain unorganized—making it difficult to identify what’s working and what needs improvement. That is exactly where the Radio & Podcasts KPI Dashboard in Excel becomes your most powerful performance-tracking tool.
This ready-to-use Excel dashboard brings all your audio analytics into one clean, interactive, and fully automated monitoring system. Whether you run a radio station, manage multiple podcast shows, or publish content across platforms like Spotify, Apple Podcasts, and YouTube, this dashboard gives you complete visibility of your KPIs in a single click.
Below is everything you’ll get inside this professionally designed Excel dashboard.
🎯 Key Features of the Radio & Podcasts KPI Dashboard in Excel
The dashboard is designed to give creators, managers, and marketing teams the insights they need—instantly and visually.
📌 1. Smart Summary Page
-
Navigate across all sheets with 6 ready-made buttons
-
Instantly jump to Dashboard, Trend Analysis, Input Sheets & KPI Definition
-
Designed to save time and improve user experience
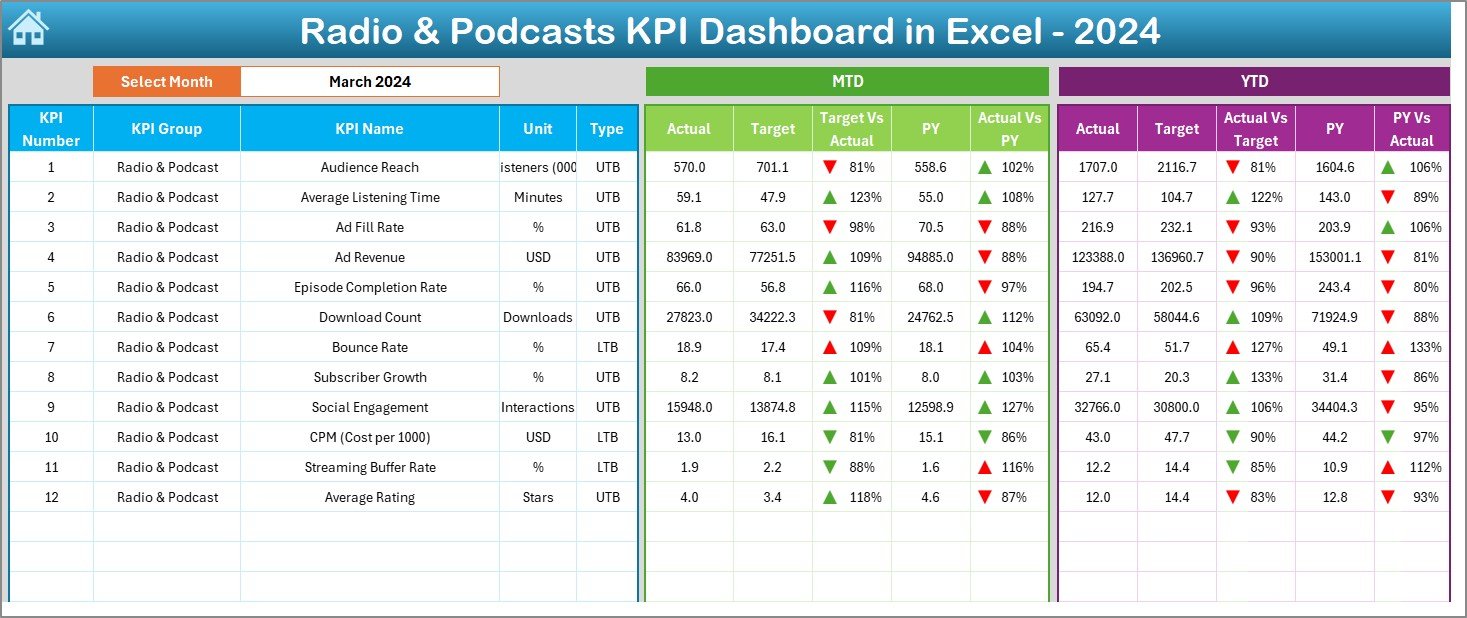
📌 2. Interactive Monthly KPI Dashboard
-
Select any month using the slicer in cell D3
-
Dashboard refreshes automatically
-
Compare MTD, YTD, Target, and Previous Year in one place
-
Up/down arrows help you understand improvement or decline in seconds
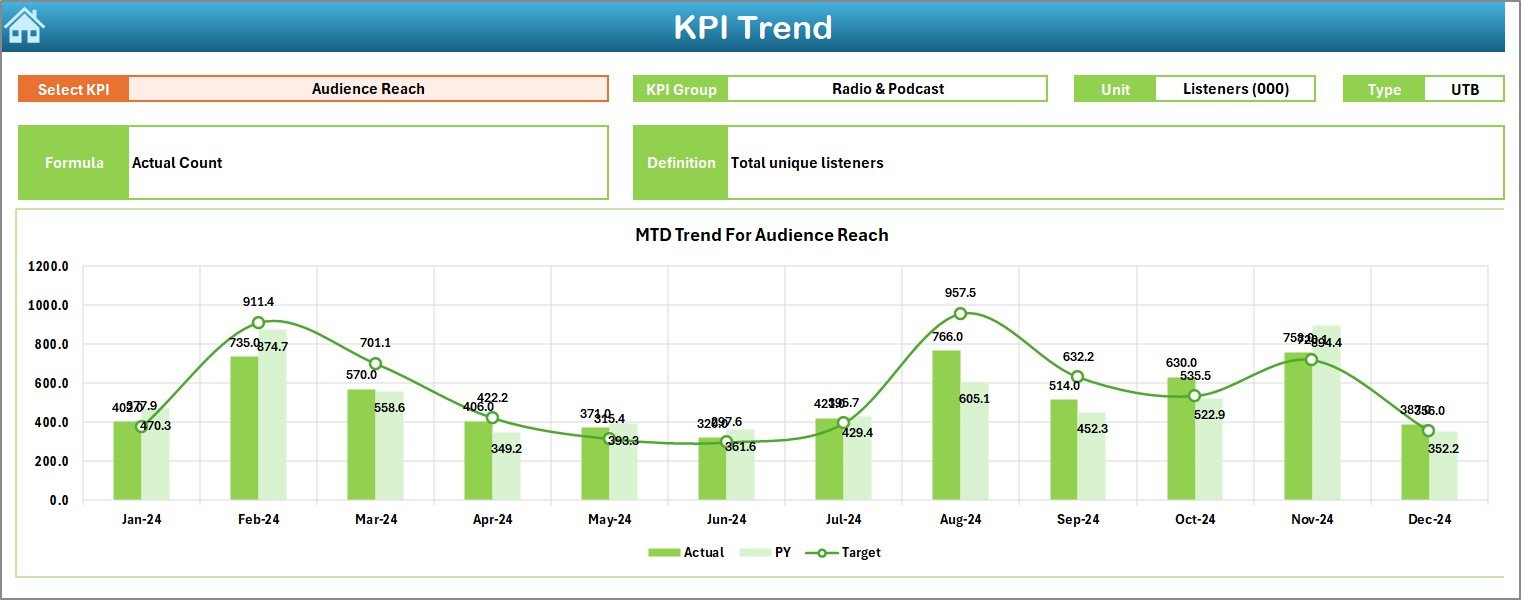
📌 3. Trend Analysis Page
-
Choose any KPI from the dropdown list
-
View KPI Group, Unit, Type (UTB/LTB), Formula & Definition
-
Two trend charts for MTD & YTD performance
-
Understand long-term movement of each KPI
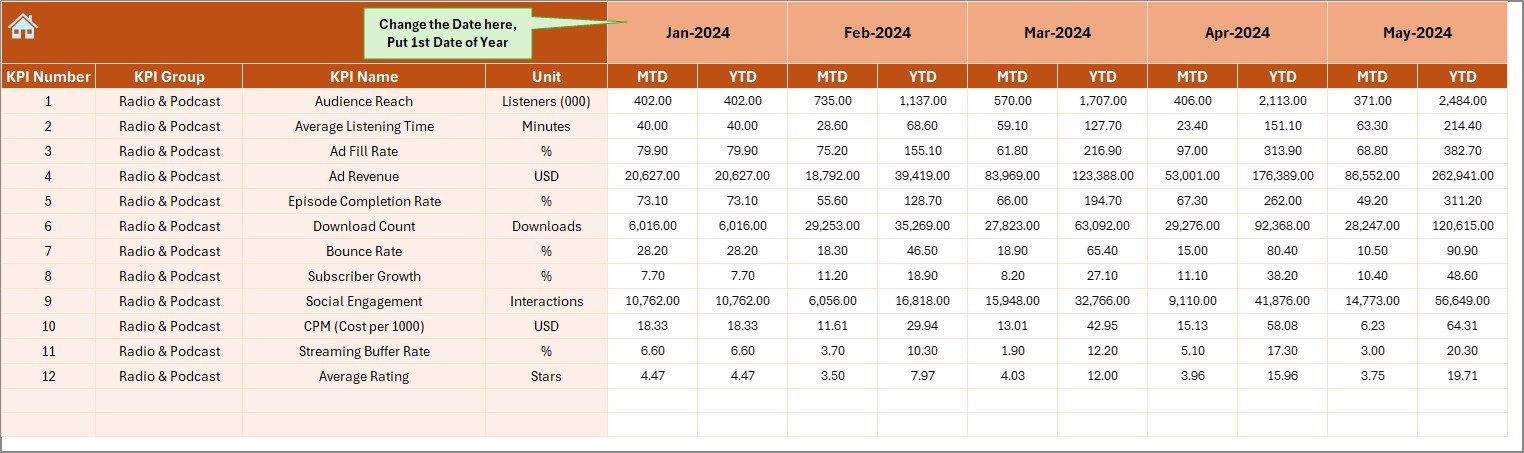
📌 4. Input Sheets for Actuals, Targets & Previous Year
-
Monthly Actuals entry
-
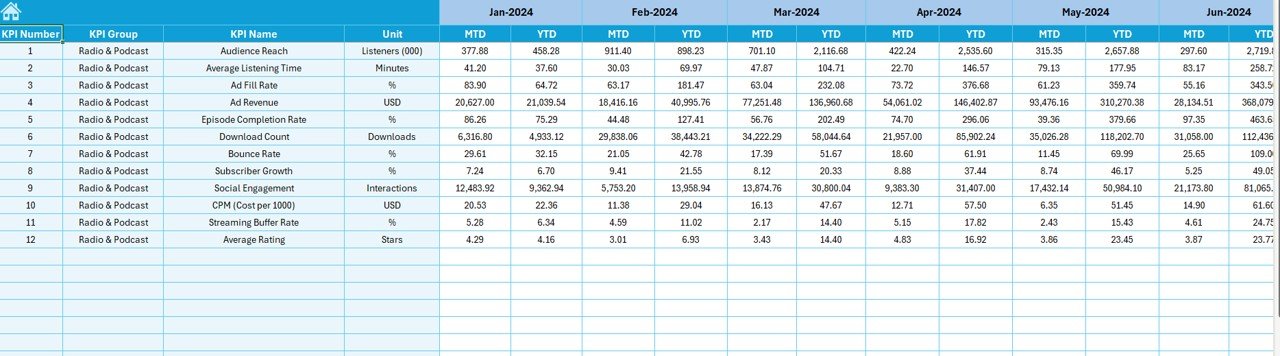
Target input sheet for MTD & YTD budgeting
-
Previous Year sheet for trend comparison
-
Flexible month start option
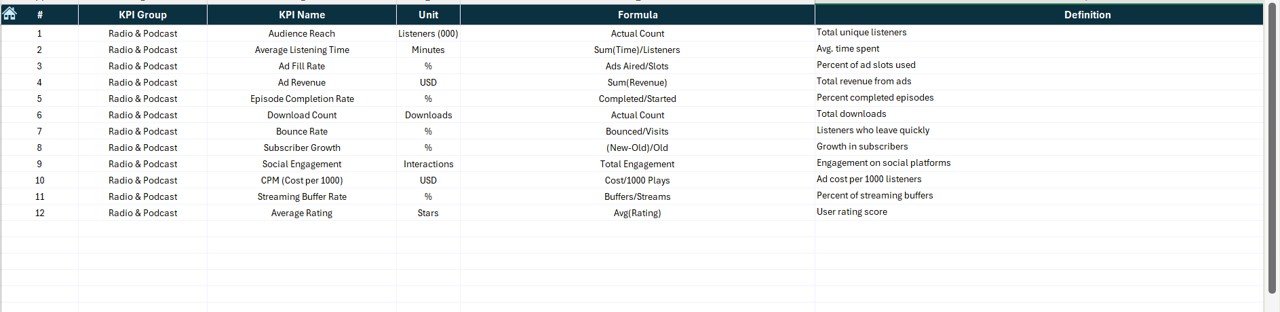
📌 5. Complete KPI Dictionary
-
Includes KPI Number, Group, Name, Unit, Formula, Definition & Type
-
Ensures every team member understands all KPIs clearly
With all these features, tracking audio performance becomes structured, visual, and effortless.
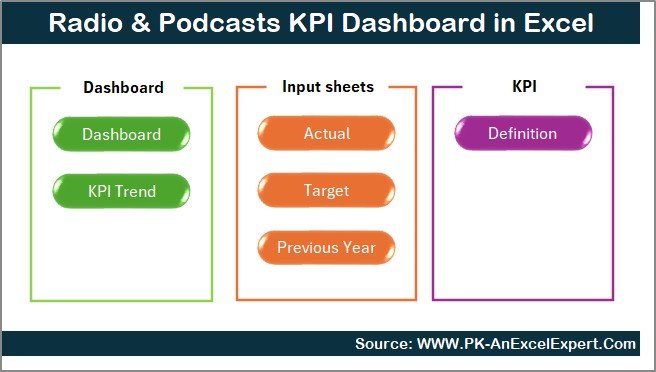
📂 What’s Inside the Radio & Podcasts KPI Dashboard in Excel
Here’s exactly what you get inside the downloadable Excel file:
📁 1. Summary Page
Your navigation hub with 6 clickable buttons.
📁 2. Dashboard Sheet
A clean, professional display of all KPIs—MTD & YTD.
📁 3. Trend Sheet
KPI-wise monthly performance with dual charts.
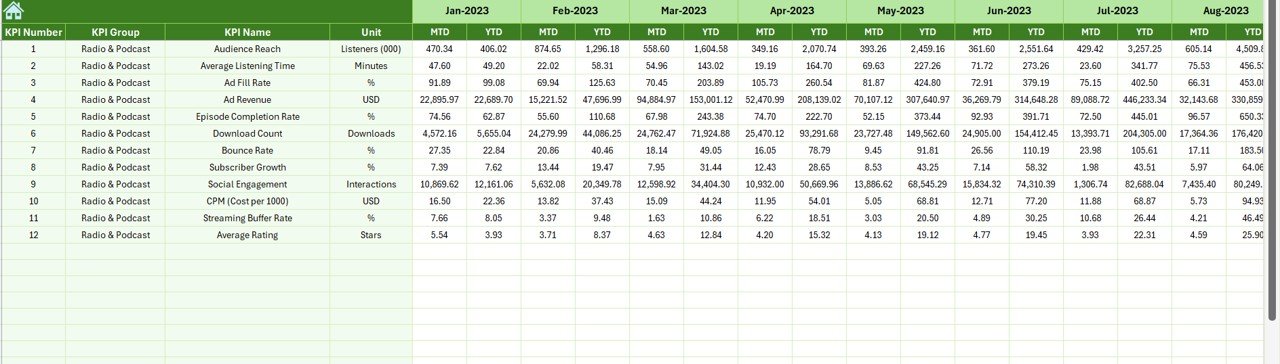
📁 4. Actual Numbers Input
Enter your monthly Actual MTD & YTD data.
📁 5. Target Sheet
Input MTD & YTD targets easily.
📁 6. Previous Year Sheet
Store last year’s monthly values for comparison.
📁 7. KPI Definition Sheet
Full dictionary explaining every KPI used in the dashboard.
Everything is automated using Excel formulas and pivot tables—no coding or advanced skills required.
🛠️ How to Use the Radio & Podcasts KPI Dashboard in Excel
Using the dashboard is extremely simple:
➡️ Step 1: Enter Actual Numbers
Fill MTD & YTD values in the Actual Input Sheet.
➡️ Step 2: Set Monthly & Yearly Targets
Enter your targets in the Target Sheet.
➡️ Step 3: Add Previous Year Data
This helps display accurate trend comparison.
➡️ Step 4: Select Any Month from the Slicer
The dashboard updates automatically.
➡️ Step 5: Review MTD, YTD & Trend Charts
Understand improvement or decline instantly.
➡️ Step 6: Use KPI Dictionary When Needed
Helps all teams stay aligned on definitions.
Within minutes, you can have a full performance report ready for meetings, presentations, or planning discussions.
👥 Who Can Benefit from This Radio & Podcasts KPI Dashboard?
This dashboard is designed for anyone working in the audio content industry:
🎙️ Radio Stations
Track show ratings, monthly listeners & ad revenue.
🎧 Podcasters
Analyze episode performance, listener retention & engagement.
📢 Marketing Teams
Understand audience growth and campaign impact.
💼 Content Managers
Review KPIs, compare with targets, and improve strategy.
📊 Media Companies
Manage multiple shows and platforms with one centralized file.
💰 Sales & Sponsorship Teams
Track monetization, ad sales & sponsorship revenue trends.
Whether you run a single podcast or an entire broadcast network, this dashboard gives you the insights you need to grow.
### Click here to read the Detailed blog post
Watch the step-by-step video tutorial:


Reviews
There are no reviews yet.