


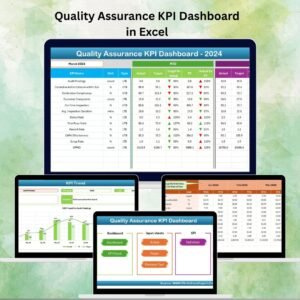
Every business knows that delivering quality products and services is the ultimate way to win customer trust and satisfaction. But how do you measure quality effectively? The answer lies in the Quality Assurance KPI Dashboard in Excel – a ready-to-use, highly customizable tool designed to simplify quality tracking, improve performance, and empower data-driven decision-making.
This dashboard centralizes all your critical KPIs in one place, so you no longer need scattered reports or endless spreadsheets. Built with Excel’s powerful formulas, charts, and pivot tables, it provides clear insights into monthly and yearly performance, target achievement, and trends. Whether you’re a startup or an enterprise, this tool helps you drive continuous improvement and maintain top-class quality standards.
✨ Key Features of Quality Assurance KPI Dashboard
✅ Centralized Dashboard View – Track all your KPIs in one place with an easy-to-navigate interface.
✅ Interactive Drop-Down Filters – Select months and see instant updates across the dashboard.
✅ Performance Comparison – View MTD (Month-to-Date) and YTD (Year-to-Date) values against Target and Previous Year numbers.
✅ Visual Indicators – Conditional formatting arrows make it easy to spot performance improvements or declines.
✅ Trend Analysis – Charts help you identify whether performance is improving or declining over time.
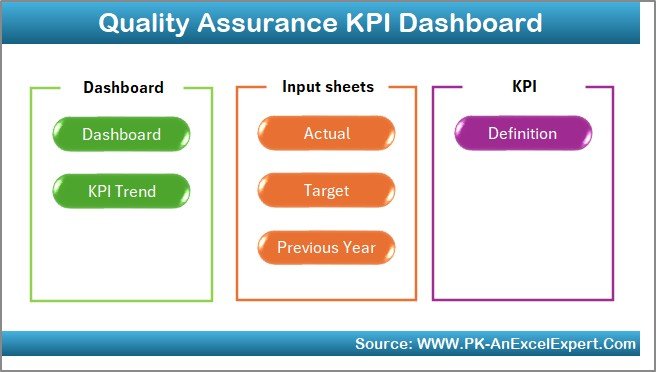
✅ Data Separation – Input sheets for Actuals, Targets, and Previous Year data for better organization.
✅ KPI Definition Sheet – Clear definitions, formulas, and units to ensure consistency across the organization.
✅ Professional Layout – Navigation buttons, automated formulas, and an intuitive design.
📂 What’s Inside the Quality Assurance KPI Dashboard
This Excel template comes with 7 structured worksheets:
-
Home Sheet – Your index page with navigation buttons to jump directly to other sheets.
-
Dashboard Sheet – The main screen showing KPIs, comparisons, and real-time results.
-
KPI Trend Sheet – Select any KPI from a dropdown and explore its detailed trends.
-
Actual Numbers Sheet – Input MTD and YTD values for each KPI.
-
Target Sheet – Define your monthly and yearly goals.
-
Previous Year Sheet – Store last year’s data for benchmarking.
-
KPI Definition Sheet – Keep all formulas, definitions, and KPI details documented.
Each sheet is designed to make your quality assurance reporting smooth, fast, and reliable.
⚙️ How to Use the Quality Assurance KPI Dashboard
-
Step 1: Enter Data – Input your actual numbers in the “Actuals” sheet.
-
Step 2: Define Targets – Add monthly goals in the “Target” sheet.
-
Step 3: Add Benchmarks – Fill in previous year’s data for comparison.
-
Step 4: Monitor Trends – Use the “Dashboard” and “Trend” sheets to track performance.
-
Step 5: Analyze & Act – Identify gaps, take corrective actions, and track improvement.
No advanced Excel knowledge is required – the template is beginner-friendly and designed for professionals at all levels.
👥 Who Can Benefit from This Dashboard?
💼 Business Managers – Monitor service quality, align teams, and make informed decisions.
🏭 Manufacturers – Track defect rates, rework time, and delivery performance.
🏥 Healthcare Providers – Improve patient safety, compliance, and treatment standards.
🎓 Educational Institutions – Measure teaching quality and student satisfaction.
💻 Software Teams – Monitor bug resolution rates, testing efficiency, and release quality.
🛒 Retailers – Track product returns, complaints, and service quality metrics.
No matter your industry, this dashboard adapts to your needs and ensures you always stay on top of your quality performance.
📌 Why Choose This Dashboard?
✔ Saves time with automated reporting.
✔ Provides transparency for stakeholders.
✔ Encourages accountability across departments.
✔ Customizable to your specific KPIs.
✔ Affordable and easy to implement.
Investing in this tool means less guesswork, more accuracy, and continuous improvement in your quality processes.


Reviews
There are no reviews yet.