Public health programs operate under constant pressure to deliver measurable outcomes, meet targets, and justify funding. Public Health Programs KPI Dashboard in Power BI Whether it is immunization coverage, service delivery, outreach programs, or health interventions, poor performance tracking can delay actions and reduce impact. Unfortunately, relying on scattered Excel files or static reports often makes it difficult to identify gaps on time.
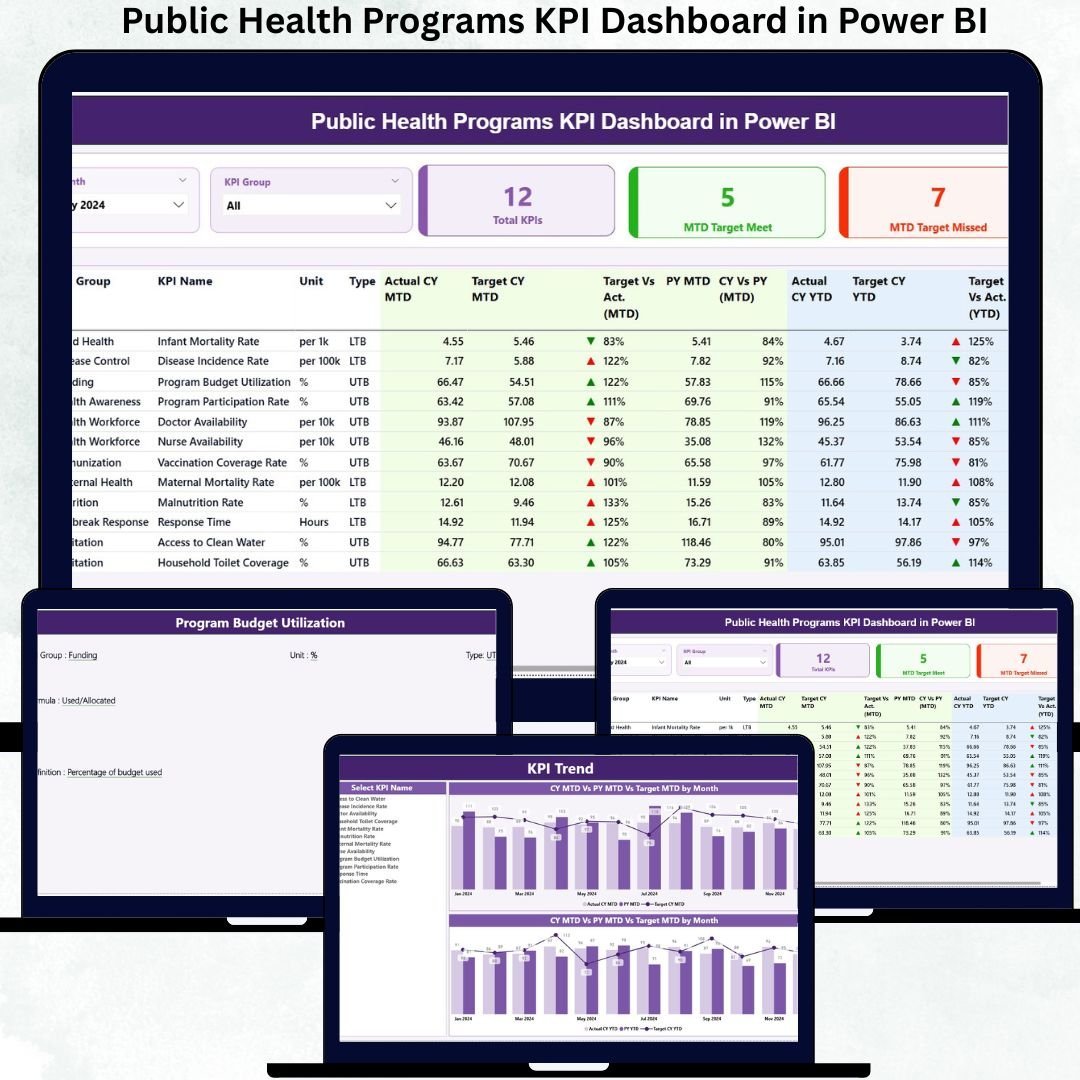
The Public Health Programs KPI Dashboard in Power BI solves this challenge by converting complex public health data into clear, interactive, and decision-ready insights. Public Health Programs KPI Dashboard in Power BI This ready-to-use dashboard helps public health leaders, NGOs, and government agencies track program performance, target achievement, trends, and year-over-year comparisons from one centralized analytics platform.
Public Health Programs KPI Dashboard in Power BI Built with Excel as the data input source and Power BI as the visualization layer, this dashboard combines familiarity with analytical power. As a result, organizations shift from reactive reporting to proactive, evidence-based public health management.
🚀 Key Features of the Public Health Programs KPI Dashboard in Power BI
🏥 Centralized KPI Monitoring – Track all public health KPIs on one screen
📊 MTD & YTD Performance Tracking – Monitor short-term and long-term program progress
🎯 Target vs Actual Comparison – Instantly identify performance gaps
📉 Previous Year Benchmarking – Measure real improvement over time
✅ Visual Status Indicators – Green ▲ and Red ▼ icons for instant clarity
📈 KPI Trend Analysis – Identify patterns, delays, and risk signals early
🎛️ Interactive Slicers & Drill-Through – Analyze KPIs without clutter
⚡ Excel + Power BI Model – Simple updates with powerful analytics
📦 What’s Inside the Public Health Programs KPI Dashboard
This dashboard includes three professionally designed and purpose-driven pages, each supporting a different level of performance analysis:
🟢 Summary Page
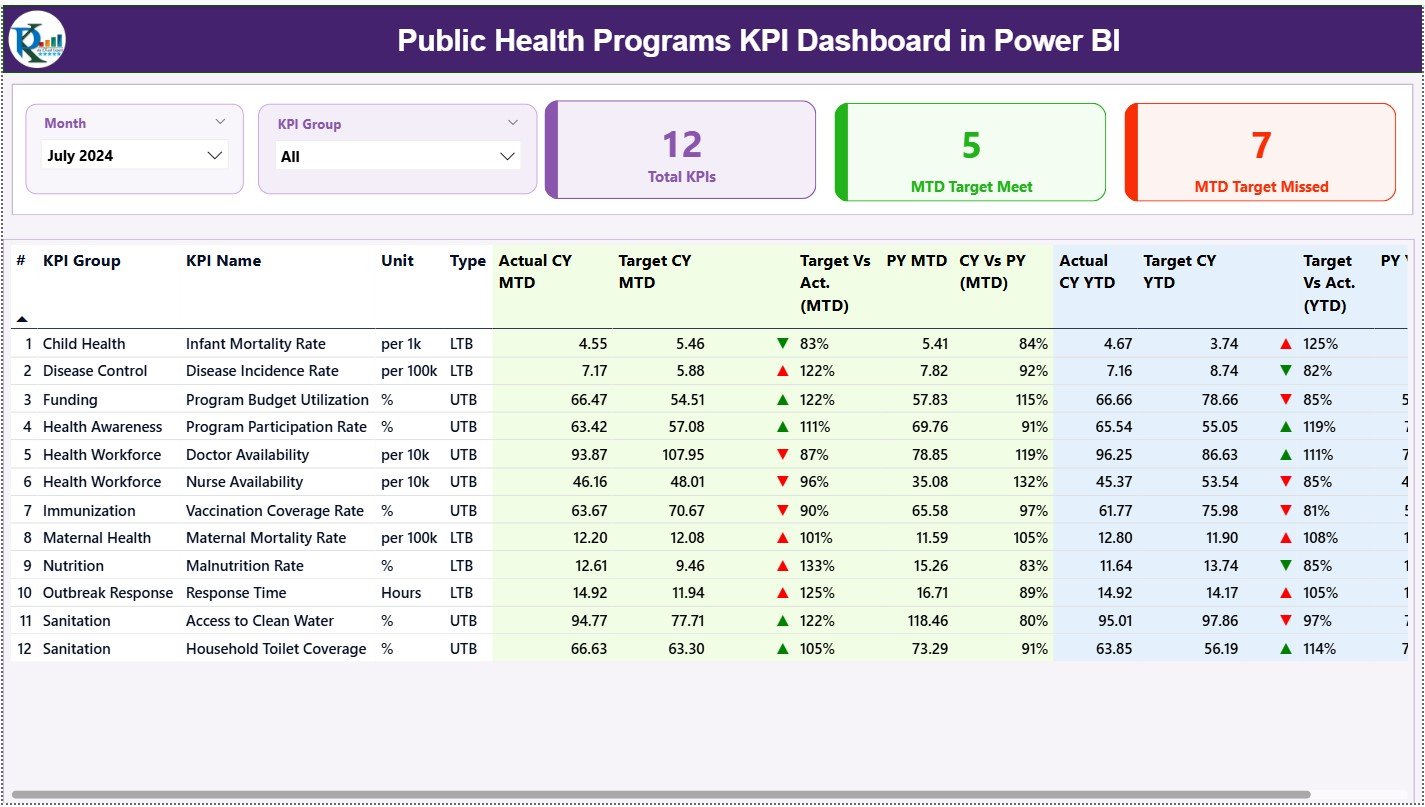
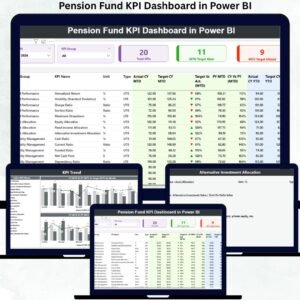
Acts as the control center of the dashboard. It displays KPI cards for Total KPIs, MTD Target Met, and MTD Target Missed, along with a detailed KPI table showing Actuals, Targets, Previous Year values, MTD & YTD ratios, and performance icons. Leaders can instantly see which programs are on track and which require intervention.
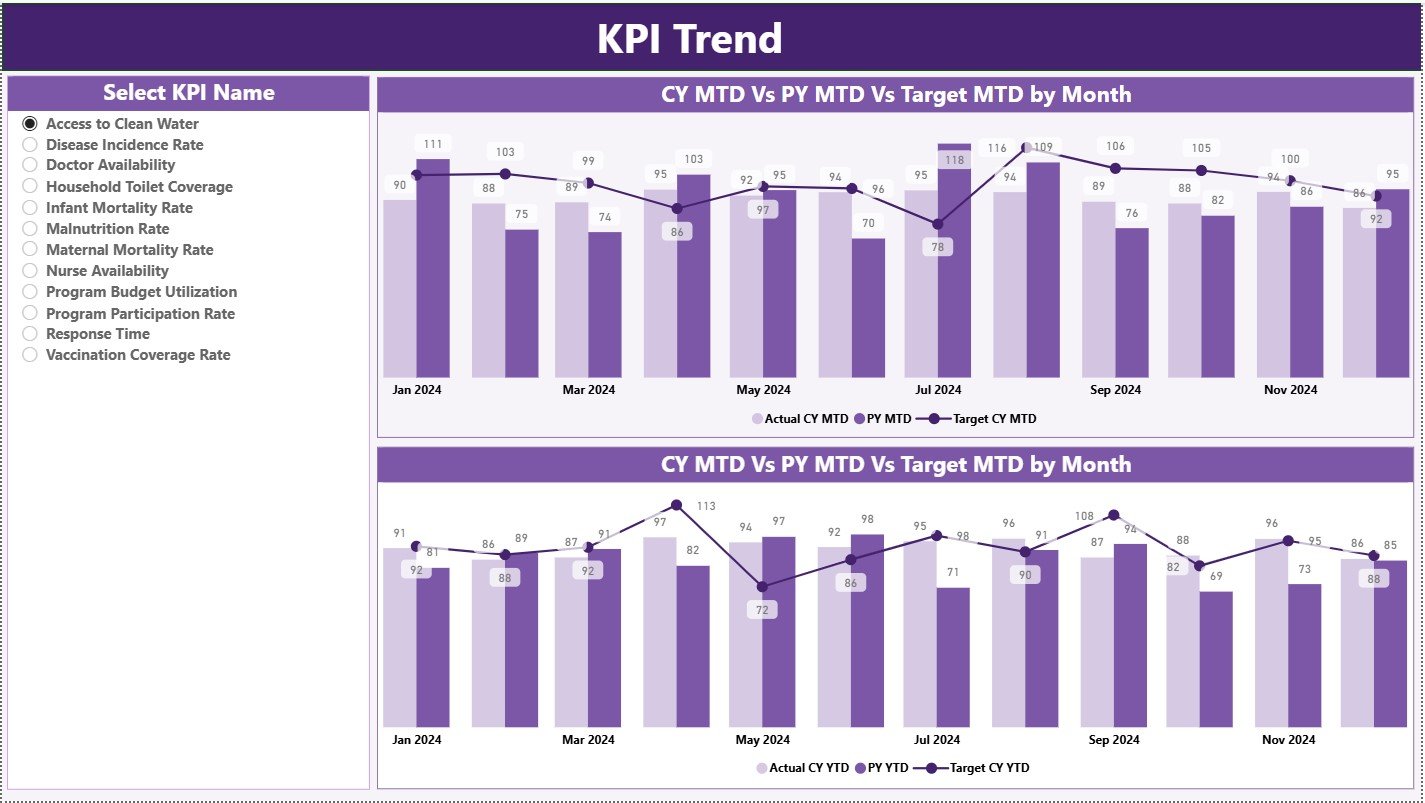
📉 KPI Trend Page
Designed for time-based analysis. Users select a KPI and view MTD and YTD combo charts comparing Current Year, Previous Year, and Target values. This page helps identify improving, declining, or stagnant public health indicators.
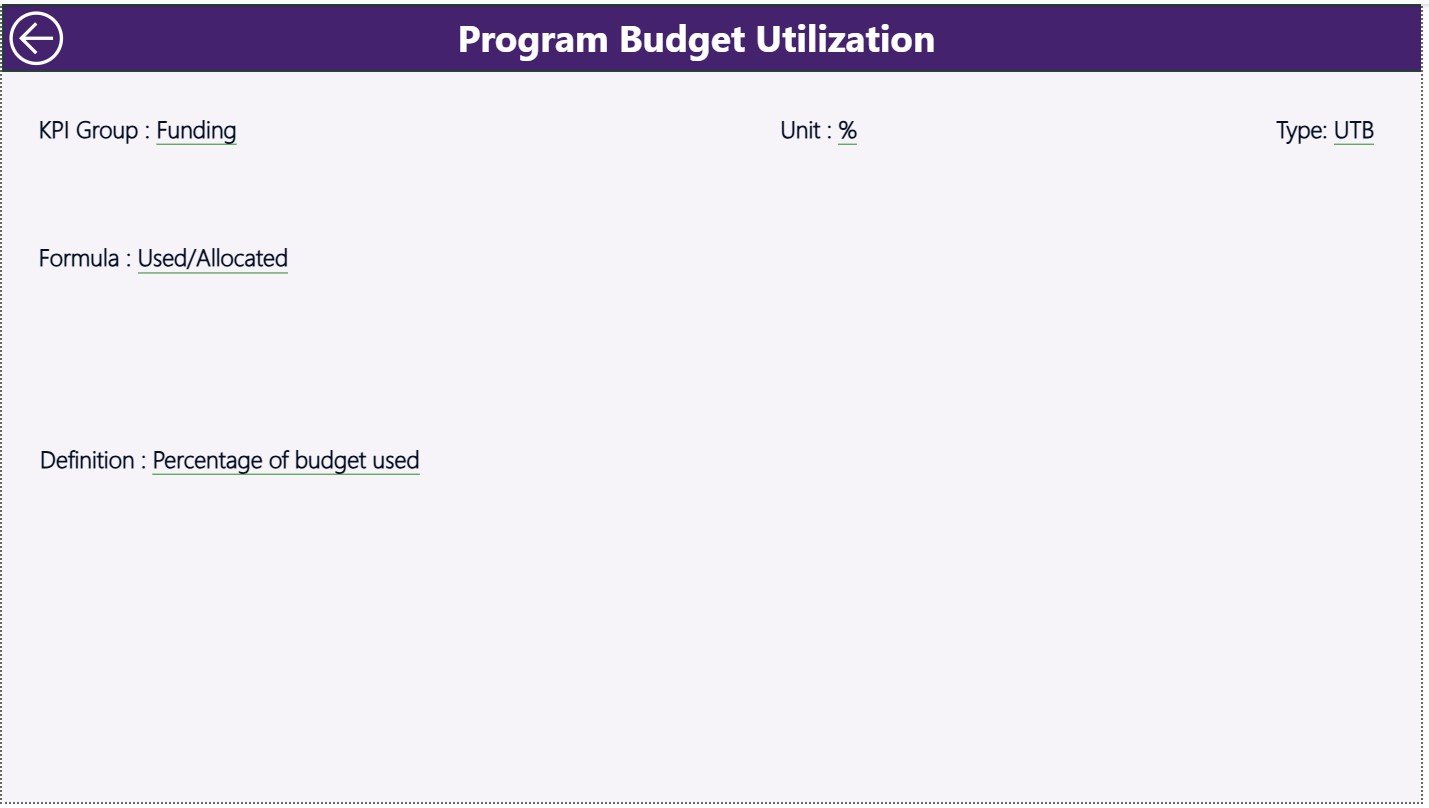
📘 KPI Definition Page
A hidden drill-through reference page that explains KPI Formula, Definition, Unit, and KPI Type (LTB / UTB). It ensures transparency, consistency, and correct KPI interpretation across teams.
📂 Excel Data Structure
The dashboard is powered by three structured Excel worksheets:
-
Input_Actual – Actual MTD & YTD public health performance data
-
Input_Target – Target MTD & YTD benchmarks
-
KPI Definition – KPI number, group, unit, formula, logic, and KPI type
🛠️ How to Use the Public Health Programs KPI Dashboard
✅ Step 1: Enter actual program performance values in the Input Actual sheet
✅ Step 2: Maintain monthly and yearly targets in the Input Target sheet
✅ Step 3: Define and standardize KPIs in the KPI Definition sheet
✅ Step 4: Refresh the Power BI dashboard
✅ Step 5: Monitor KPIs, trends, and risk areas instantly
No advanced Power BI skills are required. The dashboard is easy to deploy, easy to maintain, and easy to understand.
👥 Who Can Benefit from This Dashboard?
🏥 Public Health Program Managers
🏛️ Government Health Departments
🌍 NGOs & International Health Agencies
📊 Monitoring & Evaluation Teams
📈 Policy and Planning Analysts
👔 Senior Health Leadership
Any organization responsible for planning, monitoring, or reporting public health initiatives will benefit immediately.
🔗 Click here to read the Detailed blog post
🎥 Visit our YouTube channel to learn step-by-step video tutorials


Reviews
There are no reviews yet.