


Public Health KPI Scorecard in Excel is a ready-to-use and fully customizable Excel template designed to help health departments, hospitals, NGOs, and policymakers monitor their performance with precision and confidence. 🌍📊
Whether you’re tracking vaccination coverage, analyzing disease trends, or monitoring public health outcomes — this smart scorecard transforms complex data into clear, actionable insights.
By combining interactive visuals, automated calculations, and performance tracking tools, this scorecard empowers teams to make data-driven decisions and achieve measurable results faster than ever before.
✨ Key Features of the Public Health KPI Scorecard in Excel
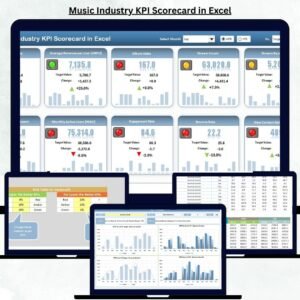
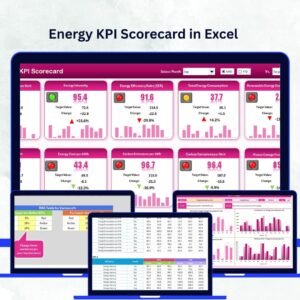
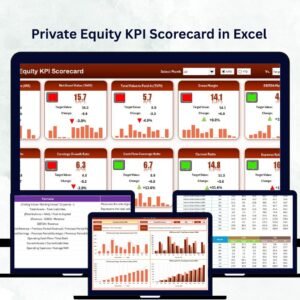
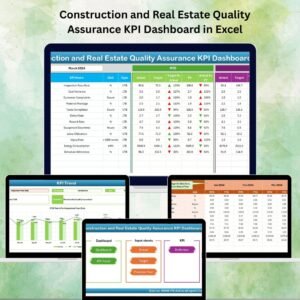
✅ Real-Time Dashboard View – Instantly analyze key health metrics with visual indicators and conditional formatting that highlight performance status.
📅 MTD & YTD Comparisons – Switch seamlessly between Month-to-Date and Year-to-Date data to identify trends over time.
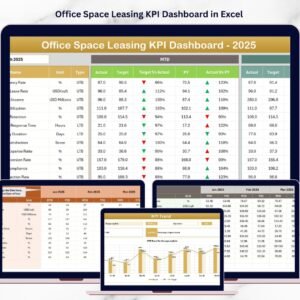
🎯 Actual vs Target Tracking – Compare real outcomes against set targets to evaluate performance accuracy.
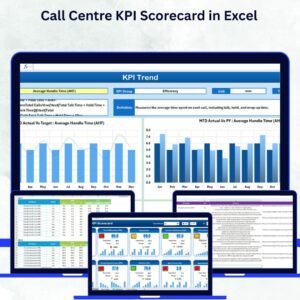
📈 Dynamic Trend Charts – View MTD, YTD, and Previous Year data side-by-side to track improvements or spot declines.
🧩 Color-Coded Insights – Quickly identify high-performing and underperforming KPIs through easy-to-understand color codes.
💡 Fully Customizable Framework – Add, remove, or modify KPIs according to your health department’s priorities.
📊 Simple Data Entry – User-friendly Input Data Sheet ensures smooth updates without technical expertise.
🔐 Protected Formula Design – Prevent accidental changes and ensure the accuracy of results.
This tool is built to simplify monitoring and enhance clarity across every level of public health management.

📂 What’s Inside the Public Health KPI Scorecard in Excel
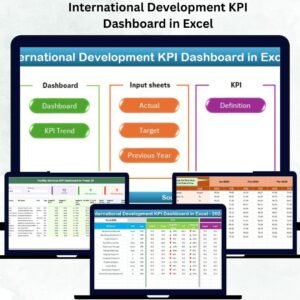
This powerful template is structured into four interactive worksheets, each serving a unique purpose:
1️⃣ Scorecard Sheet (Main Dashboard) – Displays all KPIs in one view with dropdown menus for selecting the reporting month and MTD/YTD performance.
2️⃣ KPI Trend Sheet – Visualize long-term performance for each KPI with interactive charts and trend lines.
3️⃣ Input Data Sheet – The foundation for all data. Easily enter or update KPI values, targets, and historical data.
4️⃣ KPI Definition Sheet – Define and document each KPI’s name, group, unit, formula, and definition to ensure clarity and consistency.
Together, these sheets provide a complete performance management system within a single Excel file.
🧭 How to Use the Public Health KPI Scorecard in Excel
1️⃣ Define Your KPIs: Start by listing all your health indicators in the KPI Definition Sheet.
2️⃣ Set Realistic Targets: Assign measurable and achievable goals for each metric.
3️⃣ Input Data Regularly: Update actual and target values in the Input Data Sheet for live dashboard updates.
4️⃣ Review Dashboard Insights: Use the Scorecard and Trend sheets to identify patterns, successes, or concerns.
5️⃣ Act on Findings: Use insights to adjust strategies, allocate resources, and improve health outcomes.
No coding or technical setup is required — just open, input, and analyze! 🧮
👥 Who Can Benefit from This Public Health KPI Scorecard
🏥 Hospitals & Clinics: Monitor patient care metrics and service efficiency.
🌐 Public Health Departments: Evaluate disease prevention programs and vaccination drives.
🤝 NGOs & Nonprofits: Track project impact, outcomes, and donor-funded program performance.
📋 Policy & Research Teams: Use measurable indicators to inform strategy and decision-making.
💼 Consultants & Analysts: Present data-driven health reports with confidence and visual clarity.
This scorecard is your go-to Excel toolkit for improving performance visibility, driving accountability, and fostering data transparency.
🔗 Click here to read the detailed blog post
Watch the step-by-step video tutorial:
📺 Visit our YouTube channel to learn step-by-step video tutorials.


Reviews
There are no reviews yet.