Public broadcasting organizations operate under constant public, regulatory, and funding scrutiny. They must prove impact, justify budgets, manage costs, improve audience reach, and maintain transparency—all at the same time. Public Broadcasting KPI Dashboard in Excel However, relying on scattered spreadsheets, manual calculations, and delayed reports makes performance tracking slow and unreliable.
That is exactly why the Public Broadcasting KPI Dashboard in Excel is a powerful and practical performance management solution.
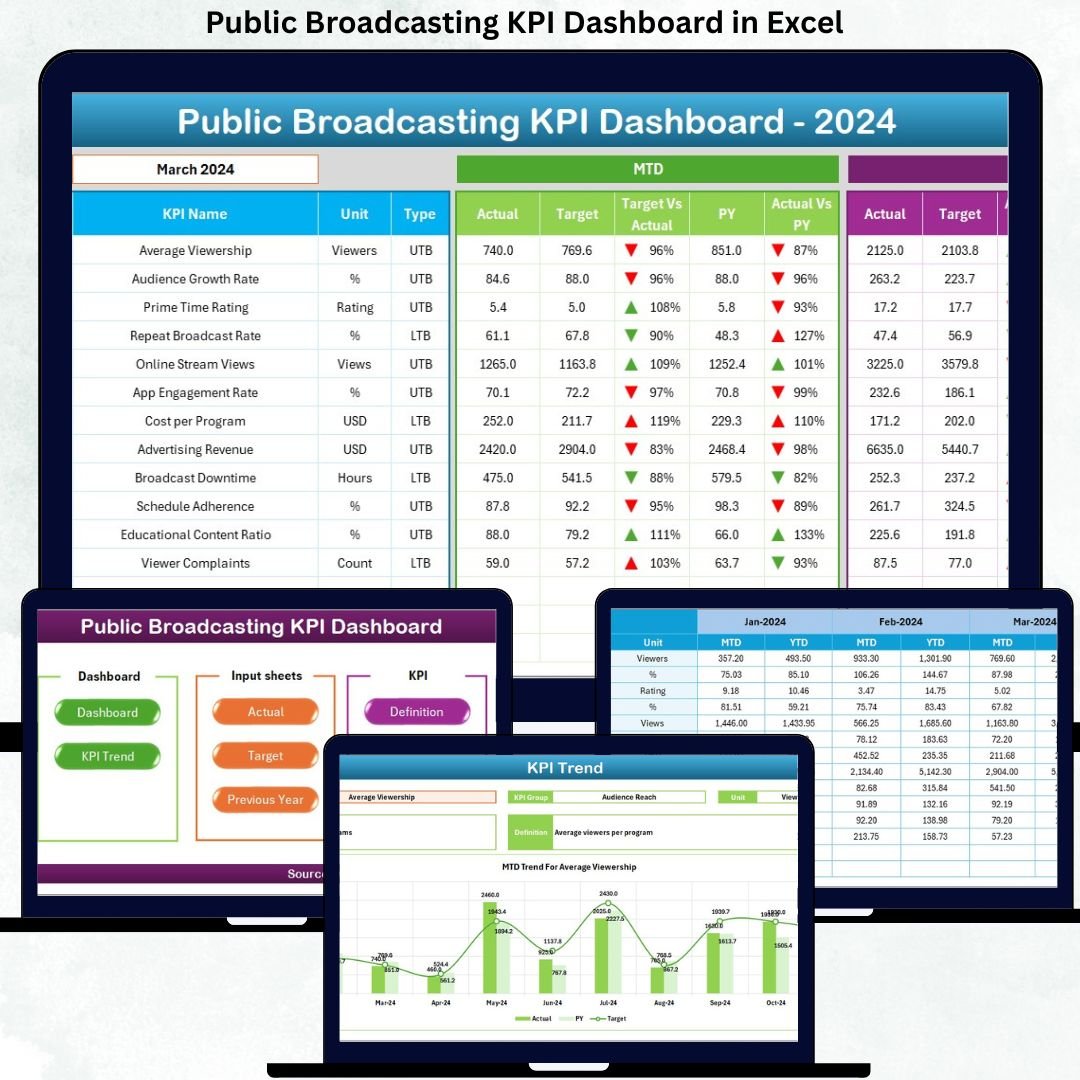
This ready-to-use Excel dashboard converts raw operational data into clear KPIs, structured comparisons, and meaningful trends. Instead of juggling multiple files, public broadcasters get one centralized dashboard that tracks actuals, targets, and previous-year performance with automatic calculations and visual indicators. As a result, teams gain clarity, confidence, and control over performance reporting.
🔑 Key Features of Public Broadcasting KPI Dashboard in Excel
📊 Centralized KPI Monitoring
Track all public broadcasting KPIs in one structured Excel dashboard.
📅 MTD & YTD Performance Tracking
Analyze month-to-date and year-to-date results together for a complete view.
🎯 Target vs Actual Comparison
Instantly see whether KPIs meet targets using percentages and arrows.
📈 Previous Year Comparison
Measure improvement or decline using PY vs CY comparisons.
🧭 Interactive Month & KPI Selection
Use drop-downs to filter data instantly without manual recalculation.
📊 Dynamic Charts & Trend Analysis
Visualize KPI performance over time using MTD and YTD trend charts.
⚙️ Excel-Based & Easy to Maintain
No BI tools required—works entirely inside Microsoft Excel.
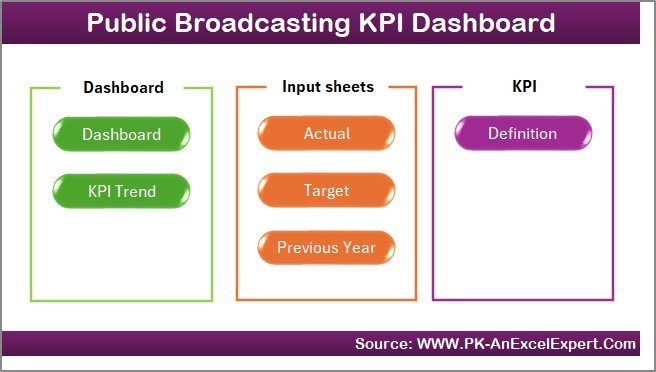
📦 What’s Inside the Public Broadcasting KPI Dashboard in Excel
This professional dashboard includes 7 well-organized worksheets, each serving a specific purpose:
🏠 Home Sheet
Acts as a navigation hub with clean design and one-click buttons to access key sheets.
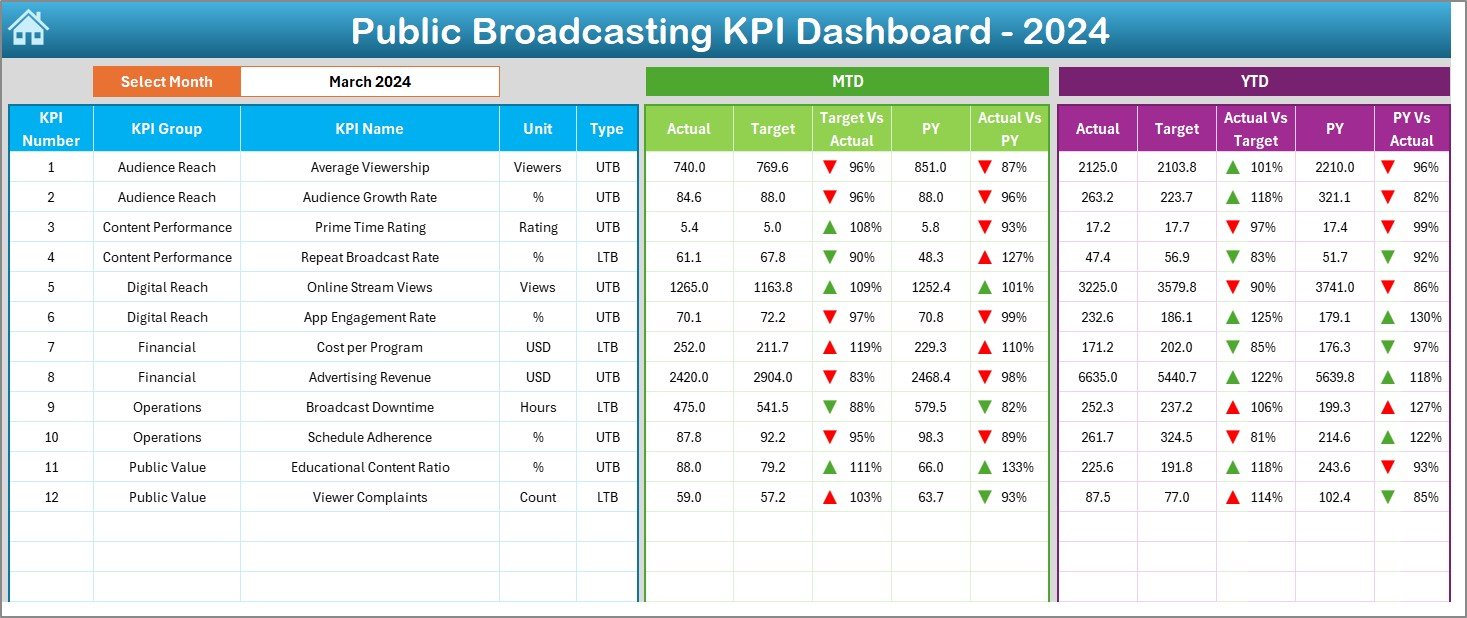
📊 Dashboard Sheet
The main performance view featuring:
-
Month selection (Cell D3)
-
MTD and YTD Actual, Target, and Previous Year values
-
Target vs Actual % and PY vs Actual %
-
Conditional formatting with up/down arrows for instant insights
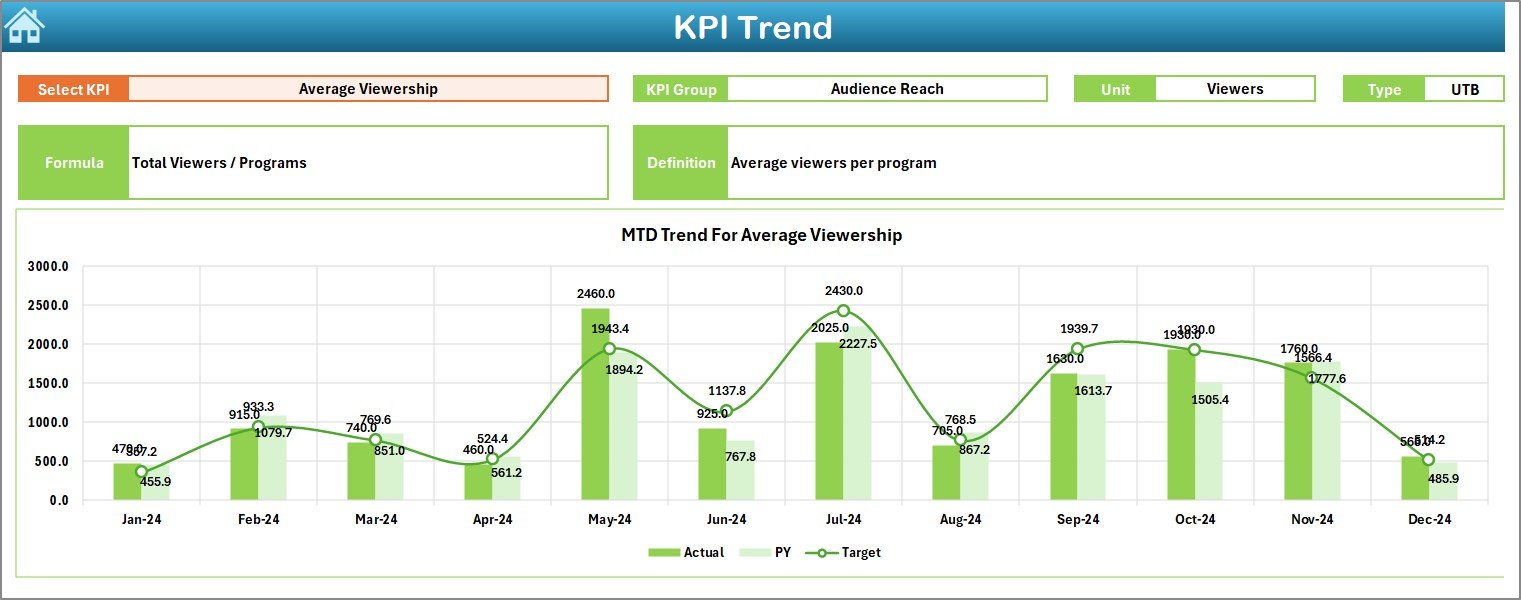
📈 KPI Trend Sheet
Provides KPI-level analysis with:
-
KPI selection drop-down
-
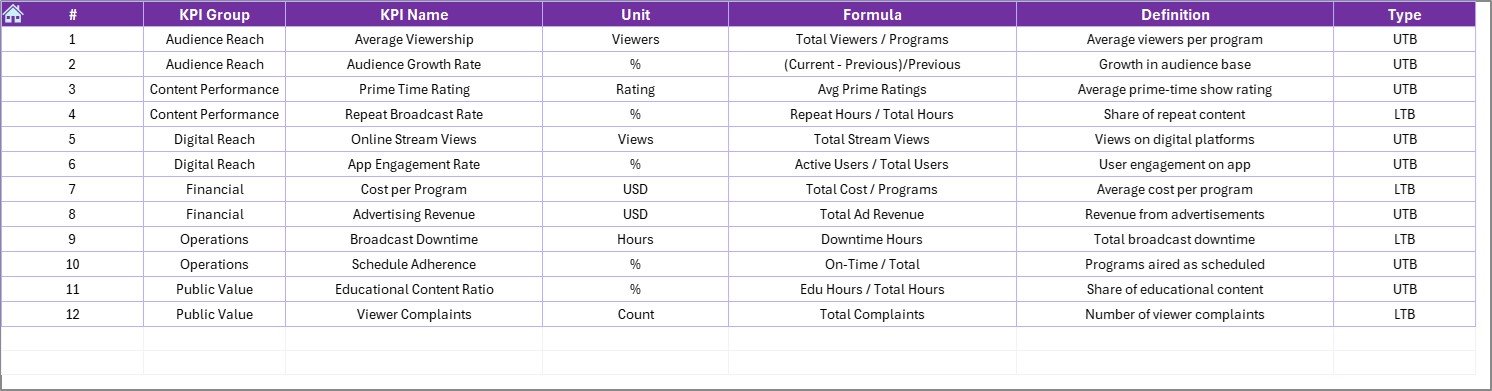
KPI metadata (Group, Unit, Type, Formula, Definition)
-
MTD and YTD trend charts comparing Actual, Target, and Previous Year
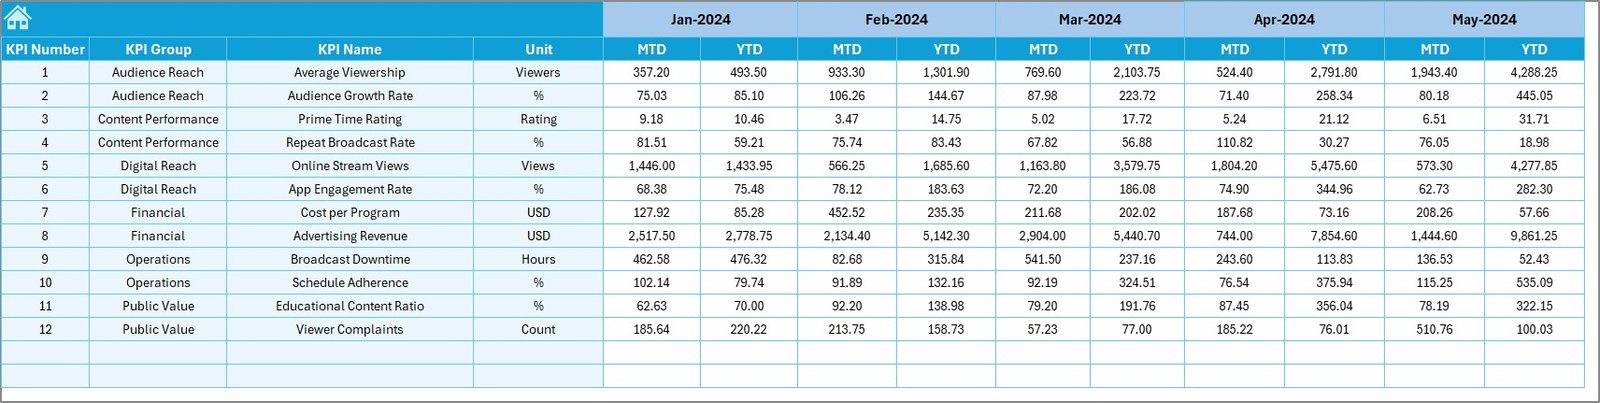
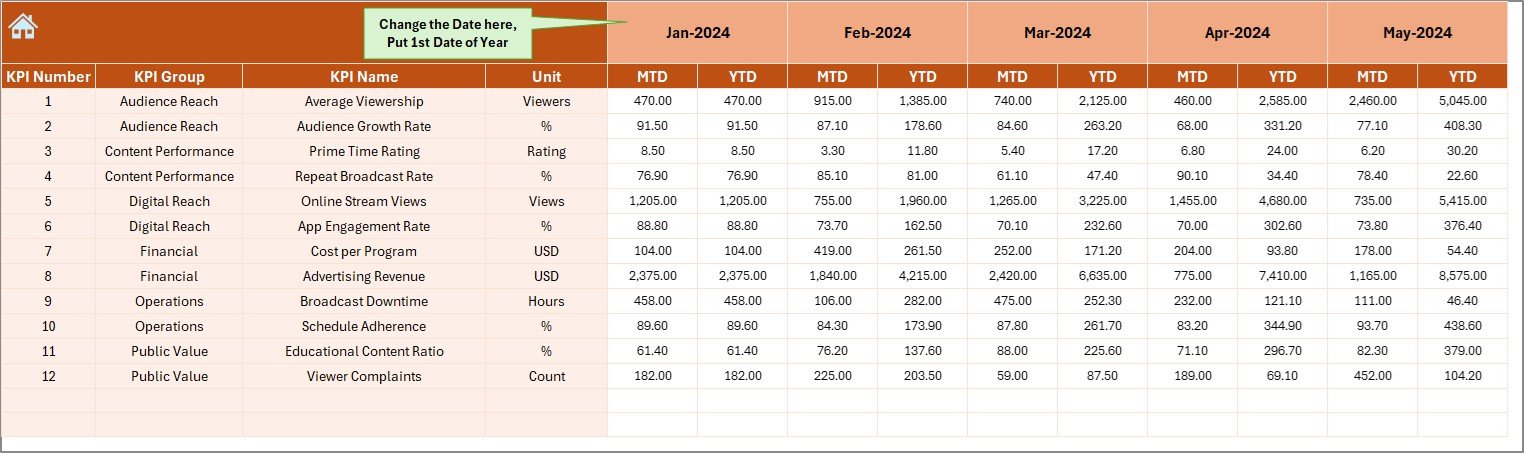
📝 Actual Numbers Input Sheet
Used to enter current-year MTD and YTD actual values in a structured format.
🎯 Target Sheet
Stores monthly MTD and YTD target values for each KPI.
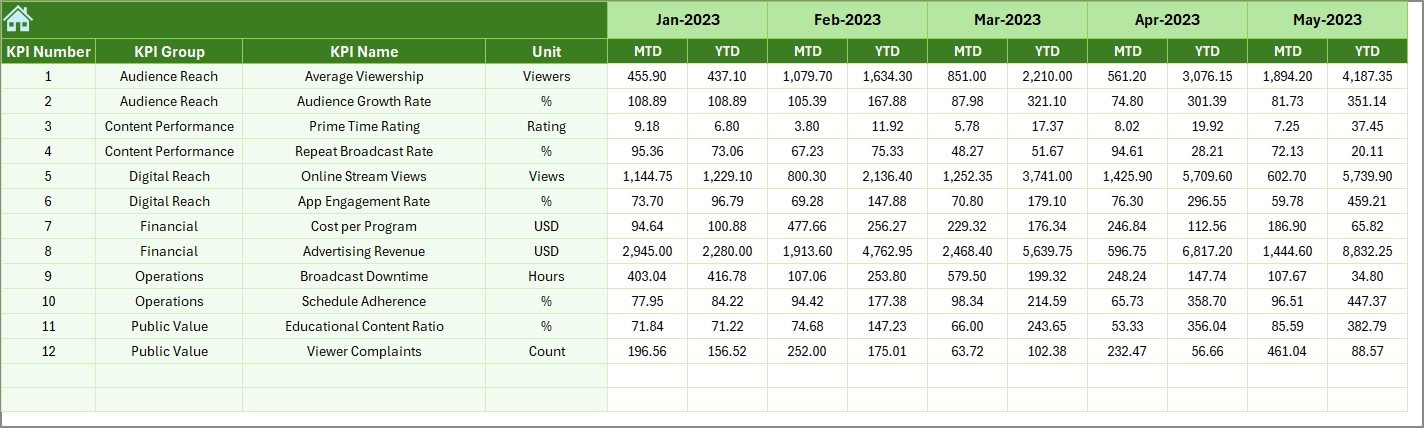
📜 Previous Year Number Sheet
Holds historical data to enable year-over-year comparisons.
📘 KPI Definition Sheet
Maintains KPI Name, Group, Unit, Formula, and Definition to ensure consistency.
▶️ How to Use the Public Broadcasting KPI Dashboard in Excel
Using the dashboard is simple and user-friendly:
1️⃣ Enter actual performance data in the Actual Numbers Input sheet
2️⃣ Update targets in the Target sheet
3️⃣ Maintain KPI details in the KPI Definition sheet
4️⃣ Select the desired month from the drop-down
5️⃣ Review MTD and YTD performance on the Dashboard
6️⃣ Analyze trends and comparisons on the KPI Trend sheet
7️⃣ Make informed operational and strategic decisions
No advanced Excel skills are required.
🎯 Who Can Benefit from This Public Broadcasting KPI Dashboard in Excel
📺 Public Broadcasting Executives – Monitor performance and justify funding
📊 Media Operations Managers – Track efficiency and operational KPIs
💰 Finance & Reporting Teams – Improve accuracy and transparency
🎙️ Content & Programming Planners – Align content strategy with performance
🏛️ Government & Funding Stakeholders – Review clear, structured reports
The dashboard supports both managerial reviews and strategic planning.
👉 Click here to read the Detailed Blog Post
🔔 Visit our YouTube channel to learn step-by-step video tutorials
👉 YouTube.com/@PKAnExcelExpert


Reviews
There are no reviews yet.