


Our Production Planning Dashboard in Power BI is a ready-to-use, interactive solution that transforms complex production data into clear, actionable insights. Designed for manufacturing and operations teams, it helps you monitor performance, track progress, and identify bottlenecks—all in real time.
🔹 5 Interactive Pages – Navigate through dedicated pages for Overview, Category & Plant Analysis, Production Line Analysis, Planner Performance, and Monthly Trends.
🔹 Customizable Slicers – Filter data by date, plant, product category, production line, and more.
🔹 Real-Time KPIs – Instantly track Total Orders, Completion Rate, Pending Orders, and more.
🔹 Visual Insights – Clean, professional charts and graphs make trends easy to understand.
🔹 Scalable Design – Works for small manufacturing units and large multi-plant operations.
📂 What’s Inside the Production Planning Dashboard
This dashboard is pre-built with five high-impact analytical pages:
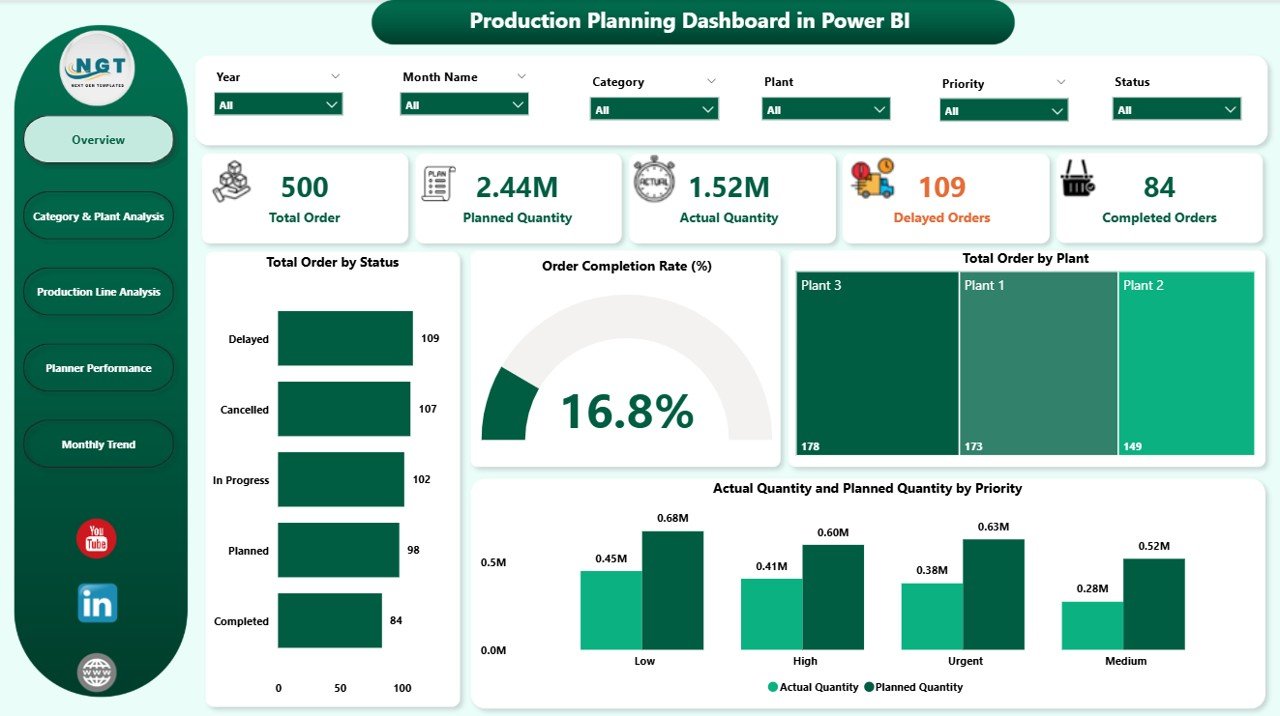
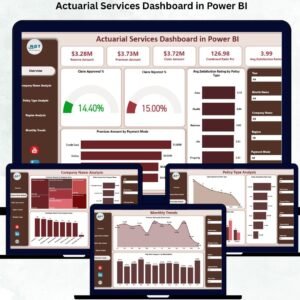
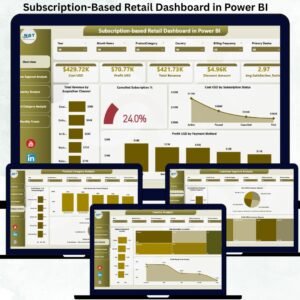
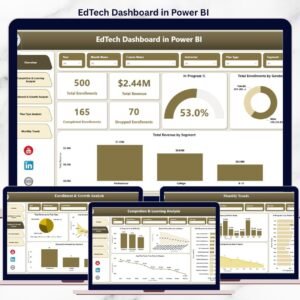
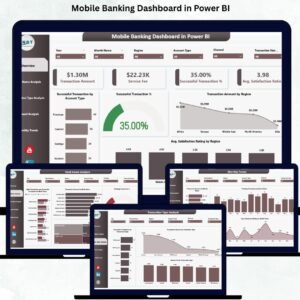
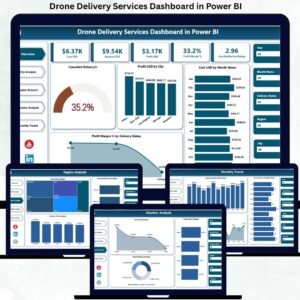
1️⃣ Overview Page – The central hub for all key metrics. See order status, completion rates, plant-wise distribution, and planned vs. actual production figures in seconds.
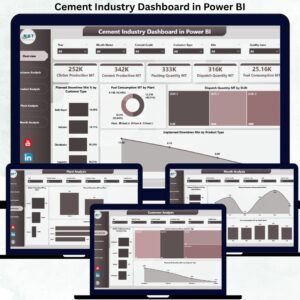
2️⃣ Category & Plant Analysis – Pinpoint which product categories or plants are performing best and which need attention.
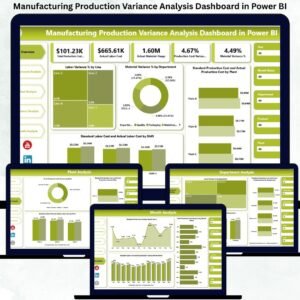
3️⃣ Production Line Analysis – Monitor efficiency by production line, track cancellation rates, and compare planned vs. actual outputs.
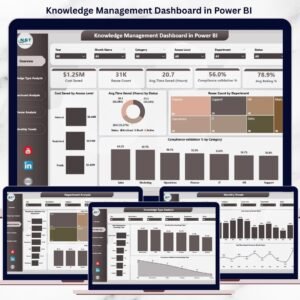
4️⃣ Planner Performance – Evaluate individual planner efficiency, spot delays, and optimize scheduling.
5️⃣ Monthly Trends – Identify seasonal patterns, demand fluctuations, and recurring issues for better forecasting.
🛠 How to Use the Production Planning Dashboard
Using this dashboard is simple:
-
Load Your Data – Connect to Excel, ERP, SQL, or other data sources.
-
Select Filters – Use slicers to choose date ranges, plants, or product categories.
-
Analyze Performance – Review KPIs and drill down into problem areas.
-
Take Action – Make informed decisions to reduce delays, increase efficiency, and improve production planning.
💡 Pro Tip: Schedule automatic data refresh in Power BI so your dashboard is always up to date.
👥 Who Can Benefit from This Dashboard
This dashboard is perfect for:
🏭 Manufacturing Managers – Stay on top of production schedules and targets.
📊 Operations Analysts – Spot inefficiencies and optimize workflows.
👷 Production Planners – Compare planned vs. actual performance for smarter scheduling.
📈 Business Owners – Get a clear, real-time view of operational performance.
🌍 Multi-Plant Operators – Compare performance across locations for better resource allocation.
🔥 Why You’ll Love It
✔ Faster Decisions – Instant insights mean less waiting and more action.
✔ Better Resource Allocation – Focus on the areas that matter most.
✔ Error Reduction – Minimize mismatches between planned and actual figures.
✔ Team Alignment – Keep everyone on the same page with shared visuals.


Reviews
There are no reviews yet.