Marketing moves fast. Campaigns launch weekly. Budgets shift daily. Products compete aggressively. But without structured data, even high-performing teams struggle to see what’s really working.
Which product drives maximum revenue?
Which region misses targets?
Which channel delivers real ROI?
Are conversion rates improving month over month?
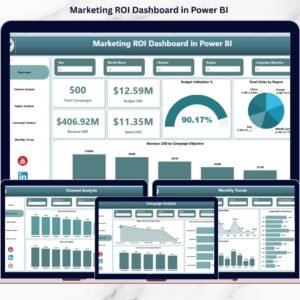
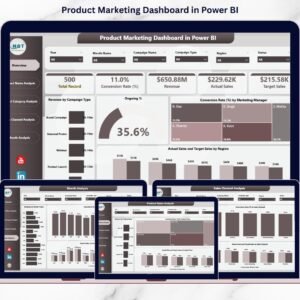
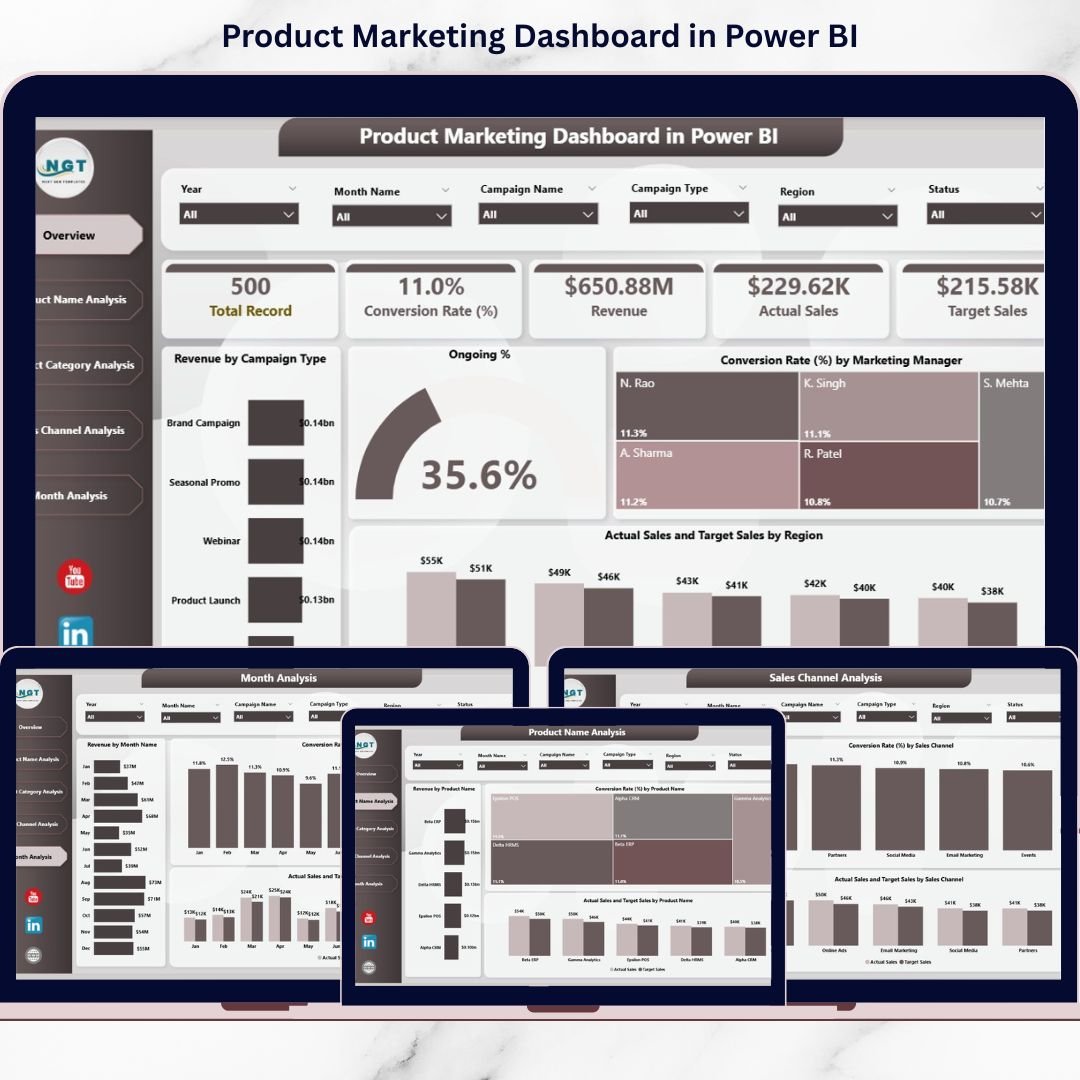
Instead of relying on scattered Excel files and manual reports, the Product Marketing Dashboard in Power BI centralizes everything into one powerful, interactive system.
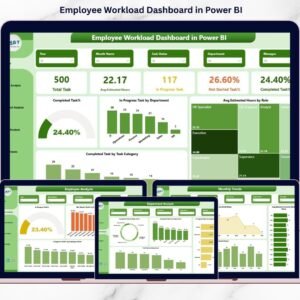
This ready-to-use dashboard helps you track Revenue, Conversion Rate, Actual vs Target Sales, Campaign Performance, Regional Sales, Channel Efficiency, and Monthly Trends — all in real time.
This is not just a report.
This is your marketing growth engine. 🚀📊
🚀 Key Feature of Product Marketing Dashboard in Power BI
📊 5 Powerful Analytical Pages
Analyze marketing performance from multiple perspectives — Overview, Product, Category, Channel, and Month.
🎯 Target vs Actual Sales Tracking
Instantly compare actual sales against targets across regions, products, and channels.
📈 Conversion Rate Analysis
Monitor conversion rates by product, marketing manager, and channel.
💰 Revenue Monitoring in Real Time
Track campaign revenue, product revenue, and regional revenue dynamically.
📍 Regional Sales Performance Insights
Identify which regions are meeting or missing sales targets.
📣 Campaign Performance Visibility
See which campaign types generate the highest revenue.
🎛 Dynamic Slicers for Flexible Filtering
Filter data by Month, Region, Campaign Type, Marketing Manager, or Product instantly.
🔎 Drill-Down Capability
Move from category-level view to product-level analysis effortlessly.
⚡ Real-Time Interactive Visuals
Refresh data and get instant updated insights.
📦 What’s Inside the Product Marketing Dashboard in Power BI
This dashboard includes 5 structured pages:
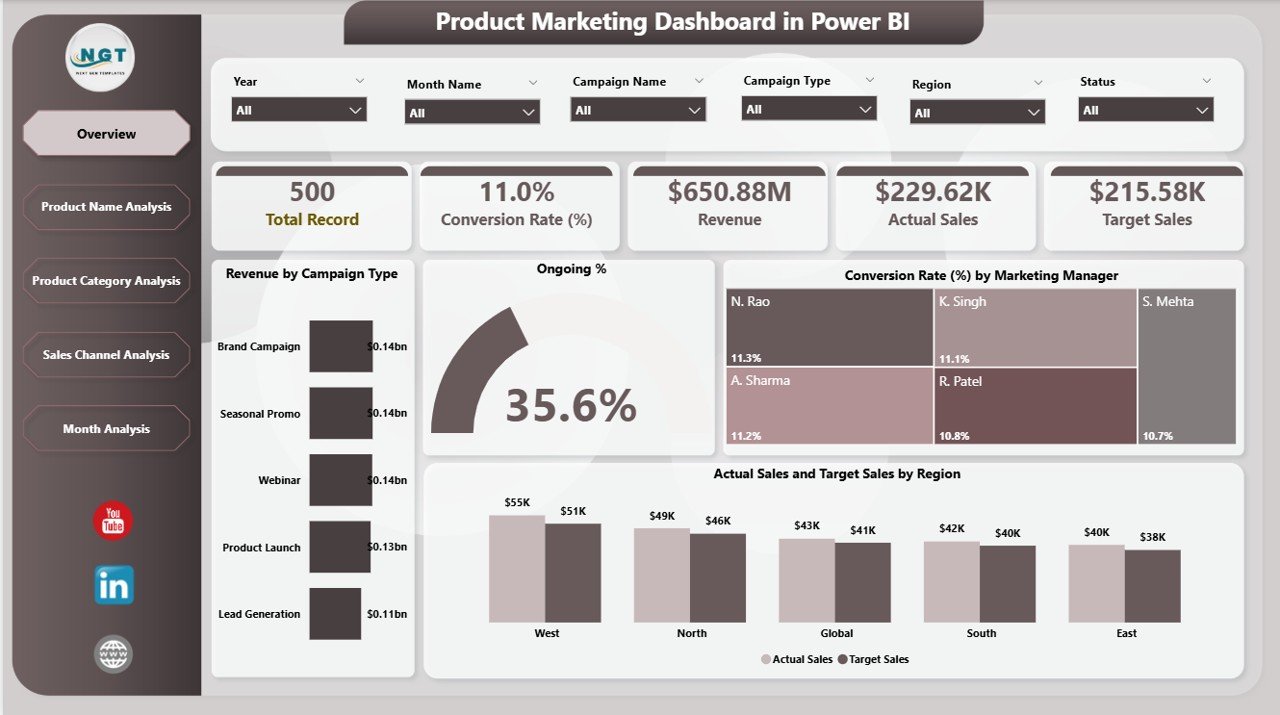
1️⃣ Overview Page – The Marketing Control Center
-
Revenue by Campaign Type
-
Ongoing %
-
Conversion Rate by Marketing Manager
-
Actual Sales by Region
-
Target Sales by Region
This page gives leadership teams an immediate performance snapshot.
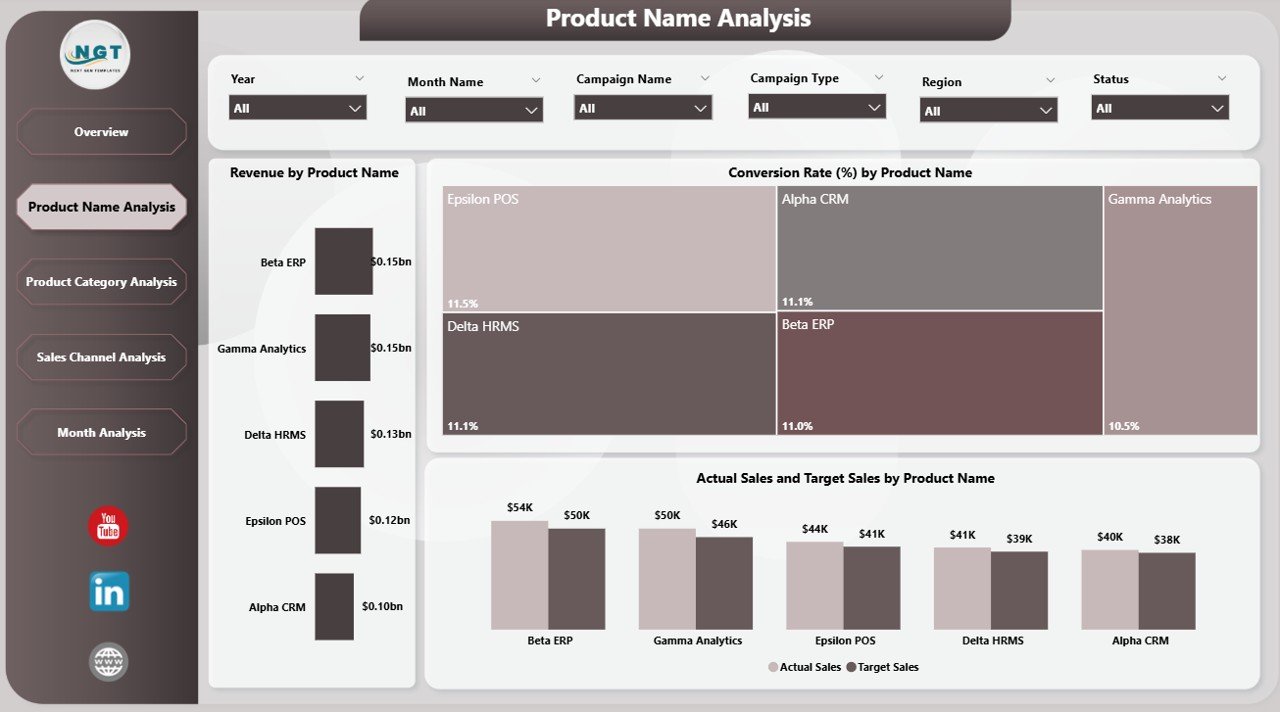
2️⃣ Product Name Analysis
-
Revenue by Product Name
-
Conversion Rate by Product Name
-
Actual vs Target Sales by Product
Identify top-performing and underperforming products instantly.
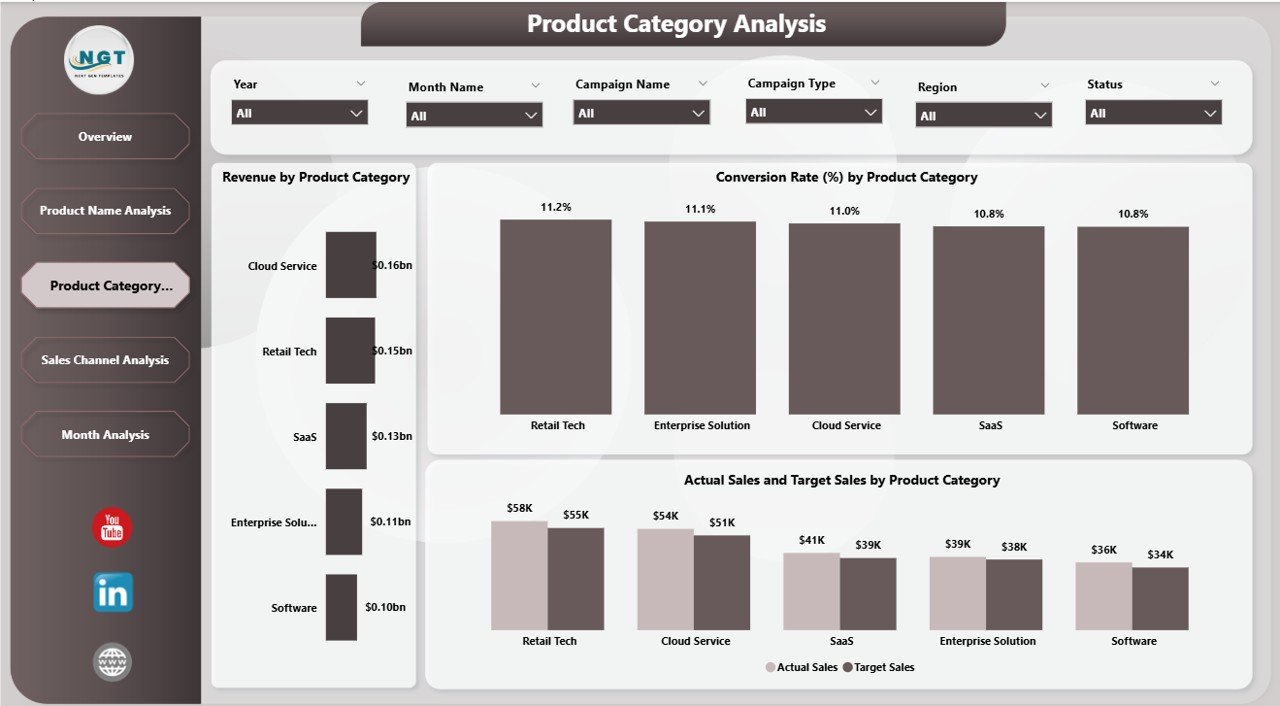
3️⃣ Product Category Analysis
-
Revenue by Product Category
-
Conversion Rate by Category
-
Actual vs Target Sales by Category
Make strategic decisions at category level for better ROI.
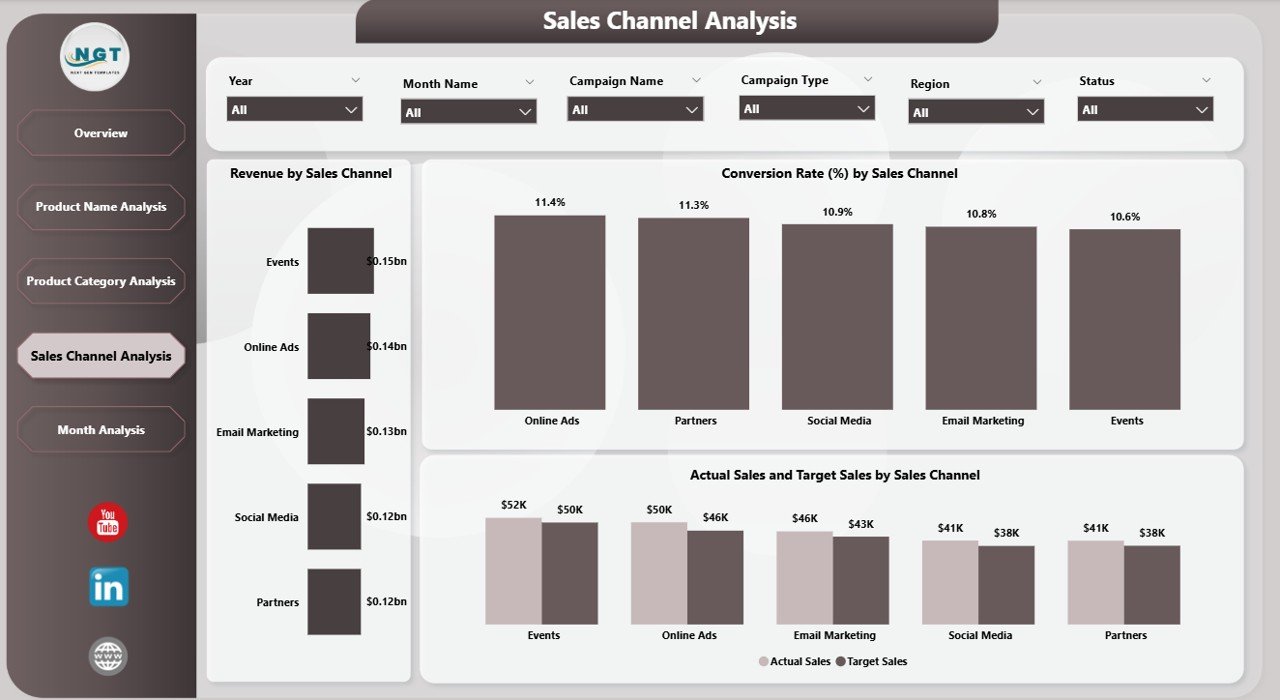
4️⃣ Sales Channel Analysis
-
Revenue by Channel
-
Conversion Rate by Channel
-
Actual vs Target Sales by Channel
Optimize budget allocation based on channel efficiency.
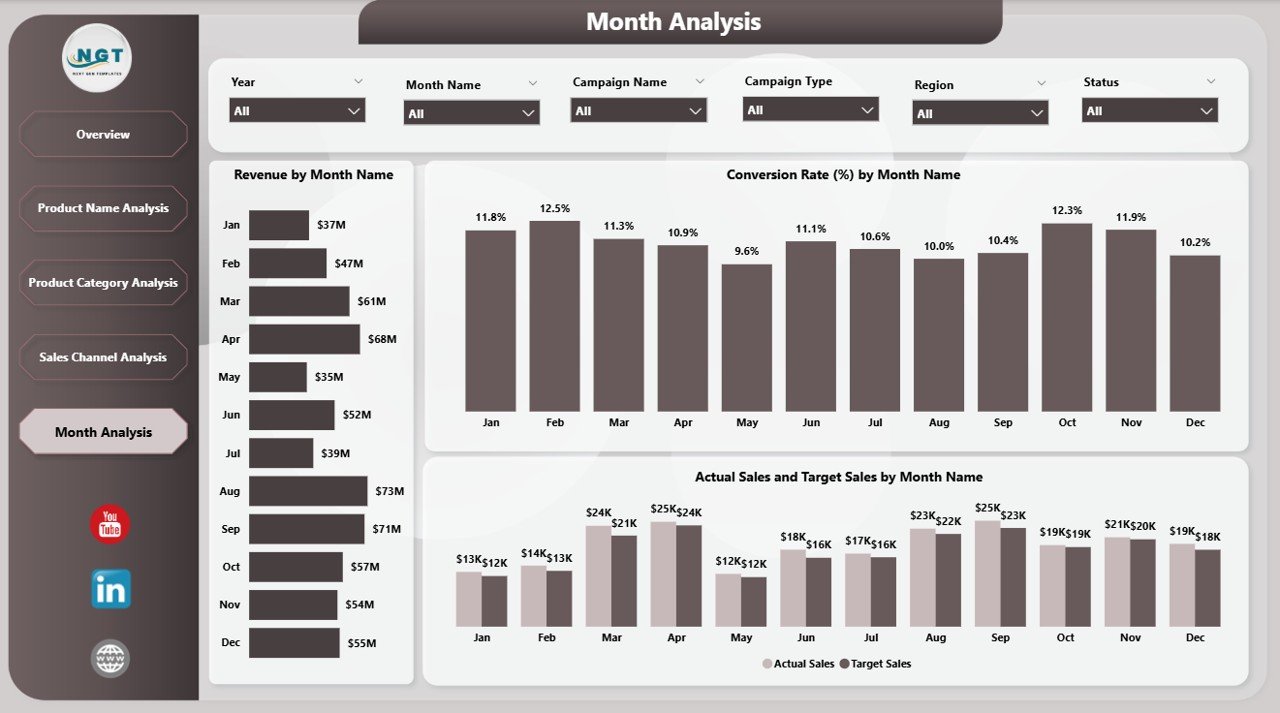
5️⃣ Month Analysis
-
Revenue by Month
-
Conversion Rate by Month
-
Actual vs Target Sales by Month
Track growth trends and seasonal patterns for better forecasting.
🛠 How to Use the Product Marketing Dashboard in Power BI
Getting started is simple:
1️⃣ Prepare structured Excel data
2️⃣ Import into Power BI
3️⃣ Refresh data regularly
4️⃣ Use slicers to filter insights
5️⃣ Start with Overview page
6️⃣ Drill into Product, Category, Channel, or Month analysis
7️⃣ Take strategic action based on data
No complicated setup. Just structured marketing intelligence.
👥 Who Can Benefit from This Product Marketing Dashboard in Power BI
This dashboard is ideal for:
📊 Marketing Managers
📈 Sales Managers
💼 Business Owners
🛒 E-commerce Companies
📦 Product Managers
🌍 Regional Sales Heads
📣 Digital Marketing Agencies
If you sell products and run campaigns, this dashboard gives you clarity and control.
Why This Dashboard Drives Real Growth
When you track:
-
Revenue
-
Conversion Rate
-
Target Achievement %
-
Regional Sales Performance
-
Channel Performance
-
Campaign Revenue
-
Monthly Trends
You eliminate guesswork.
You improve accountability.
You optimize marketing budgets.
You focus on profitable products.
You increase ROI consistently.
Marketing becomes measurable.
Growth becomes predictable.
Decisions become data-driven. 🔥
Click here to read the Detailed blog post
Visit our YouTube channel to learn step-by-step video tutorials
YouTube Channel