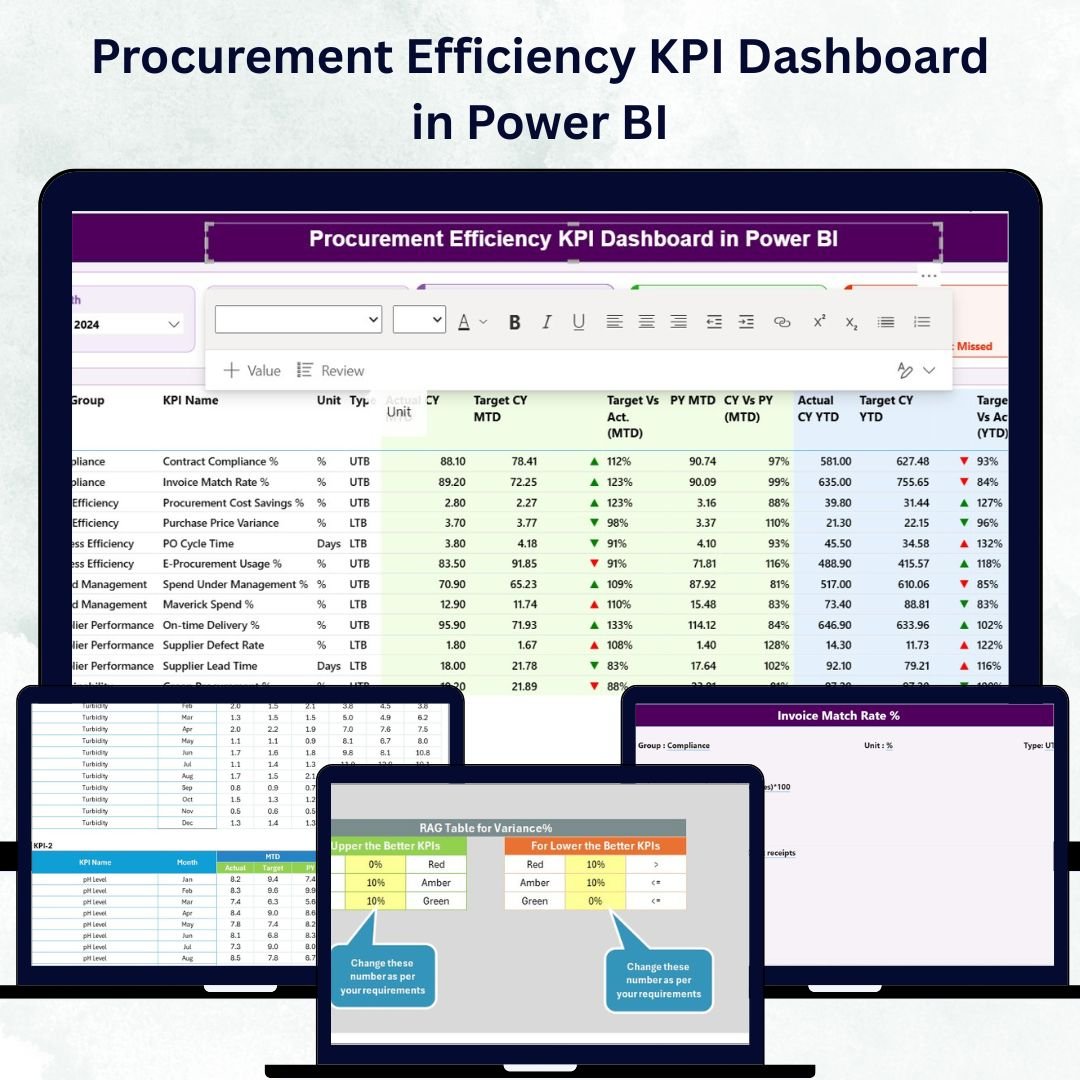
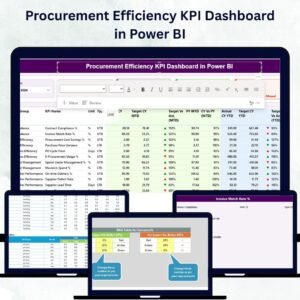
In today’s competitive business landscape, organizations can no longer rely on guesswork to manage procurement performance. 📊 The Procurement Efficiency KPI Dashboard in Power BI is a powerful, ready-to-use analytics solution designed to help you monitor, analyze, and optimize every aspect of your procurement operations — from supplier performance to cost savings.
This dynamic dashboard turns your Excel-based procurement data into stunning Power BI visuals, offering a complete view of your purchasing efficiency and trends. Whether you’re a procurement manager, financial controller, or operations executive, this tool gives you the real-time insights needed to make smarter, faster, and more profitable decisions. 🚀Procurement Efficiency KPI Dashboard in Power BI
✨ Key Features of the Procurement Efficiency KPI Dashboard in Power BI
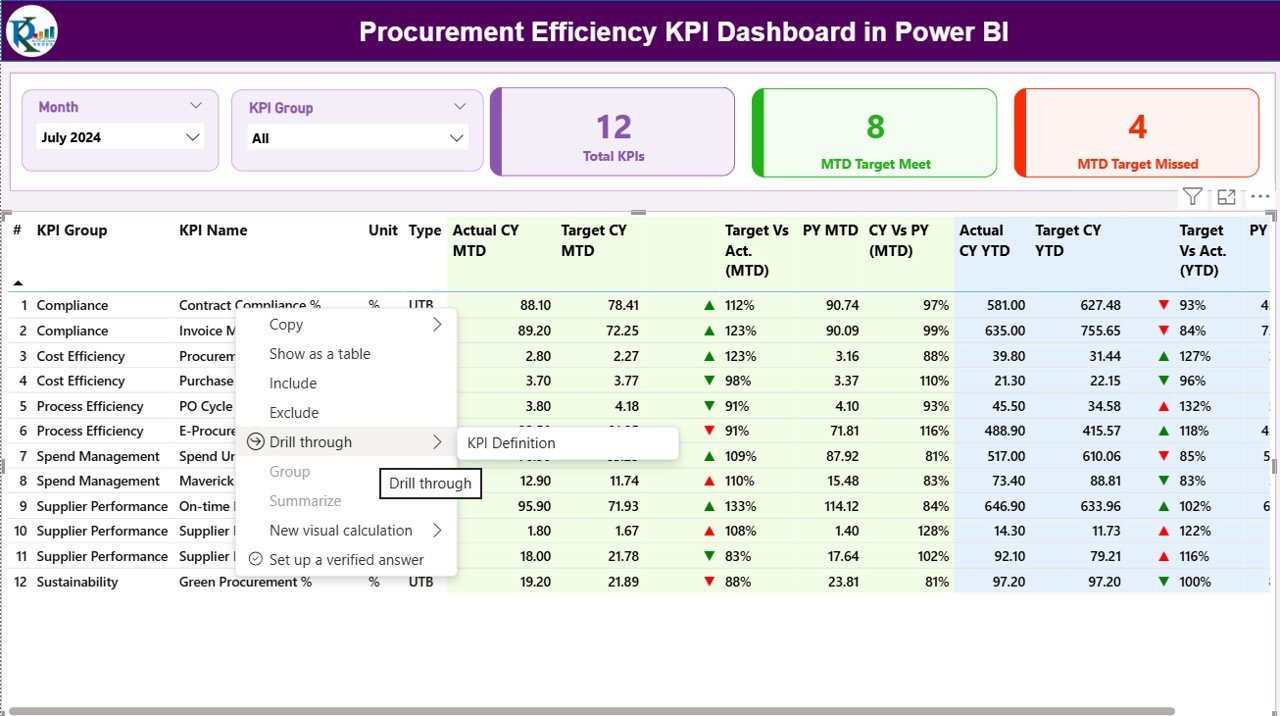
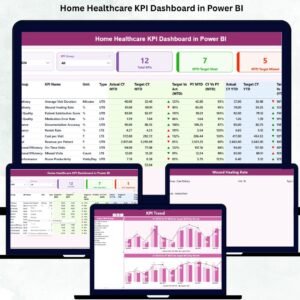
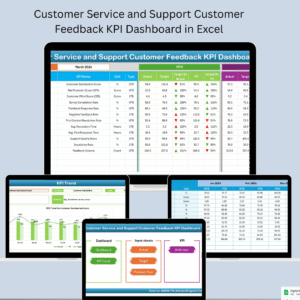
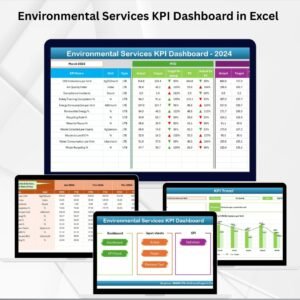
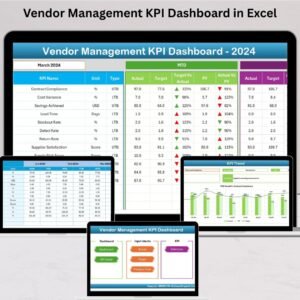
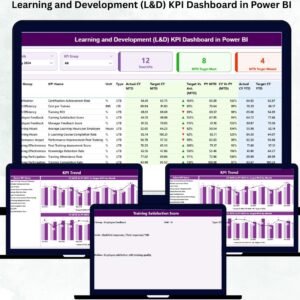
🌐 Interactive Summary Page – Get a quick snapshot of procurement health with real-time KPI cards showing Total KPIs Count, MTD Target Met, and MTD Target Missed. Filter easily by month and KPI group.
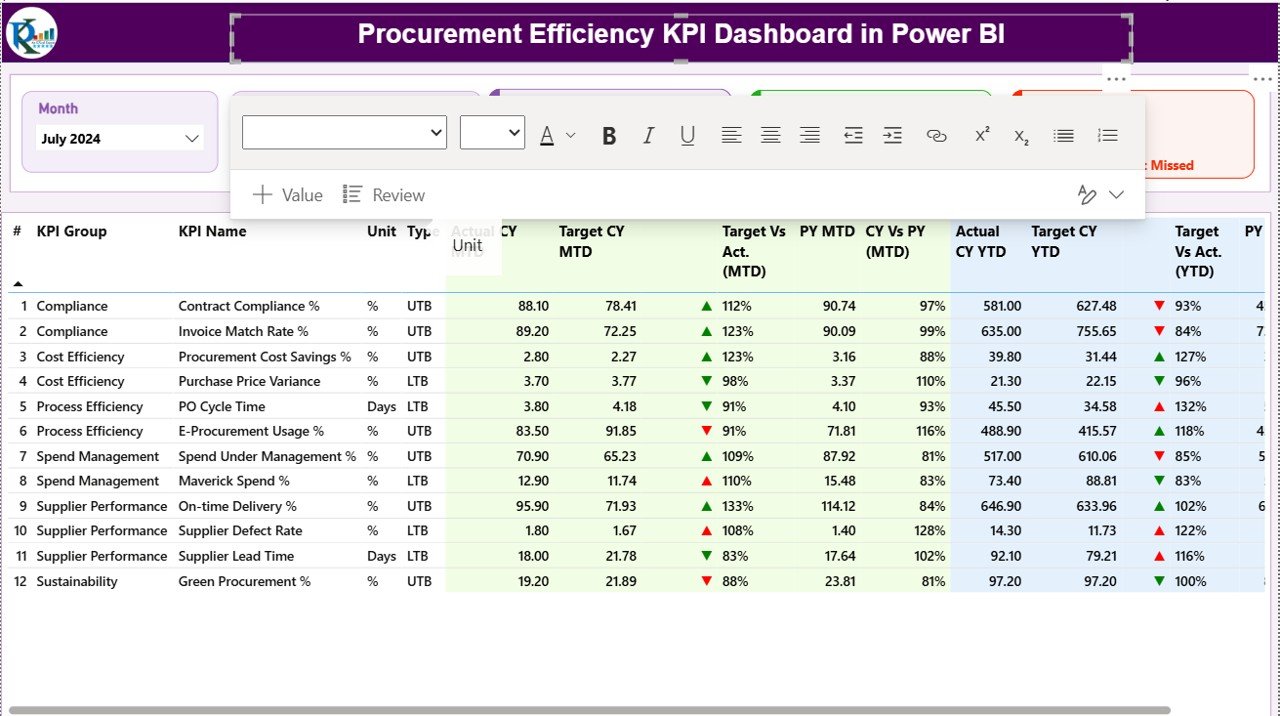
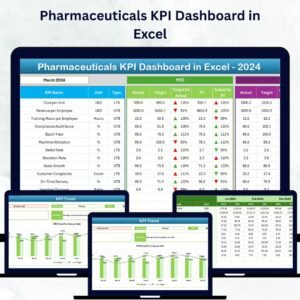
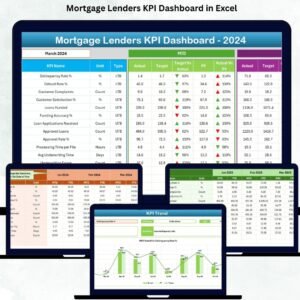
📈 Detailed KPI Table View – See all key data in one place: KPI Number, Group, Unit, Type, Actual vs Target (MTD & YTD), and year-over-year comparisons with color-coded icons (▲▼).
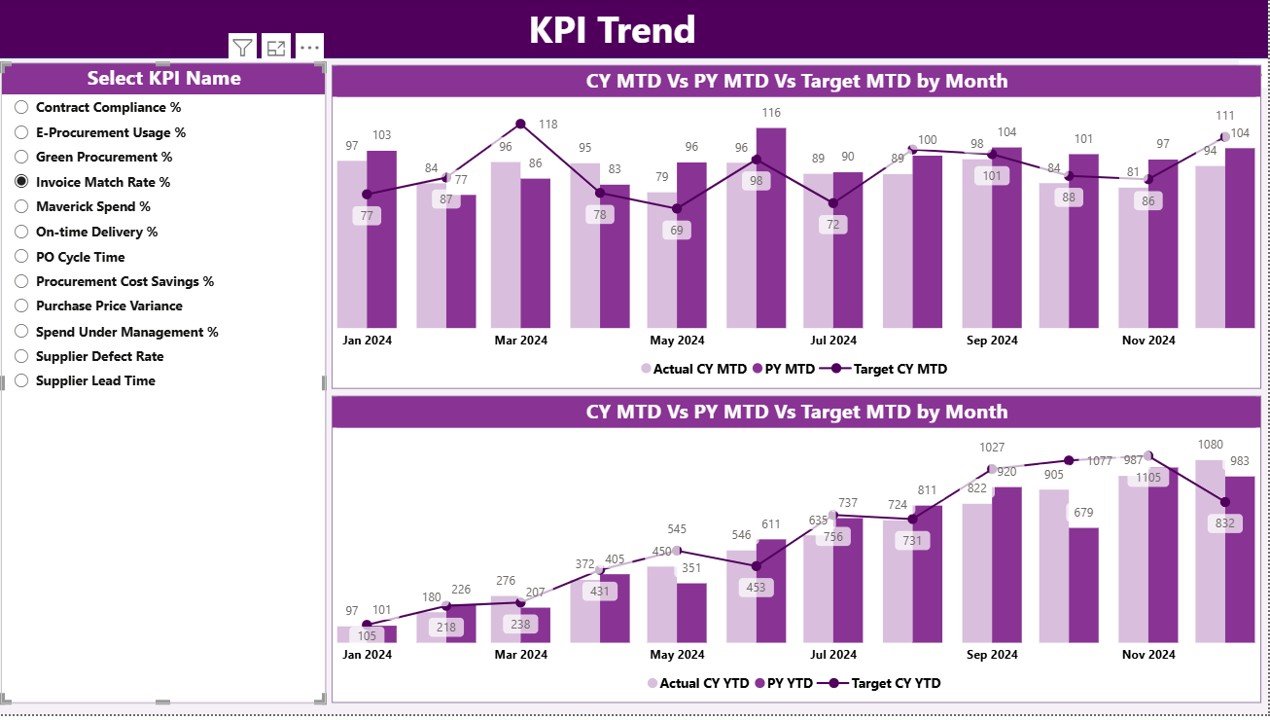
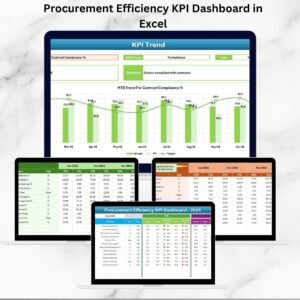
📊 KPI Trend Analysis – Visualize trends for Month-to-Date (MTD) and Year-to-Date (YTD) metrics through combo charts comparing current year vs previous year vs target.
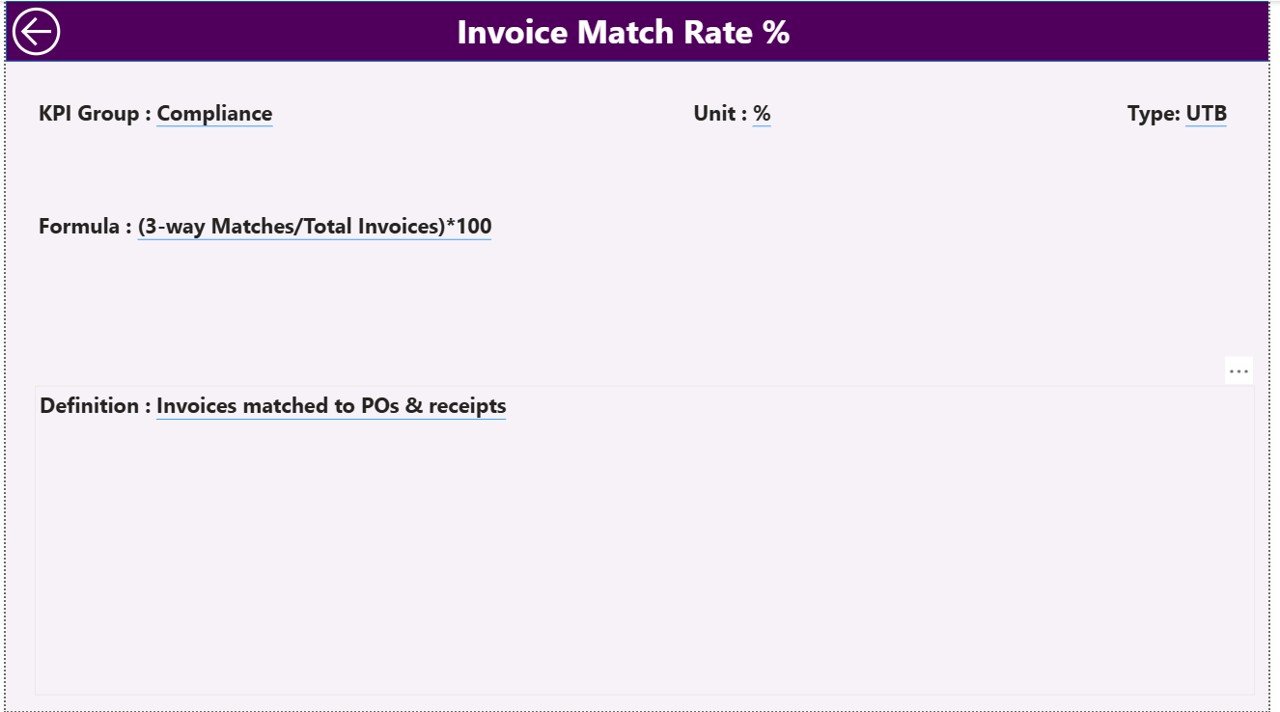
🔍 Drill-Through Definition Page – Understand each KPI’s formula, logic, and measurement type (UTB/LTB) using the KPI Definition page, accessible through interactive drill-through functionality.Procurement Efficiency KPI Dashboard in Power BI
💡 Excel-Driven Data Source – The dashboard connects to three Excel sheets: Input_Actual, Input_Target, and KPI_Definition, making it easy to update data without technical skills.
⚙️ Fully Automated Refresh – Once the data is updated in Excel, Power BI automatically refreshes visuals — no manual reporting required.
🧩 Customizable Layout – Tailor visuals, filters, and KPI groups to suit your industry — manufacturing, retail, healthcare, or government procurement.
📘 What’s Inside the Procurement Efficiency KPI Dashboard
This dashboard template includes:
-
Power BI File (.pbix) – Pre-built with all three dashboard pages (Summary, KPI Trend, and Definition).
-
Excel Data Source – Structured with 3 sheets:
Input_Actual,Input_Target, andKPI_Definition. -
Interactive Visuals – Dynamic cards, combo charts, slicers, and icons for performance tracking.
-
Drill-Through Functionality – View KPI-level insights and navigate seamlessly.
-
Guided Setup Instructions – Step-by-step guide for connecting your data and refreshing visuals.
With these components, you’ll have a complete system that visualizes procurement performance and drives accountability across your organization. 📑Procurement Efficiency KPI Dashboard in Power BI
🧭 How to Use the Procurement Efficiency KPI Dashboard
1️⃣ Update Data in Excel – Enter your latest MTD and YTD actual and target values in the provided Excel sheets.
2️⃣ Open Power BI File – The visuals automatically update once Power BI reads the Excel source.
3️⃣ Filter by Month or KPI Group – Use slicers to focus on specific periods or performance categories.
4️⃣ Analyze Trends – Review trend charts for MTD and YTD metrics across months.
5️⃣ Drill Through to Definitions – Right-click any KPI to understand its logic and measurement formula.
6️⃣ Share with Stakeholders – Publish it on Power BI Service for interactive sharing with your team.
💡 No coding or technical skills required — just update the data and let Power BI handle the rest.
👥 Who Can Benefit from This Procurement Efficiency KPI Dashboard
💼 Procurement Managers – Track cycle times, cost savings, and supplier performance at a glance.
🏢 Operations Leaders – Monitor efficiency and compliance metrics to streamline purchasing workflows.
📊 Finance Teams – Gain transparency into procurement spending and performance trends.
🏗️ Manufacturing & Supply Chain Professionals – Optimize vendor relationships and reduce bottlenecks.
🏛️ Government & Public Sector Procurement Units – Ensure transparency and efficiency in sourcing operations.
No matter your industry, this dashboard provides actionable insights that drive smarter procurement strategies and sustainable results. 🌟


Reviews
There are no reviews yet.