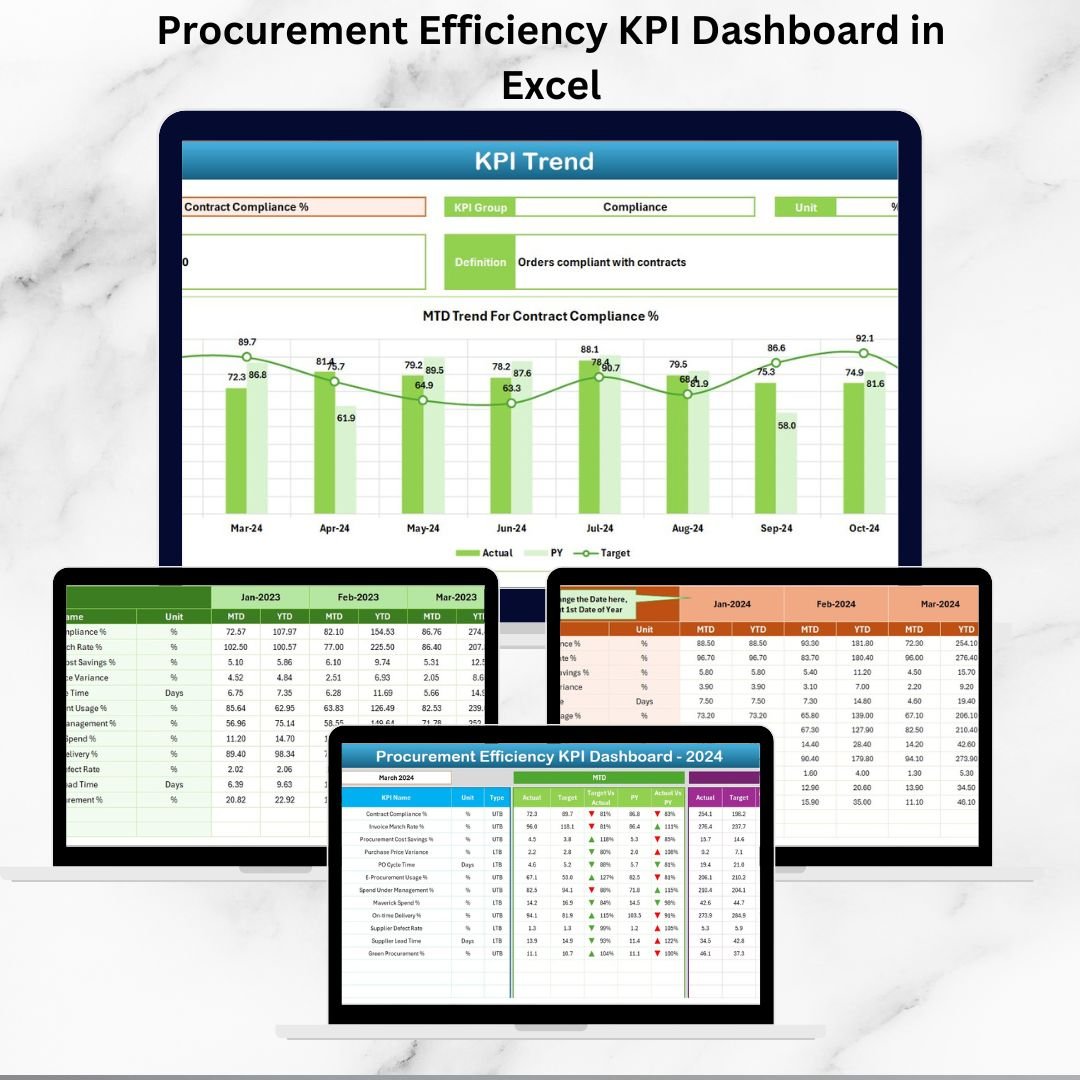


Managing procurement efficiently is no longer optional—it’s a must-have strategy for any business that wants to thrive in today’s competitive landscape. Every delay, cost overrun, or compliance issue can hurt profitability. That’s why we’ve created the Procurement Efficiency KPI Dashboard in Excel—a ready-to-use tool designed to transform the way organizations manage procurement performance.Procurement Efficiency KPI Dashboard in Excel
With this powerful dashboard, you can say goodbye to scattered spreadsheets and hello to a centralized, interactive platform that tracks all your procurement Key Performance Indicators (KPIs) in real time. Let’s dive into why this tool is a game changer.
🔑 Key Features of Procurement Efficiency KPI Dashboard
-
📊 Centralized Reporting – All procurement KPIs such as cost savings, cycle time, compliance, and supplier performance in one place.Procurement Efficiency KPI Dashboard in Excel
-
📈 Real-Time Analysis – MTD (Month-to-Date) and YTD (Year-to-Date) progress available instantly with slicers and drop-downs.
-
⚡ Smart Visuals – Conditional formatting with up/down arrows makes trends and performance gaps crystal clear.
-
🖱️ User-Friendly Navigation – Dedicated Home page with quick-access buttons for smooth movement across sheets.
-
📑 Structured KPI Definitions – Includes KPI names, formulas, units, and definitions to maintain standard reporting.
-
🔄 Historical Comparisons – Track and compare your performance against targets and previous year data effortlessly.
-
✅ Automation & Accuracy – Prebuilt formulas eliminate manual calculations, saving time and reducing errors.
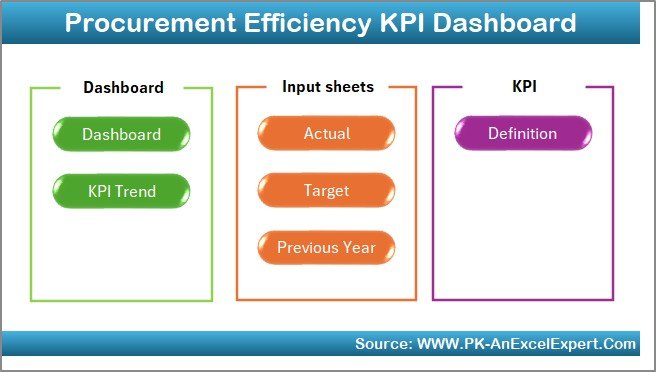
📂 What’s Inside the Procurement Efficiency KPI Dashboard
This dashboard comes with 7 pre-structured worksheet tabs designed for maximum efficiency:
-
🏠 Home Sheet – A simple index with six navigation buttons for quick access.
-
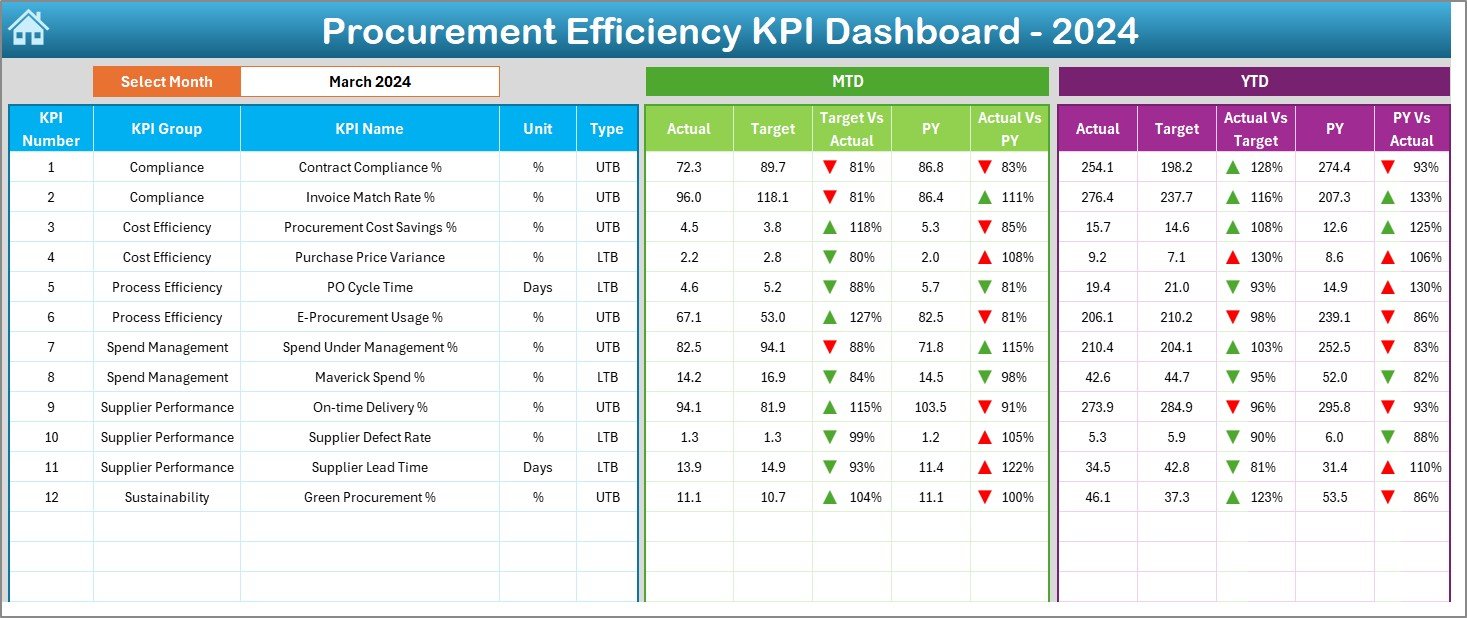
📊 Dashboard Sheet – The main hub showing MTD/YTD actuals, targets, and previous year comparisons with smart indicators.
-
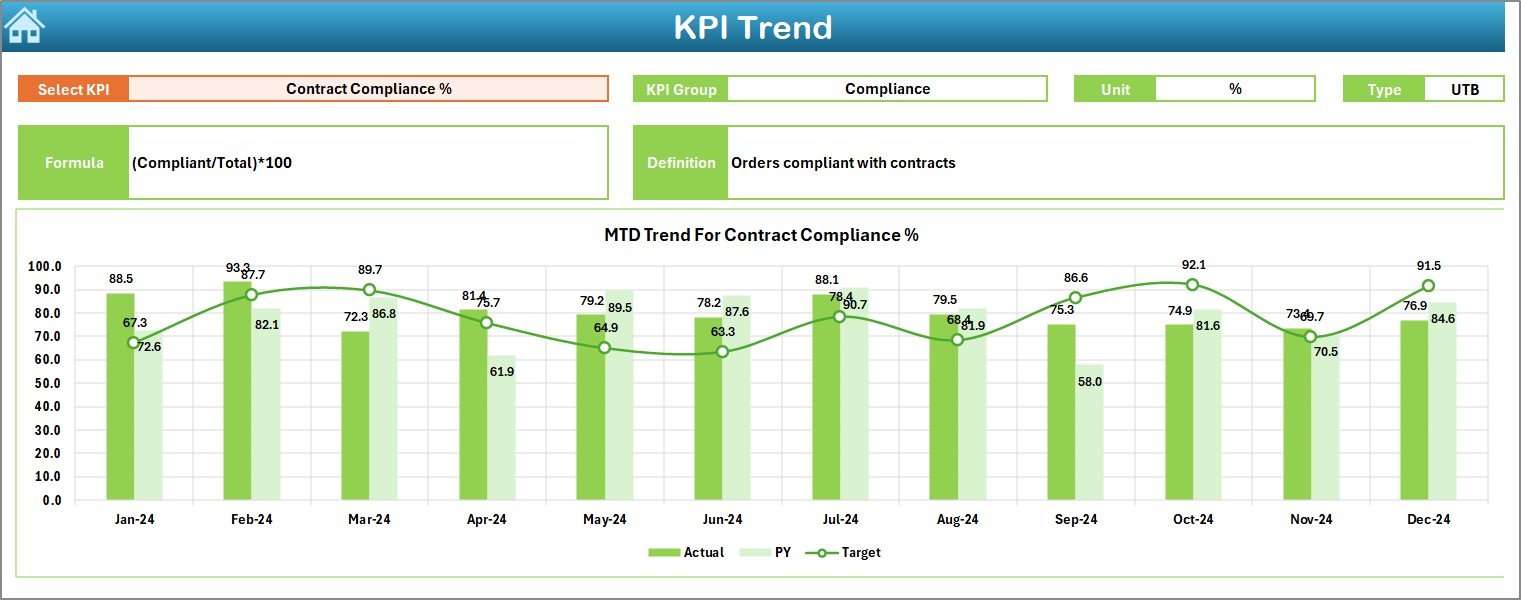
📈 KPI Trend Sheet – Select a KPI from a drop-down and view its group, unit, type, formula, definition, and trend charts.
-
✍️ Actual Numbers Input Sheet – Input actual procurement performance numbers with month selectors for accuracy.
-
🎯 Target Sheet – Define MTD and YTD targets for clear goal-setting.Procurement Efficiency KPI Dashboard in Excel
-
📅 Previous Year Sheet – Store and compare historical performance to evaluate progress.
-
📖 KPI Definition Sheet – A master sheet with all KPI details for easy reference and consistency.
🛠️ How to Use the Procurement Efficiency KPI Dashboard
-
Enter Actuals – Go to the “Actual Numbers Input” sheet and fill in monthly performance values.
-
Set Targets – Update the “Target Sheet” with monthly and yearly goals.
-
Review KPIs – Open the “Dashboard Sheet” to analyze MTD/YTD actuals versus targets and PY (Previous Year).
-
Track Trends – Use the “KPI Trend Sheet” to see performance graphs over time.
-
Analyze & Act – Identify supplier inefficiencies, cost variances, or compliance gaps and make data-driven decisions.
You don’t need advanced Excel knowledge—the dashboard is designed to be plug-and-play with clear instructions, drop-downs, and slicers.
👥 Who Can Benefit from This Procurement Efficiency KPI Dashboard
-
🏢 Corporate Procurement Teams – Track supplier contracts, cycle times, and compliance performance.
-
🏭 Manufacturing Units – Monitor raw material procurement, vendor reliability, and cost efficiency.
-
🛒 Retail Businesses – Manage vendor performance, delivery times, and cost-saving initiatives.
-
🏥 Healthcare Providers – Track medical supply procurement, supplier compliance, and expenses.
-
🏛️ Public Sector Organizations – Ensure policy compliance and efficient budget allocations.
-
📈 Small to Large Enterprises – Scalable for businesses of any size to streamline procurement monitoring.
Click here to read the Detailed blog post
Watch the step-by-step video tutorial:
Visit our YouTube channel to learn step-by-step video tutorials.


Reviews
There are no reviews yet.