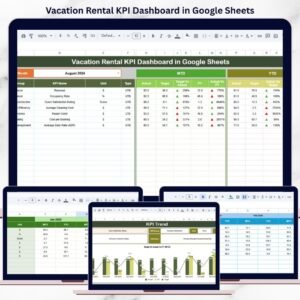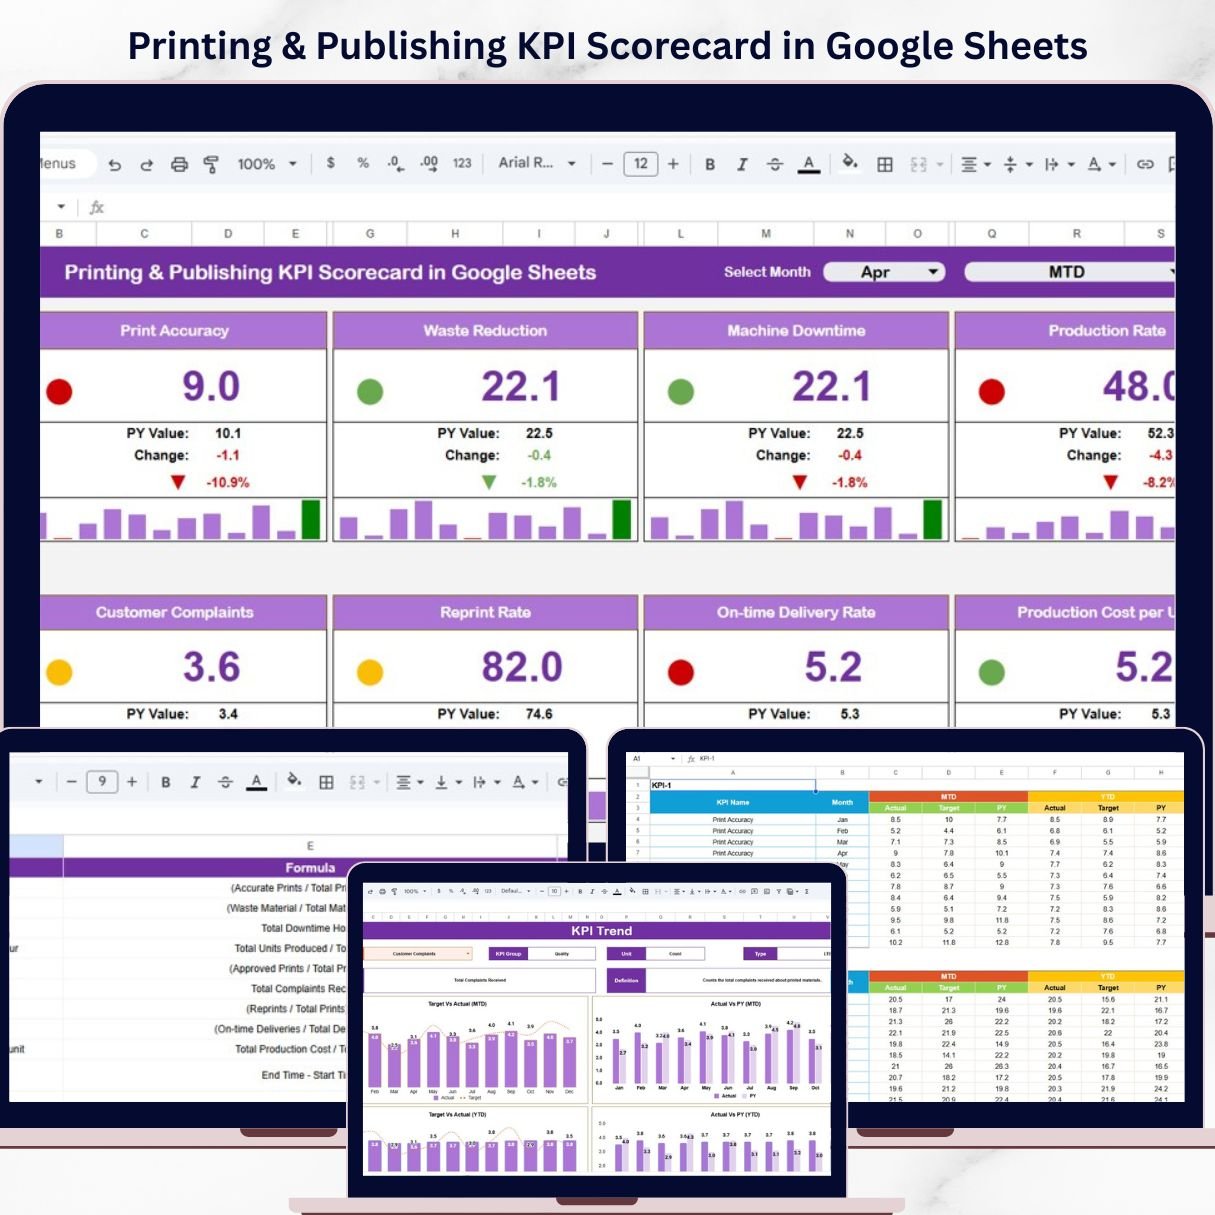
Introducing the Printing & Publishing KPI Scorecard in Google Sheets — a powerful, ready-to-use tool designed to help you track key performance indicators, monitor trends, and make smarter business decisions—all in one place.
In today’s competitive printing and publishing industry, performance tracking is critical. However, when your data is scattered across multiple sheets, it becomes confusing and time-consuming to analyze.
That’s where this smart KPI scorecard comes in! 🚀
It transforms complex data into clear, visual insights using dynamic dashboards, traffic light indicators, and trend analysis. Moreover, it includes KPI definitions, formulas, and performance types like Lower the Better or Upper the Better, making it a complete performance management solution.
✨ Key Features of Printing & Publishing KPI Scorecard in Google Sheets
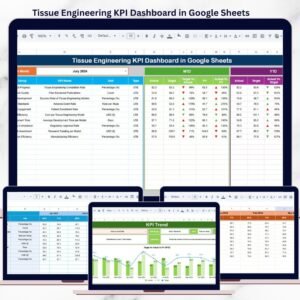
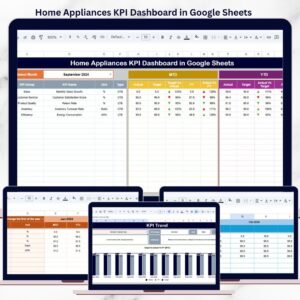
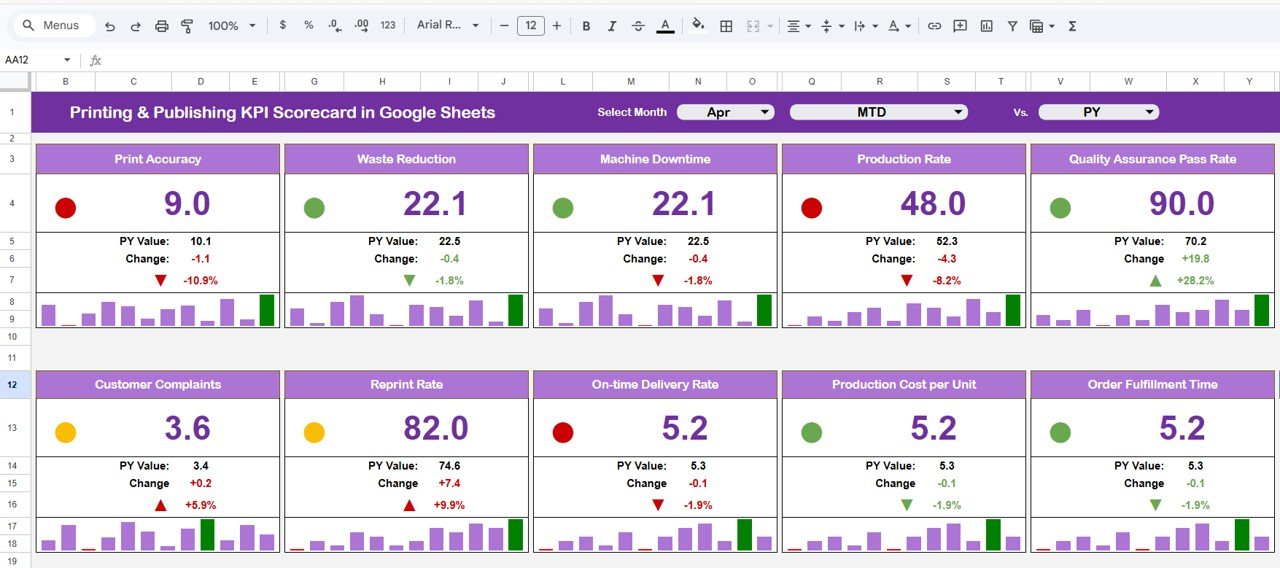
📊 Central KPI Dashboard
Track up to 10 KPIs in one place with a clean and interactive layout.
📅 Dynamic Month Selector
Instantly update all KPIs based on the selected month.
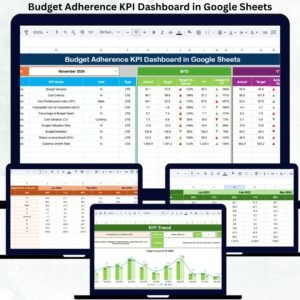
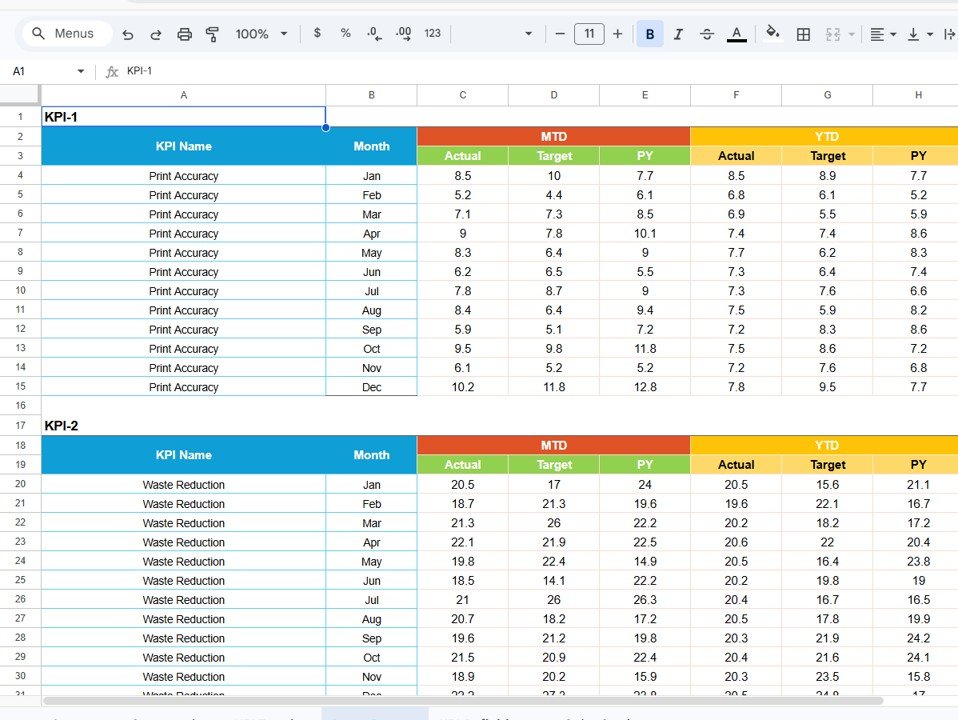
🎯 MTD & YTD Analysis
Compare Month-to-Date and Year-to-Date performance easily.
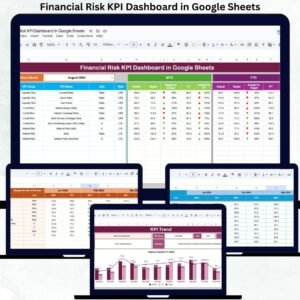
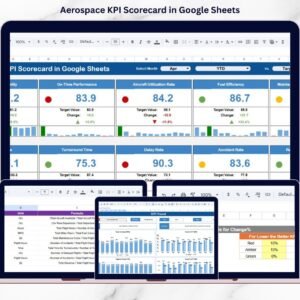
🚦 Traffic Light Indicators
Quickly identify performance status with Green, Yellow, and Red signals.
🔺 Trend Indicators (Up/Down Arrows)
Visualize KPI performance changes instantly.
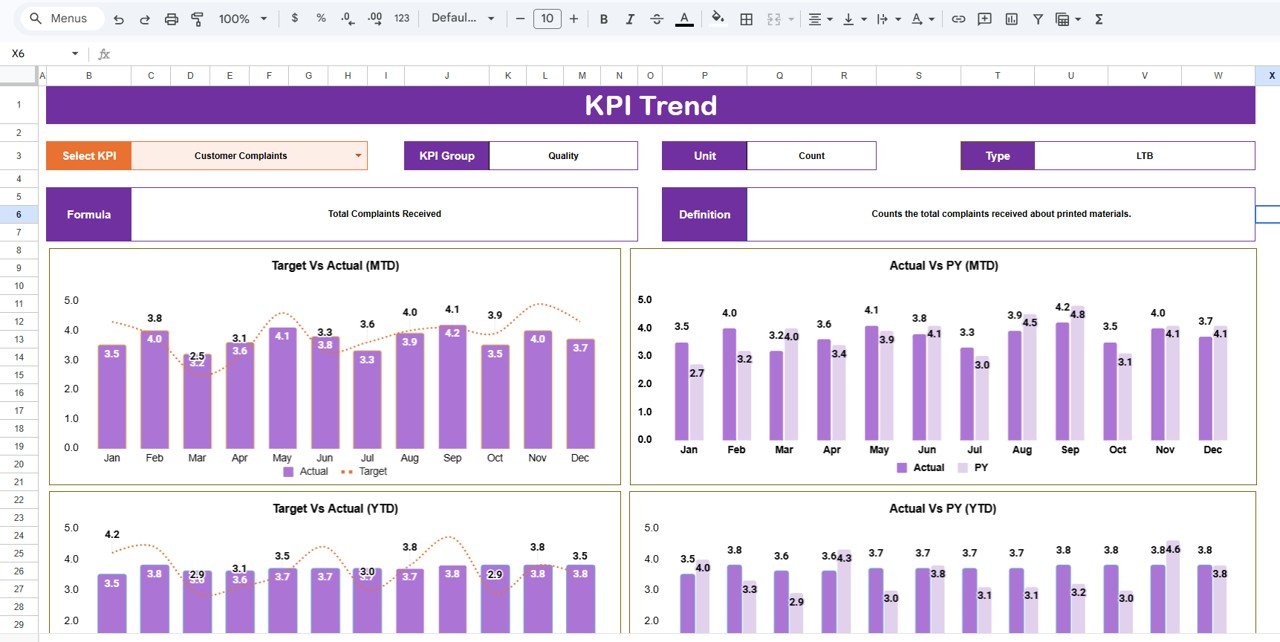
📈 Detailed KPI Trend Analysis
Analyze individual KPIs with complete context including formulas and definitions.
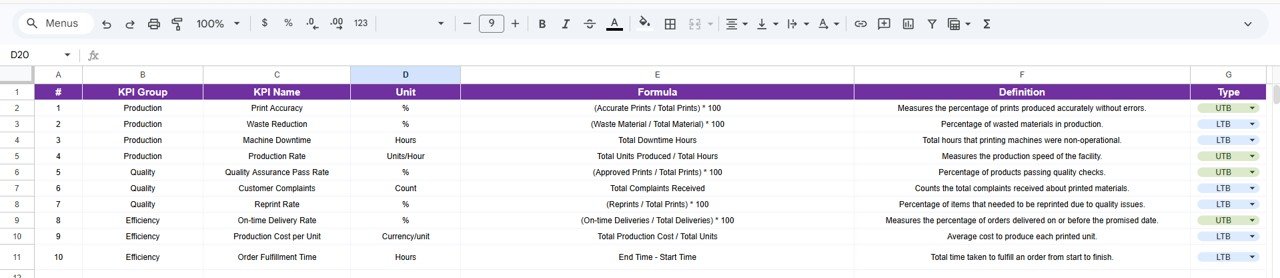
🧠 KPI Documentation Included
Standardize KPI tracking with detailed definitions and calculations.
⚡ Interactive & User-Friendly Design
Simple inputs, dropdowns, and automated calculations make it easy to use.
📂 What’s Inside the Printing & Publishing KPI Scorecard in Google Sheets
📌 KPI Scorecard Dashboard
Main performance view with KPIs, traffic lights, and trend indicators.
📌 MTD & YTD Analysis Section
Switch between monthly and yearly performance views.
📌 KPI Trend Sheet
Detailed KPI insights with dropdown-based selection and analysis.
📌 KPI Definition Sheet
Central repository of KPI names, formulas, units, and definitions.
📌 Data Input Sheet
Enter monthly KPI data (MTD & YTD) for automatic updates.
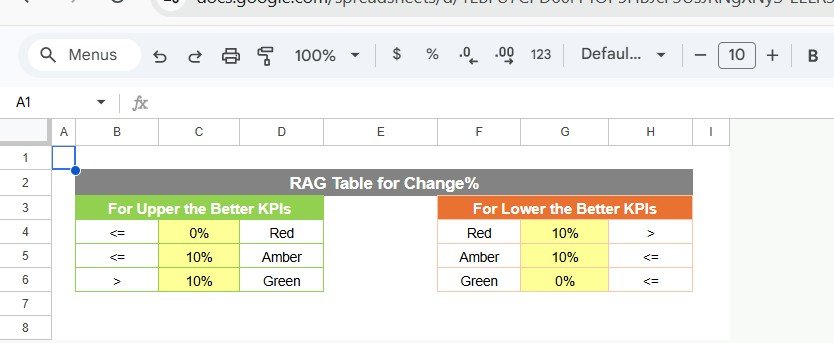
📌 Color Settings Sheet
Customize KPI thresholds and traffic light indicators.
🛠️ How to Use the Printing & Publishing KPI Scorecard in Google Sheets
Using this scorecard is simple and efficient! 💡
1️⃣ Enter KPI Data
Input monthly KPI values in the data sheet.
2️⃣ Set KPI Targets
Define performance thresholds and targets.
3️⃣ Select Month
Choose the month from the dropdown.
4️⃣ Analyze Dashboard
Review traffic lights, arrows, and KPI values.
5️⃣ Identify Gaps
Spot underperforming areas instantly.
6️⃣ Take Action
Improve operations and boost efficiency.
👥 Who Can Benefit from This Printing & Publishing KPI Scorecard in Google Sheets
🖨️ Printing Companies – Monitor production and operational performance
📚 Publishing Houses – Track KPIs and improve efficiency
📊 Operations Managers – Identify bottlenecks and optimize workflows
🏢 Business Owners – Make data-driven decisions
📈 Data Analysts – Analyze trends and generate insights
💡 Why This KPI Scorecard is a Must-Have?
✔ Track KPIs in real time
✔ Improve performance visibility
✔ Reduce manual reporting
✔ Identify inefficiencies quickly
✔ Make faster, data-driven decisions
👉 If you want to optimize your printing and publishing operations, this KPI scorecard is your ultimate solution!