In the competitive world of printing and publishing, success depends on how well you manage performance across every stage — from prepress and printing to distribution and sales. The Printing and Publishing KPI Scorecard in Excel 📊 is your ultimate performance tracking solution — a ready-to-use, fully automated Excel template that helps you monitor key business metrics with precision, simplicity, and insight.
With this interactive scorecard, you can visualize data, identify bottlenecks, and make smart decisions that drive productivity, quality, and profitability. Whether you run a print house, a digital publishing agency, or a magazine company, this Excel-based tool keeps all your performance indicators organized and actionable.
✨ Key Features of Printing and Publishing KPI Scorecard in Excel
✅ Interactive Dashboard: Switch effortlessly between Month-to-Date (MTD) and Year-to-Date (YTD) views to track trends and performance.
✅ Dynamic Dropdown Menus: Choose any month or KPI for instant insights — no formulas to edit manually!
✅ Actual vs Target Analysis: Instantly compare your real-time results with set goals to identify performance gaps.
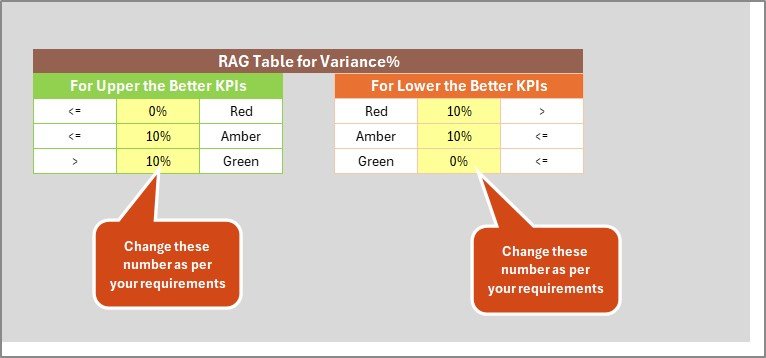
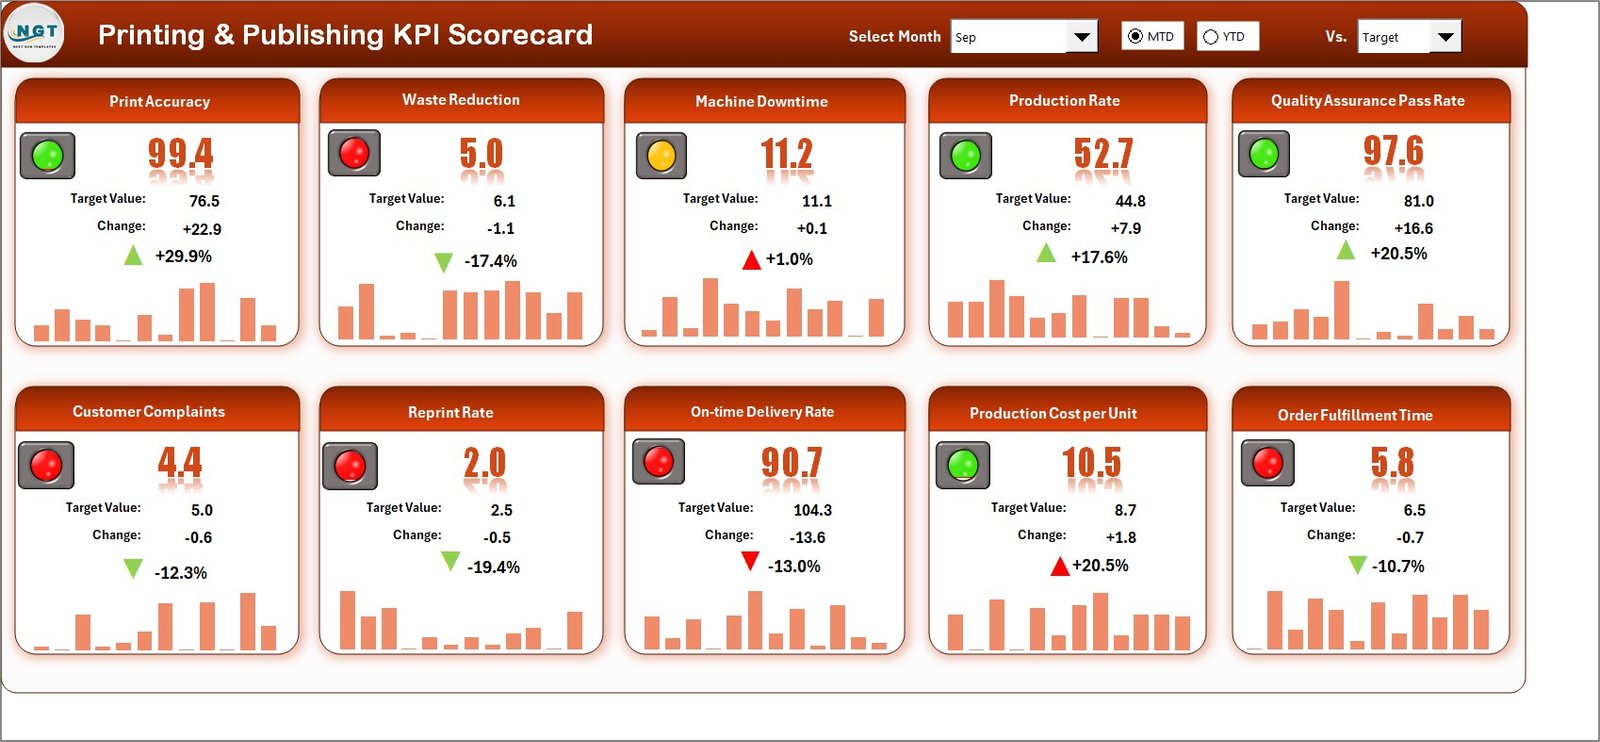
✅ Visual Indicators: Color-coded cells (🔴🟡🟢) highlight performance status for faster decision-making.
✅ Data-Driven Accuracy: Automated formulas ensure reliable calculations with zero manual effort.
✅ Compact & Professional Design: Clean layout displaying all critical KPIs on one screen.
✅ Fully Editable & Scalable: Add, delete, or modify KPIs as per your business operations.
✅ No Technical Expertise Needed: Simple Excel interface — perfect for non-technical users.
This template transforms complex performance tracking into a one-click process that’s visual, efficient, and business-ready.
📂 What’s Inside the Printing and Publishing KPI Scorecard in Excel
This Excel file comes with four powerful worksheet tabs; each designed for a specific purpose:
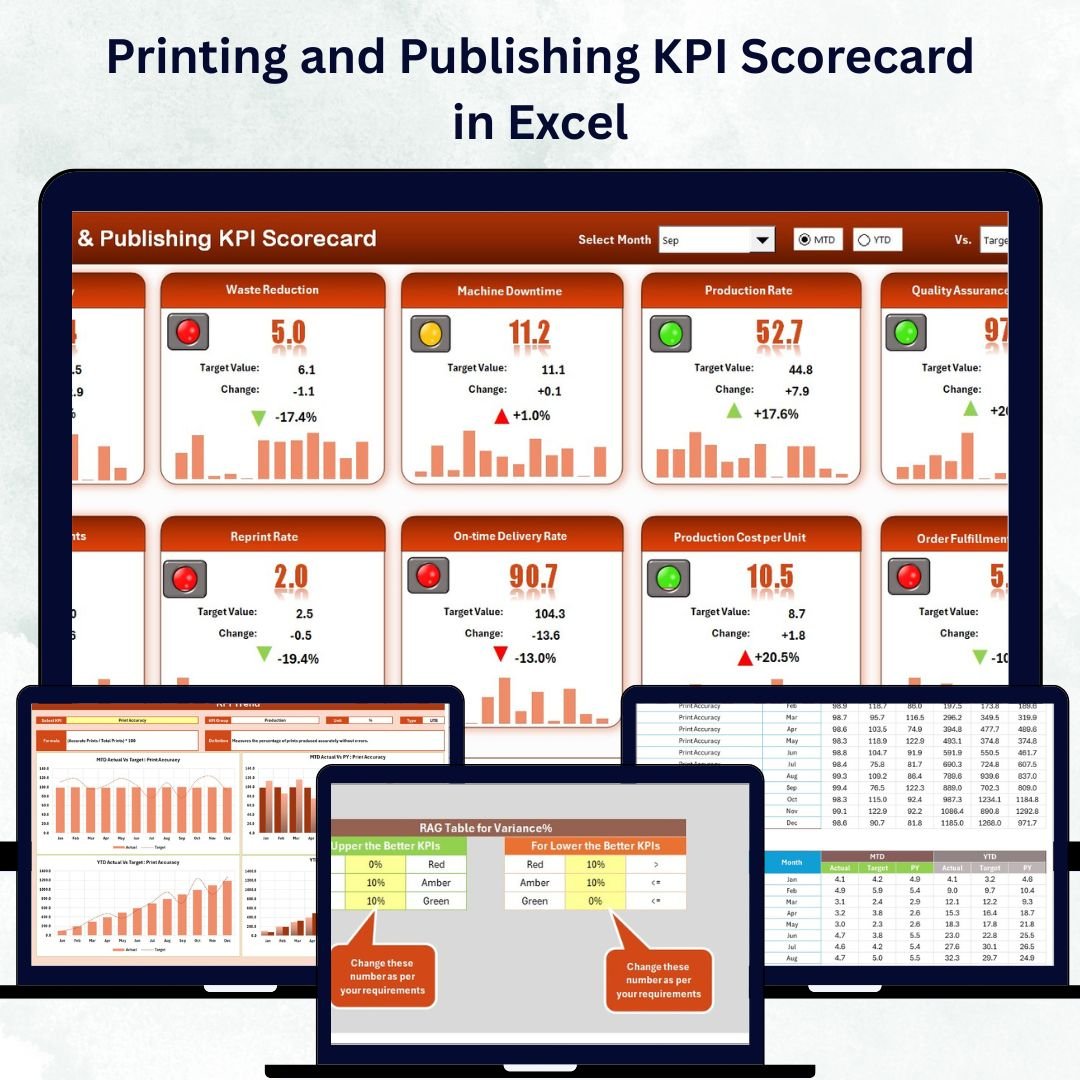
1️⃣ Scorecard Sheet — Your main performance dashboard showing actual vs target KPIs for selected months and timeframes.
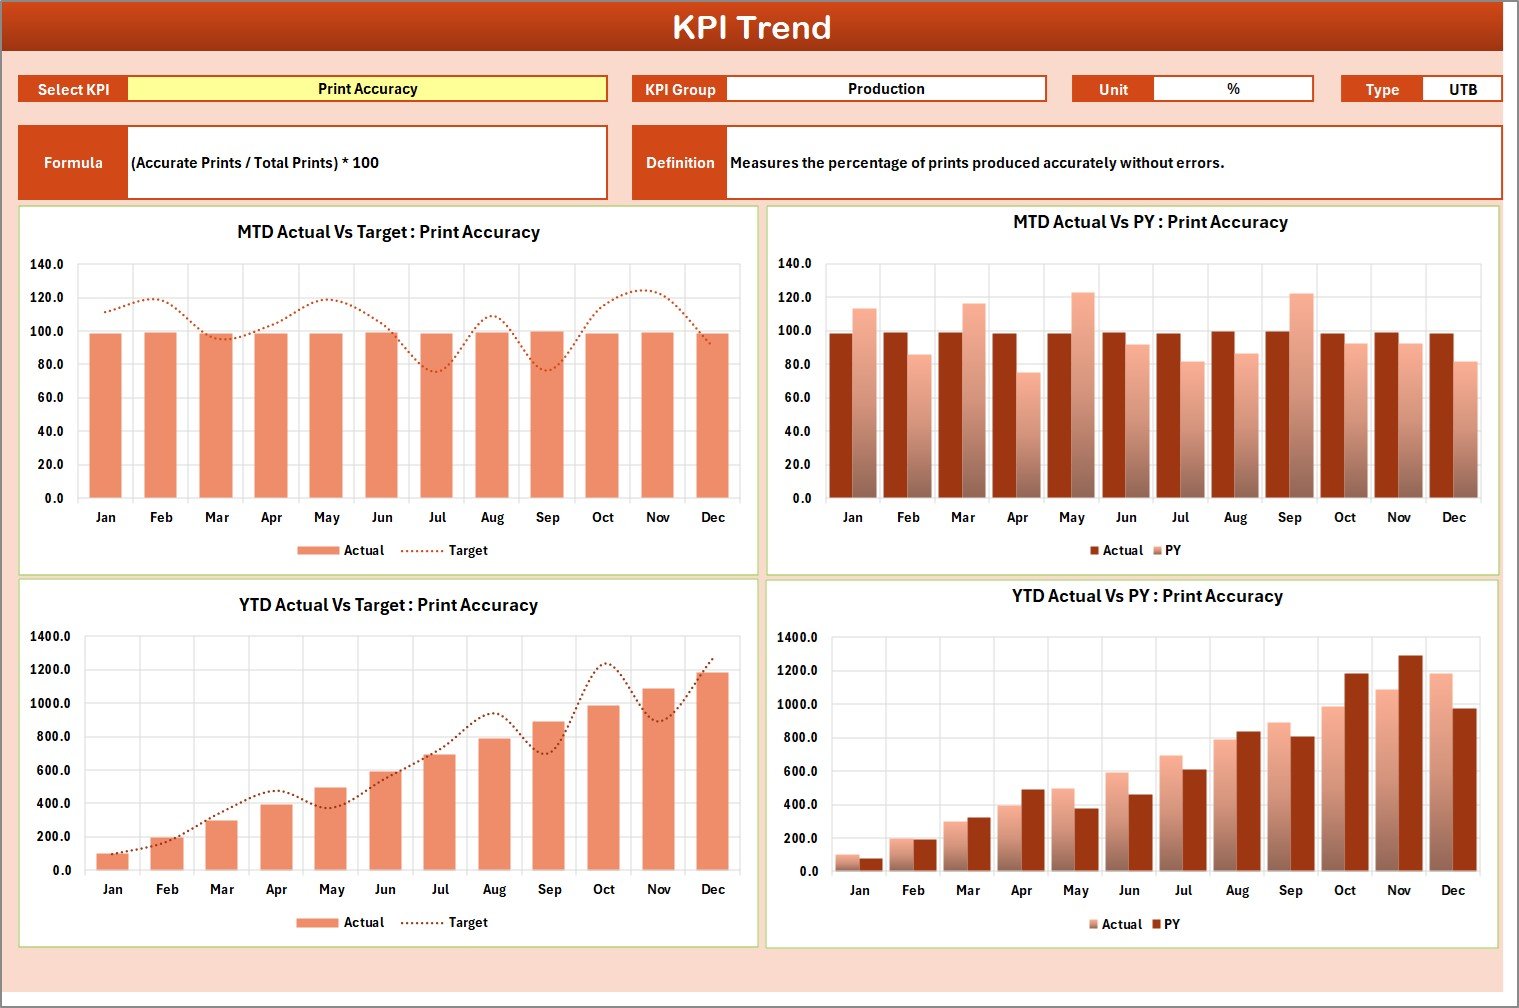
2️⃣ KPI Trend Sheet — Visual trend tracker where you can analyze KPI performance over time using charts for Actual, Target, and Previous Year (PY) comparisons.
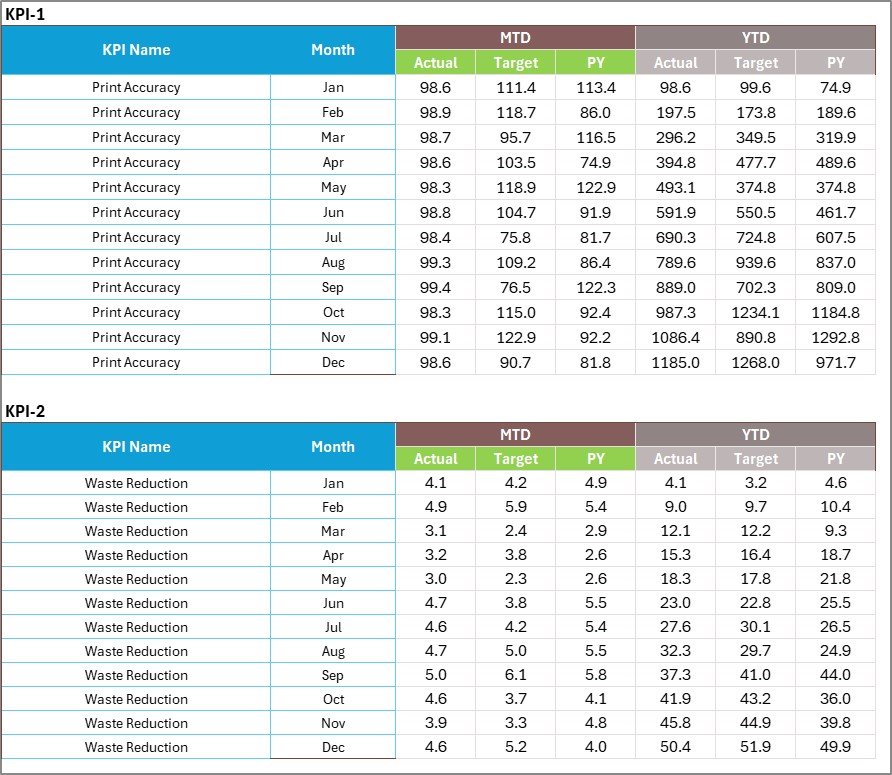
3️⃣ Input Data Sheet — The heart of your scorecard! Here you’ll input monthly actuals, targets, and PY values — all automatically reflected in the dashboard.
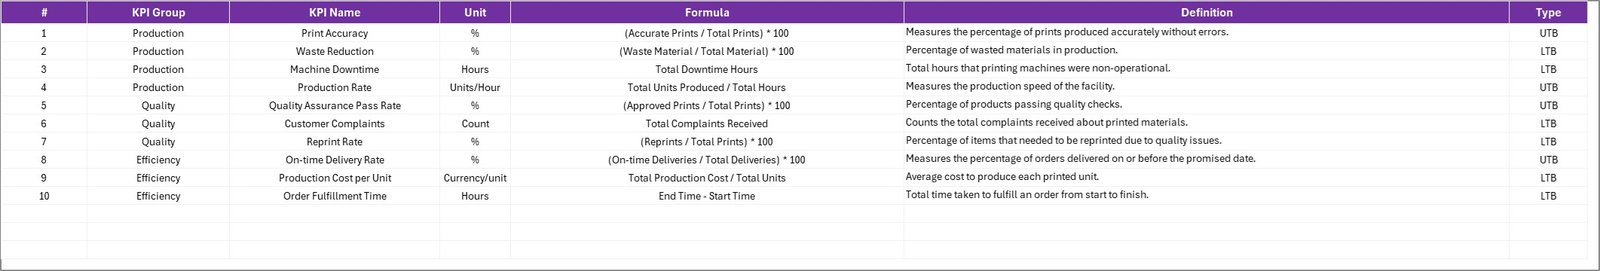
4️⃣ KPI Definition Sheet — A reference tab containing KPI Names, Groups, Units, Types, and Formulas for complete transparency and clarity.
Every section works together seamlessly, giving you a holistic and interactive performance tracking system for your printing and publishing operations.
🧭 How to Use the Printing and Publishing KPI Scorecard in Excel
🚀 Step 1: Open the Excel template and go to the Input Data sheet.
📝 Step 2: Enter your actual, target, and previous year values for each KPI.
📊 Step 3: Go to the Scorecard sheet to view MTD and YTD comparisons automatically.
📈 Step 4: Use the KPI Trend sheet to analyze progress over time.
📚 Step 5: Modify KPI names, definitions, or formulas in the KPI Definition sheet to match your organization’s structure.
That’s it! The dashboard updates instantly, letting you analyze results and share insights across your team.
👥 Who Can Benefit from This Printing and Publishing KPI Scorecard
🎯 Print House Owners: Monitor print runs, turnaround times, and cost efficiency.
📚 Publishing Managers: Track editorial performance, advertising revenue, and publication timelines.
📈 Finance Teams: Review profitability, cost per publication, and revenue growth.
🧑💼 Operations Heads: Evaluate downtime, efficiency, and resource utilization.
💡 Marketing Teams: Measure campaign success and sales trends.
📊 Business Analysts: Get a consolidated data view for reporting and forecasting.
Whether you’re managing offset printing, digital publishing, or print media, this KPI scorecard provides actionable insights that help you optimize operations and boost your bottom line.
🔗 Click here to read the Detailed Blog Post
🎥 Visit our YouTube channel to learn step-by-step video tutorials
👉 YouTube.com/@PKAnExcelExpert


Reviews
There are no reviews yet.