
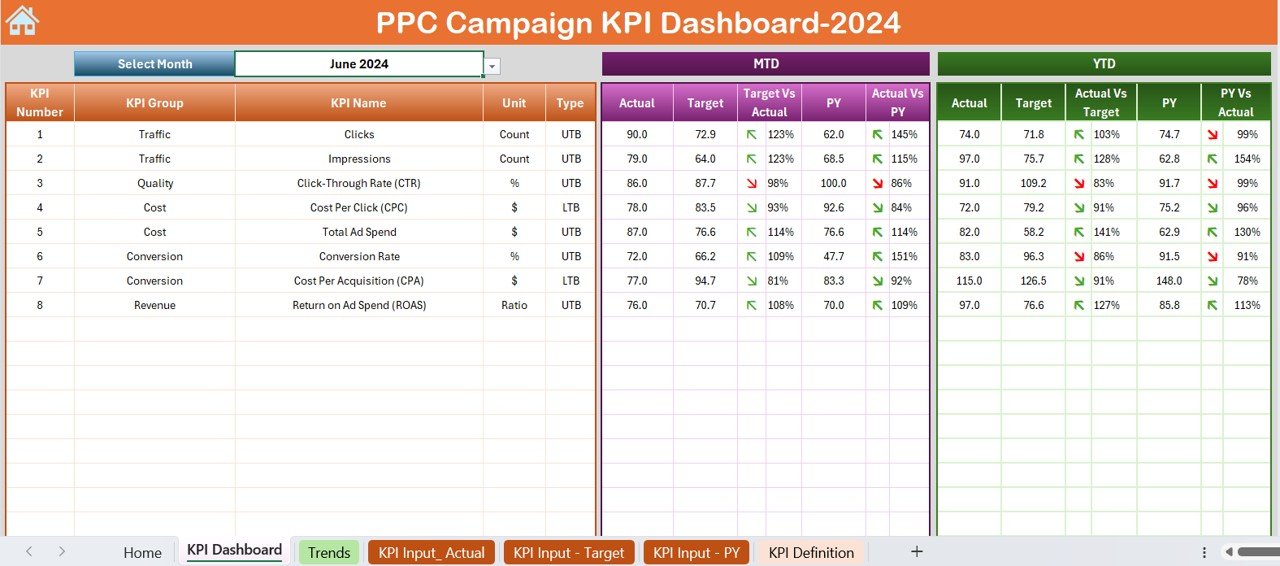
The PPC Campaign KPI Dashboard in Excel is an essential tool for digital marketers looking to track, analyze, and optimize their pay-per-click (PPC) advertising campaigns. This Excel-based dashboard allows you to monitor key performance indicators (KPIs) such as impressions, click-through rates (CTR), cost-per-click (CPC), conversion rates, and ROI, providing you with detailed insights into the effectiveness of your PPC ads.
With real-time tracking and customizable reports, this dashboard helps you measure campaign performance across different platforms, optimize ad spend, and improve conversion rates, ensuring that your PPC campaigns are cost-effective and yield a positive return on investment (ROI).
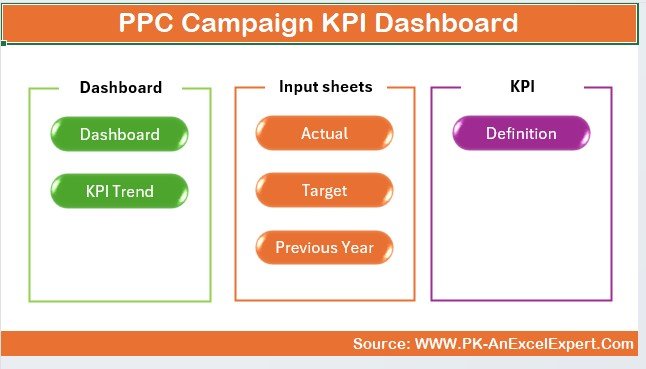
Key Features of the PPC Campaign KPI Dashboard in Excel:
📊 Comprehensive PPC Performance Tracking
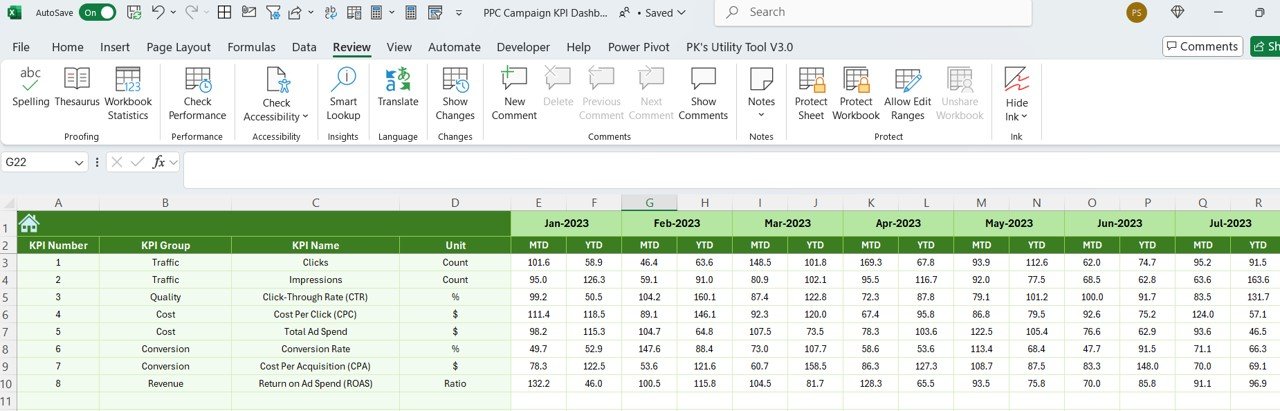
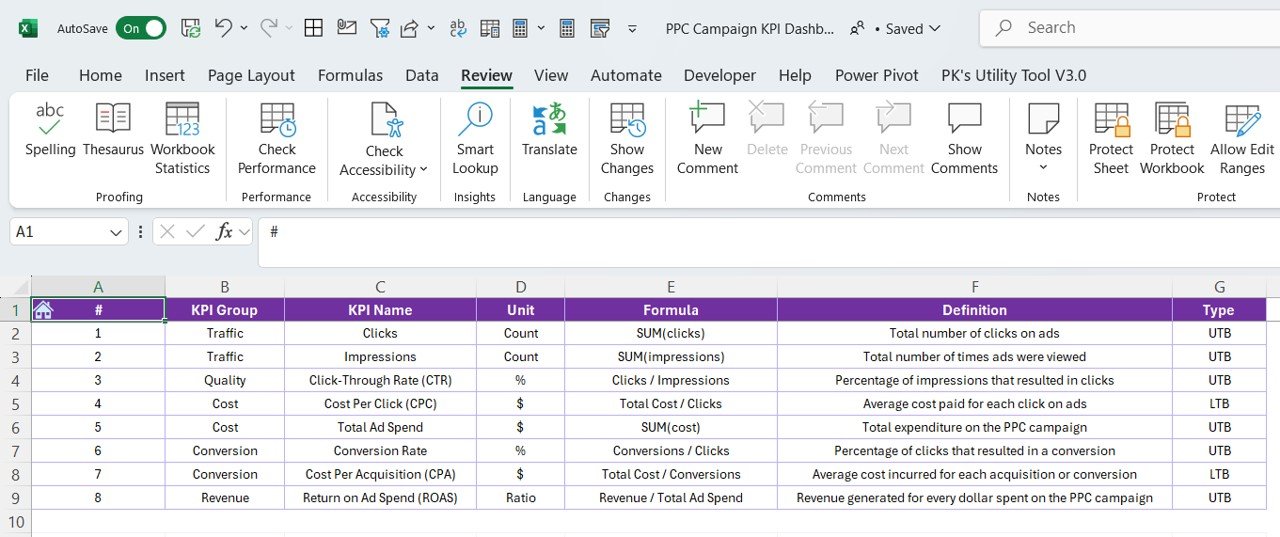
Track key metrics like impressions, clicks, CTR, CPC, and conversions, to evaluate the performance of your PPC ads in one central location.
💸 Cost and Budget Tracking
Monitor your ad spend, cost-per-click, and total cost, ensuring you stay within your campaign budget while maximizing performance.
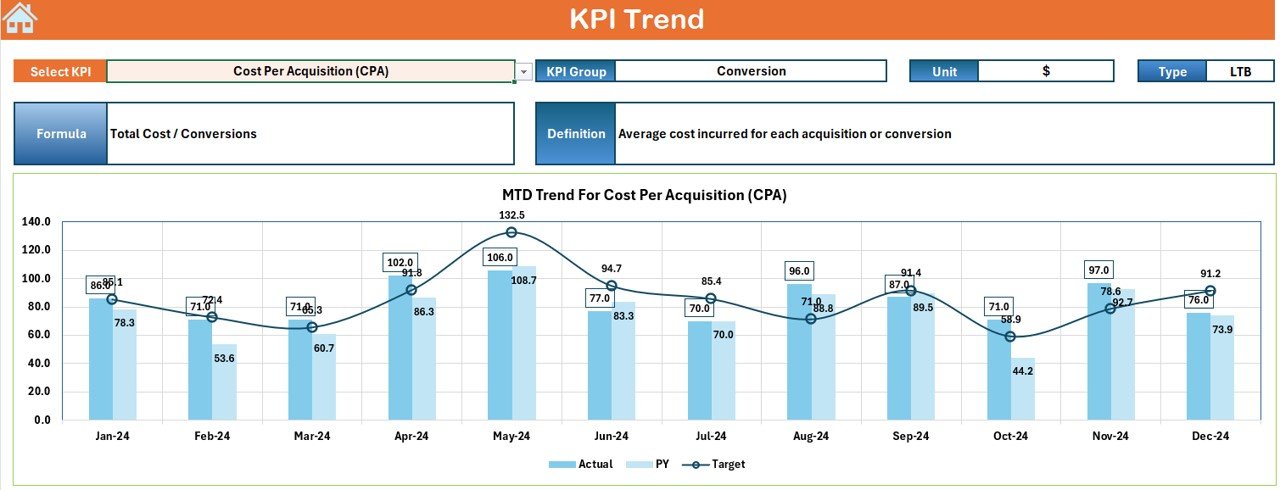
📈 Conversion Rate and ROI Monitoring
Analyze conversion rates and calculate the ROI of your PPC campaigns to assess the effectiveness of your advertising spend.
🔄 Platform Comparison
Compare performance across different platforms (Google Ads, Facebook Ads, Bing Ads, etc.) to understand which channels are driving the best results.
📊 Customizable Reports and Visual Analytics
Use interactive charts, graphs, and tables to visualize your campaign data and generate detailed reports for stakeholders or clients.
🚀 Why You’ll Love the PPC Campaign KPI Dashboard in Excel:
✅ Optimize Ad Spend – Track CPC, impressions, and clicks to ensure your budget is being used effectively for maximum return.
✅ Track Campaign Effectiveness – Monitor key metrics such as conversion rates and ROI to see which ads and keywords are performing best.
✅ Compare Across Platforms – Compare PPC campaign performance across different platforms to identify which channels are delivering the highest ROI.
✅ Boost Conversion Rates – Use the insights to adjust your campaigns and improve conversion rates, ultimately leading to higher sales and leads.
✅ Data-Driven Decisions – Make informed decisions based on real-time data to refine and optimize your PPC advertising strategies.
✅ Customizable and Flexible – Tailor the dashboard to fit the specific needs of your PPC campaigns, whether you’re managing a small budget or large-scale ad campaigns.
What’s Inside the PPC Campaign KPI Dashboard in Excel:
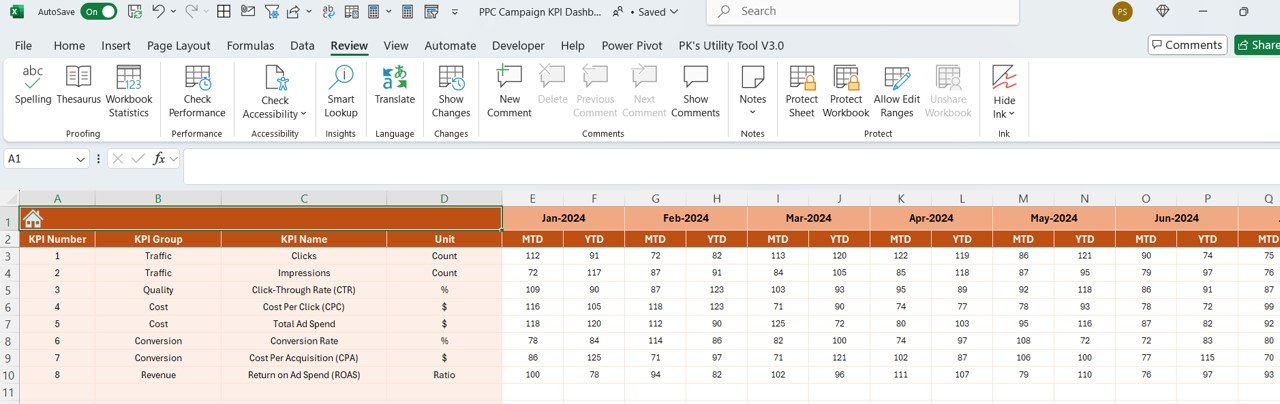
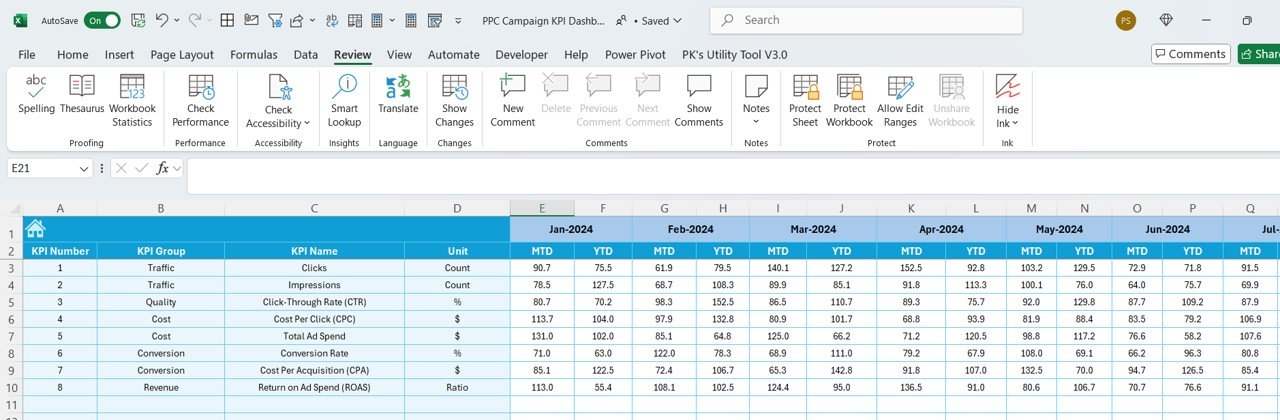
- Impressions and Clicks Tracking: Monitor the number of impressions and clicks to evaluate ad visibility and engagement.
- CTR and CPC Analysis: Track CTR and CPC to measure ad performance and optimize click costs.
- Conversion Rate and ROI: Analyze conversions and calculate ROI to assess the effectiveness of your PPC ads.
- Platform Comparison: Compare results across different PPC platforms (Google Ads, Facebook, etc.) to determine which are the most effective.
- Cost and Budget Tracking: Track your total spend, cost-per-click, and compare it against your budget to stay on target.
- Custom Reports: Create customized reports with interactive charts and tables to visualize campaign performance and share insights with stakeholders.
How to Use the PPC Campaign KPI Dashboard in Excel:
1️⃣ Download the Template – Instantly access your Excel file upon purchase.
2️⃣ Input Campaign Data – Enter your PPC ad data, including impressions, clicks, cost, conversions, and budget details into the dashboard.
3️⃣ Monitor Campaign Metrics – Track the performance of your PPC campaigns in real-time and evaluate metrics like CTR, CPC, and conversion rates.
4️⃣ Analyze and Optimize – Use the data to identify trends, optimize your ads, and make data-driven decisions to improve ROI.
5️⃣ Generate Reports – Create customized reports to visualize PPC campaign results, ideal for meetings with clients, stakeholders, or marketing teams.
Who Can Benefit from the PPC Campaign KPI Dashboard in Excel:
- Digital Marketers
- PPC Campaign Managers
- E-commerce Businesses
- Marketing Agencies
- Business Owners
- SEM (Search Engine Marketing) Professionals
- Advertising Analysts
The PPC Campaign KPI Dashboard in Excel is an invaluable tool for anyone managing or overseeing PPC advertising campaigns. It simplifies the tracking of key performance metrics, ensuring that you can optimize your ad spend, improve campaign results, and drive a higher ROI.
Click here to read the Detailed blog post
https://www.pk-anexcelexpert.com/ppc-campaign-kpi-dashboard-in-excel/
Visit our YouTube channel to learn step-by-step video tutorials
Youtube.com/@PKAnExcelExpert


Reviews
There are no reviews yet.