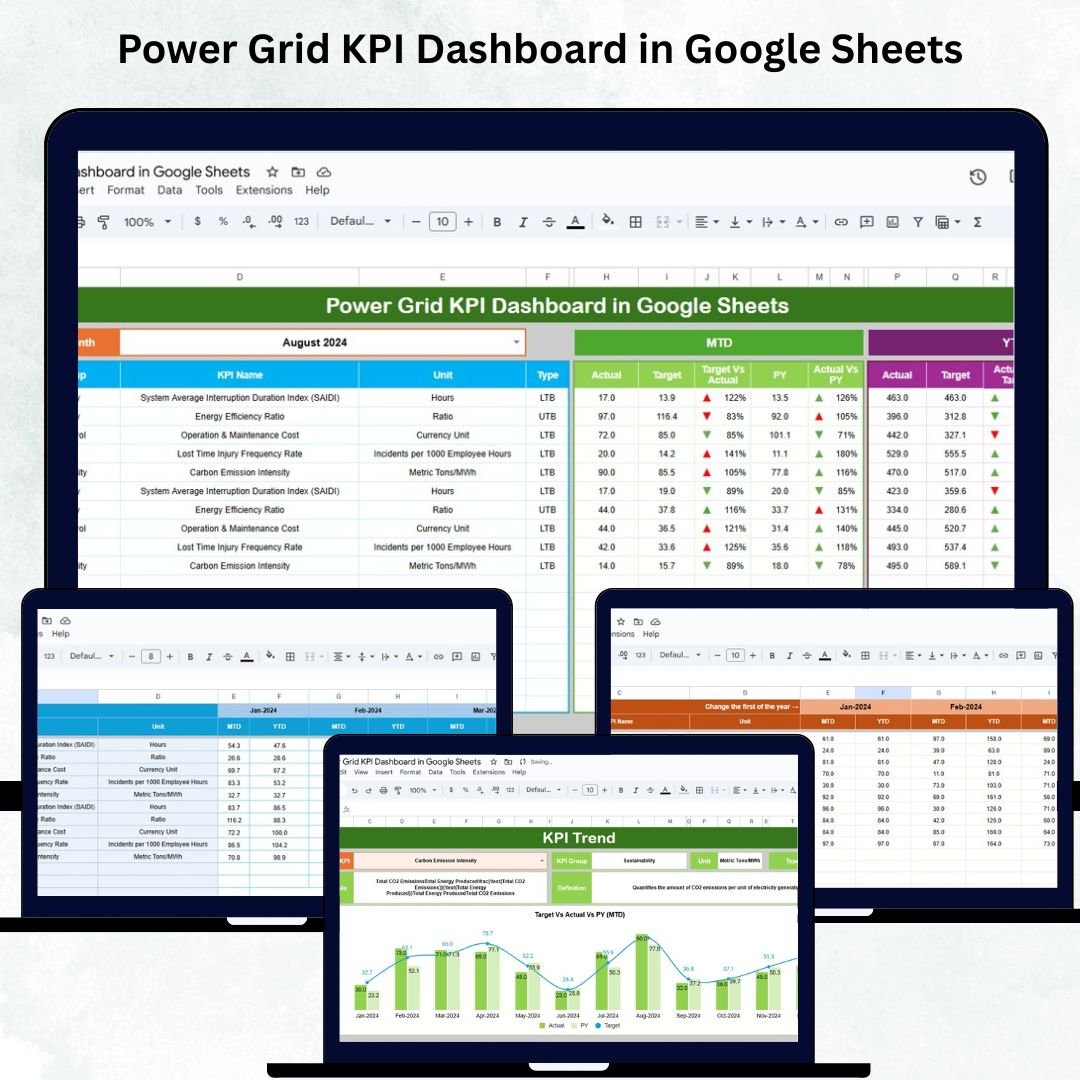
Power grid operations demand unmatched reliability, precise monitoring, and fast decision-making. From transmission efficiency to outage duration, every metric plays a critical role in ensuring uninterrupted power supply. The Power Grid KPI Dashboard in Google Sheets is a professional, automated, and ready-to-use performance monitoring system designed for grid operators, transmission companies, and energy regulators who want complete visibility across their network.
With automated MTD/YTD comparisons, real-time target tracking, and KPI trend analytics, this dashboard helps energy teams reduce outages, improve reliability, optimize asset performance, and comply with regulatory guidelines — all inside a simple Google Sheets file with zero coding required.
⚡ Key Features of Power Grid KPI Dashboard in Google Sheets
Track your grid performance with precision. This dashboard turns raw grid data into smart visual insights that highlight risks, pinpoint inefficiencies, and support rapid decision-making.
🔍 What’s Inside the Power Grid KPI Dashboard
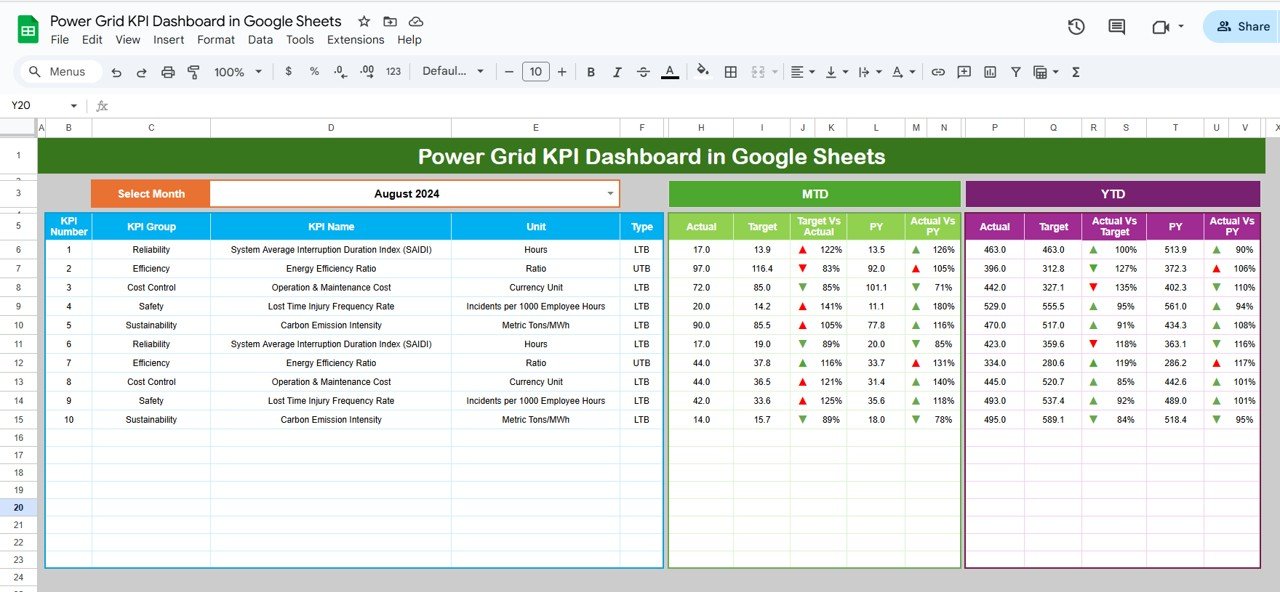
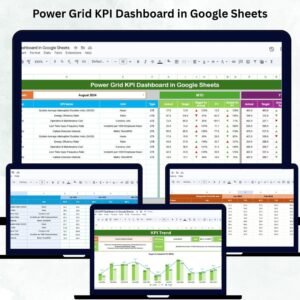
🟩 Dashboard Sheet Tab – Real-Time Performance View
This is your primary analysis page where all KPIs are visualized based on the selected month (Cell D3).
For every KPI, you can instantly compare:
-
MTD Actual vs Target vs Previous Year
-
YTD Actual vs Target vs Previous Year
Smart Conditional Formatting:
⬆ Green Arrow → Performance Improved
⬇ Red Arrow → Performance Declined
🟡 Indicator Colors → On-track, Near Target, or Below Target
This sheet gives grid managers a quick, actionable overview of system reliability, outage events, losses, and asset performance.
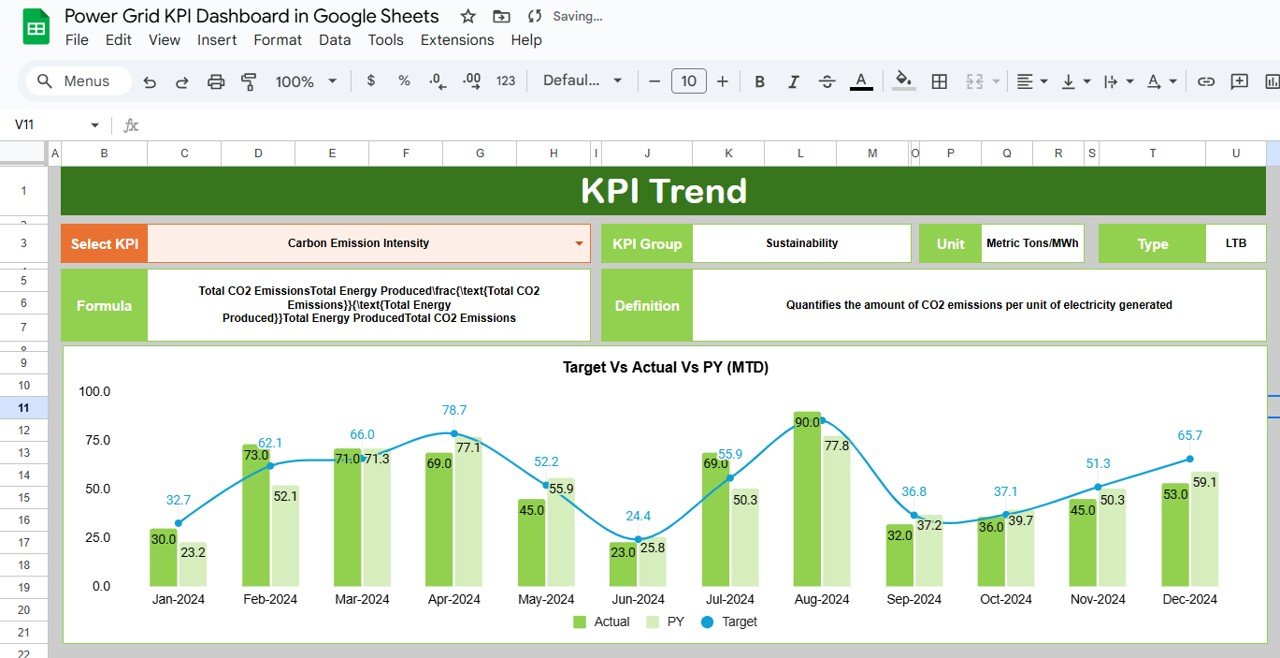
📈 KPI Trend Sheet Tab – Deep Dive Into KPI History
For detailed, KPI-level analysis, the Trend Sheet provides full transparency.
Using the KPI dropdown (Cell C3), you can view:
-
KPI Group
-
Unit of Measurement
-
Performance Type (UTB/LTB)
-
Formula
-
Definition
-
Trend Chart (MTD & YTD)
This view helps operators understand long-term behavior, identify outage patterns, detect stability issues, and evaluate asset efficiency over time.
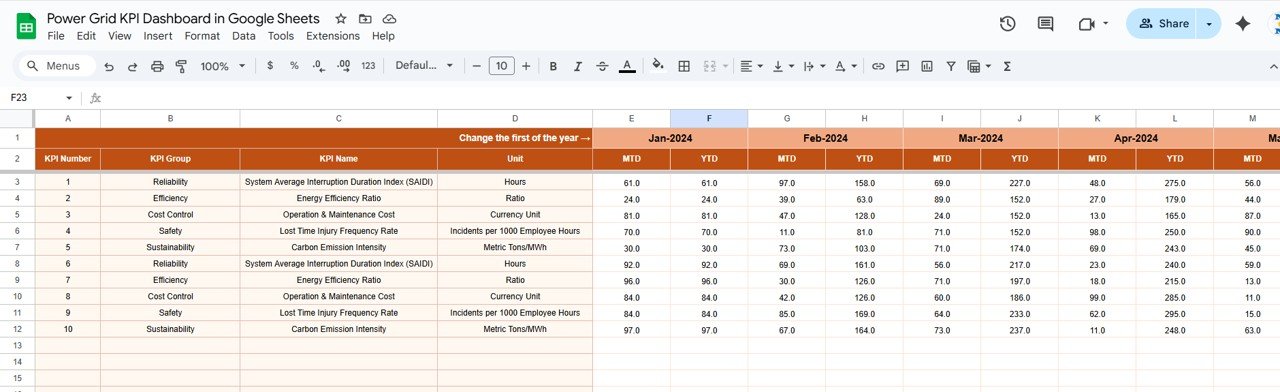
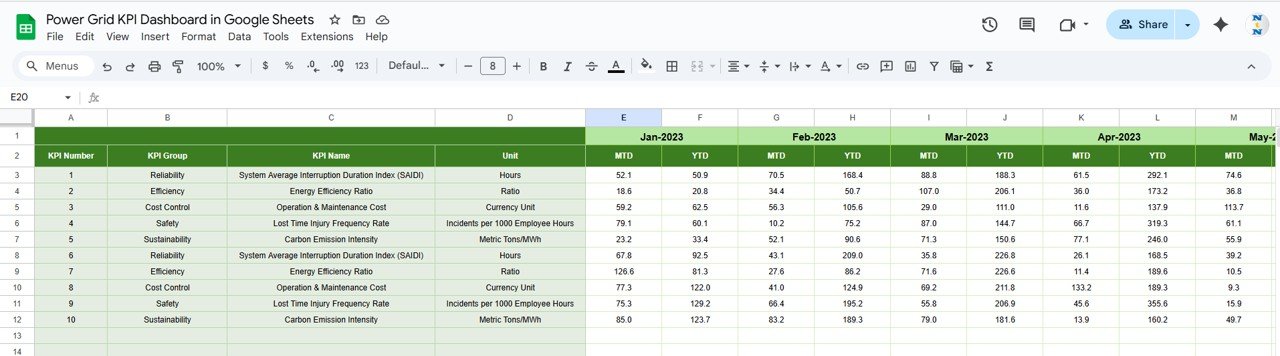
🔢 Actual Number Sheet Tab – Monthly Data Entry
Simply enter the MTD and YTD actual values for every KPI.
✔ Cell E1 lets you define the “Start Month” of the financial year.
✔ Dashboard updates instantly with no manual calculations.
Perfect for grid teams that update data weekly, monthly, or after major events.
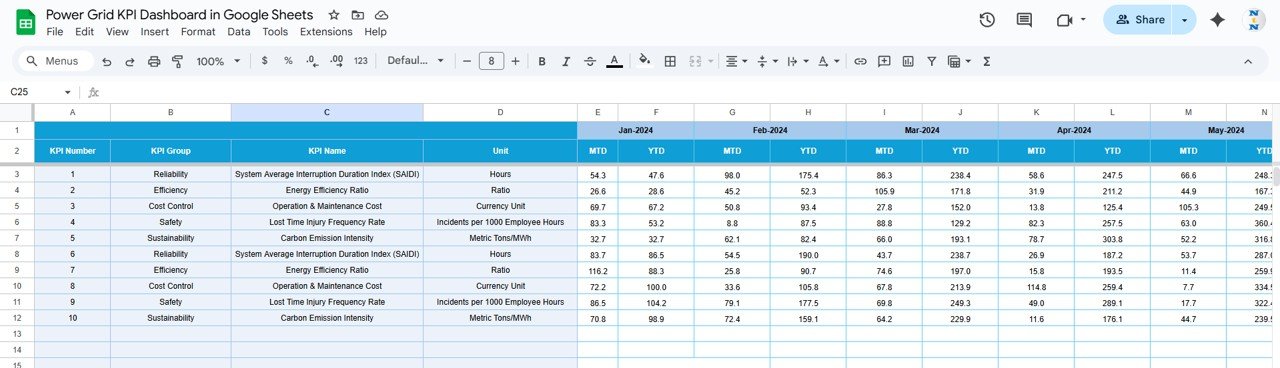
🎯 Target Number Sheet Tab – Track Goals Effortlessly
Set monthly and YTD targets here. These values automatically push into the dashboard, allowing:
-
Performance variance analysis
-
Benchmarking
-
Regulatory compliance reporting
📅 Previous Year Number Sheet Tab – YOY Benchmarking
Record MTD and YTD values from last year to unlock:
-
YOY comparison
-
Reliability improvement tracking
-
Long-term performance visibility
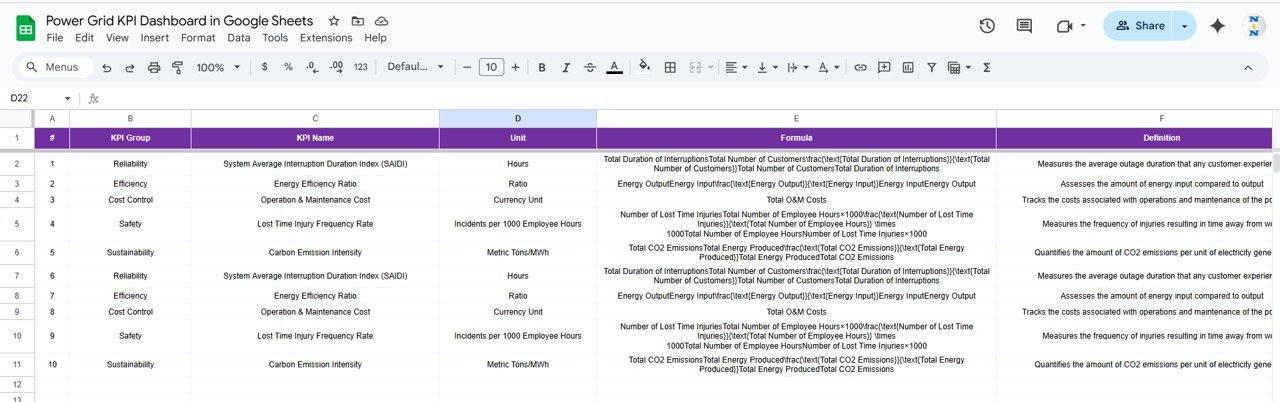
📘 KPI Definition Sheet Tab – Standardized KPI Framework
This sheet provides complete clarity with:
-
KPI Name
-
KPI Group
-
Unit
-
Formula
-
Definition
-
KPI Type (Upper/Lower the Better)
Consistency in KPI meaning helps align teams across operations, engineering, safety, maintenance, and management.
👥 Who Can Benefit From This Dashboard?
⚡ Transmission Companies
⚡ Grid Operations Teams
⚡ Energy Regulators
⚡ Government Electricity Boards
⚡ High-Voltage Line Monitoring Teams
⚡ SCADA & Load Dispatch Centers
⚡ Maintenance & Reliability Teams
Whether managing regional or national transmission networks, this dashboard provides unmatched visibility into performance.
🌟 Advantages of the Power Grid KPI Dashboard
✨ Ensures reliable grid performance
✨ Improves outage response & restoration time
✨ Supports regulatory audits & compliance
✨ Identifies overloads, faults, and energy losses early
✨ Enhances transformer & line reliability
✨ Helps forecast load and manage peak periods
✨ Offers complete YOY and MTD/YTD trend visibility
🚀 Opportunities for Improvement
Enhance the dashboard further using:
💡 SCADA live data integration
💡 Automated email alerts for overload/faults
💡 Region-wise dashboard segmentation
💡 Predictive maintenance indicators
💡 Load forecasting heatmaps
💡 Equipment condition-based scoring
🧠 Best Practices for Maximum Accuracy
✔ Update actual values monthly (or weekly)
✔ Track reliability KPIs like SAIDI, SAIFI, CAIDI regularly
✔ Compare YTD values with previous year to detect rising risks
✔ Keep KPI definitions consistent across departments
✔ Monitor overload and loss KPIs more frequently
✔ Use Trend Chart to forecast seasonal performance
Click here to read the Detailed blog post
Watch the step-by-step video Demo:


Reviews
There are no reviews yet.