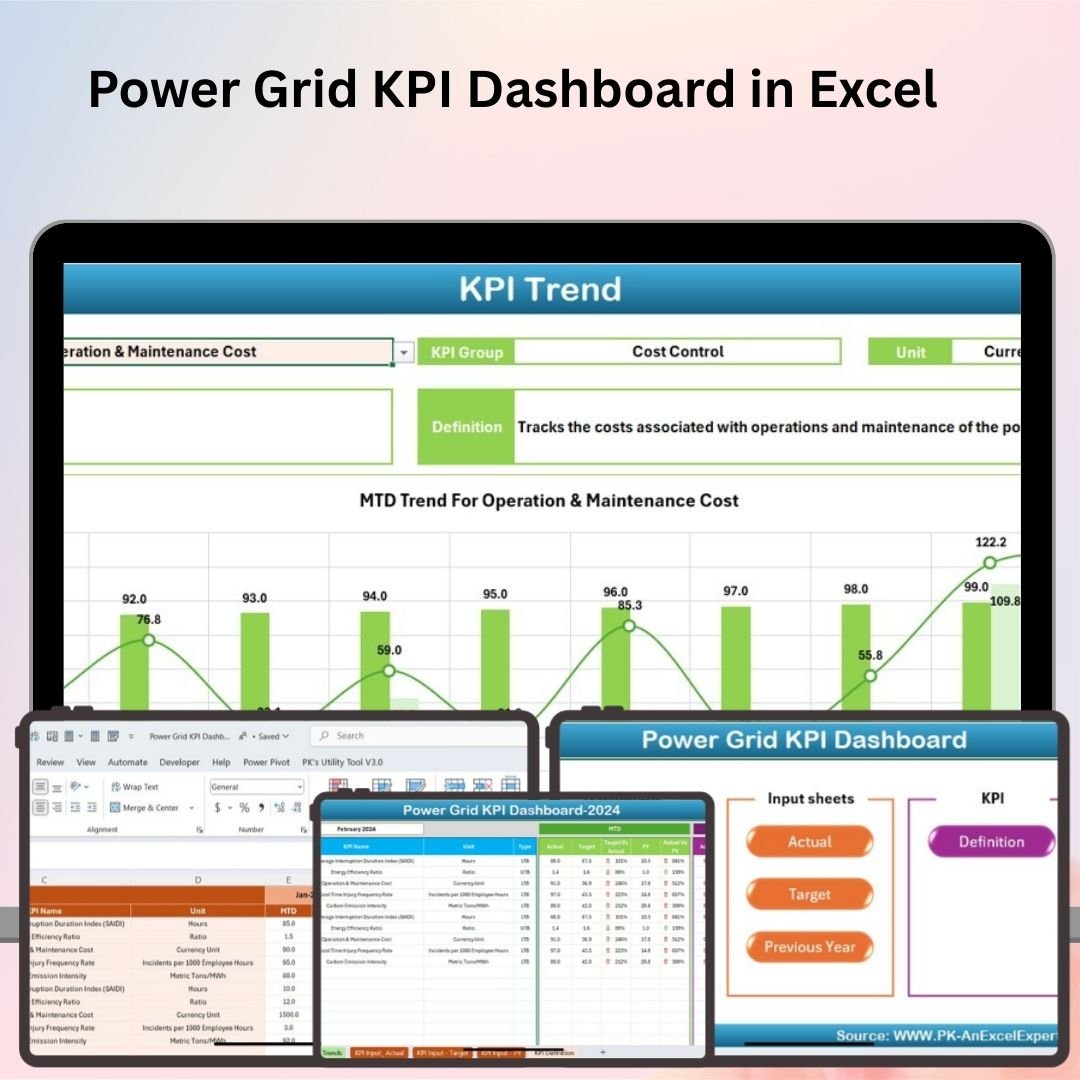
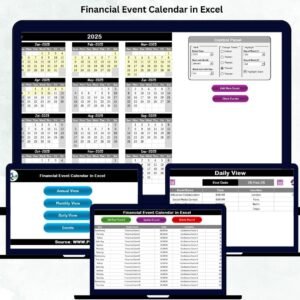
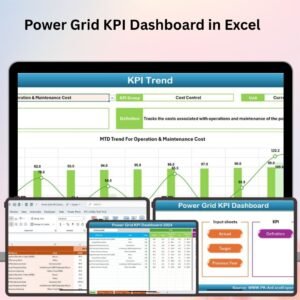
The Power Grid KPI Dashboard in Excel is an essential tool for energy companies, grid operators, and utility managers to monitor and optimize the performance of power grids. This Excel-based dashboard enables you to track key performance indicators (KPIs) such as energy distribution efficiency, grid reliability, operational costs, and system performance, allowing you to ensure reliable service, reduce operational costs, and maximize the efficiency of the power grid.
With interactive charts, real-time tracking, and automated calculations, this dashboard makes it easier to manage the complex operations of power grid systems, enabling you to make data-driven decisions that optimize performance and ensure the continued reliability of power delivery.
Key Features of the Power Grid KPI Dashboard in Excel:
⚡ Energy Distribution Efficiency
Track the efficiency of energy distribution across the grid, including energy losses, distribution efficiency, and load balancing, to ensure optimal performance.
🌍 Grid Reliability and Availability
Monitor grid reliability, including system uptime, service interruptions, and maintenance schedules, ensuring the grid operates with minimal downtime.
📊 Energy Consumption and Load Management
Monitor energy consumption across different regions, track peak load times, and manage the grid’s ability to meet energy demands efficiently.
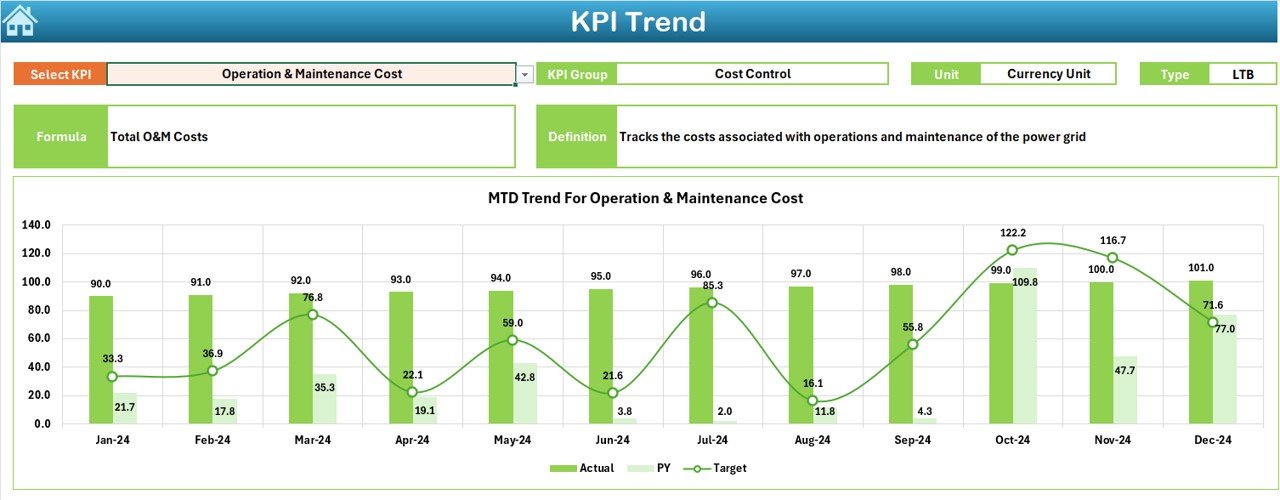
💰 Operational Cost Tracking
Track operational expenses, including maintenance costs, power generation costs, and grid infrastructure, to ensure the grid is operating within budget.
📈 Power Quality and Voltage Monitoring
Measure the quality of power being delivered, including voltage levels, harmonic distortion, and frequency variations, ensuring that power is stable and reliable.
🚀 Why You’ll Love the Power Grid KPI Dashboard in Excel:
✅ Monitor Energy Distribution Efficiency – Track energy losses and optimize distribution to improve grid efficiency and reduce wastage.
✅ Ensure Grid Reliability – Monitor uptime, service interruptions, and maintenance schedules to ensure that your power grid operates reliably and efficiently.
✅ Manage Energy Consumption – Track energy consumption and manage load across the grid to avoid congestion and ensure efficient power delivery.
✅ Track Operational Costs – Monitor expenses related to grid infrastructure, maintenance, and power generation to ensure cost-effective operations.
✅ Monitor Power Quality – Track voltage levels, harmonic distortion, and other key power quality metrics to ensure a stable and high-quality power supply.
✅ Customizable and Interactive – Fully customizable to suit your grid’s needs, with interactive charts and real-time tracking for better decision-making.
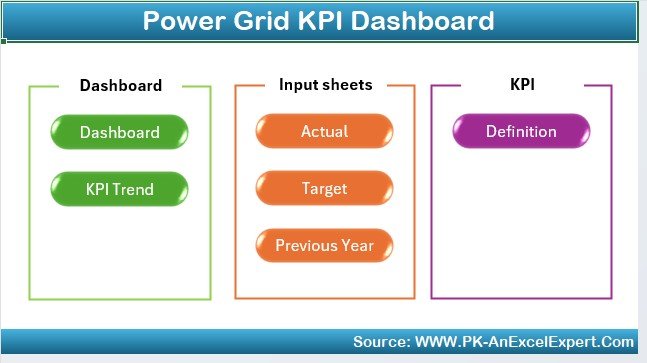
What’s Inside the Power Grid KPI Dashboard in Excel:
-
Energy Distribution Efficiency: Track energy losses, load balancing, and distribution efficiency to ensure optimal energy delivery across the grid.
-
Grid Reliability: Monitor system uptime, service interruptions, and scheduled maintenance to ensure grid reliability and reduce downtime.
-
Energy Consumption and Load Management: Track regional energy consumption, monitor peak load times, and manage the grid’s response to energy demands.
-
Operational Cost Tracking: Monitor costs associated with maintenance, infrastructure, and energy generation to ensure cost-efficiency.
-
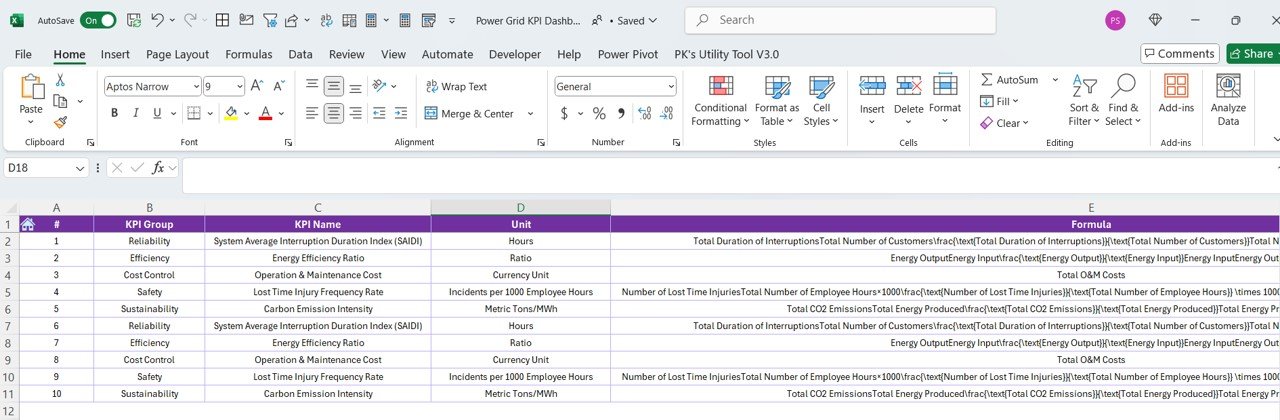
Power Quality Monitoring: Measure and monitor key power quality metrics, including voltage levels, frequency stability, and harmonic distortion, to maintain a high-quality power supply.
-
Custom Reports: Generate tailored reports that summarize key performance metrics, helping you make data-driven decisions and optimize grid operations.
How to Use the Power Grid KPI Dashboard in Excel:
1️⃣ Download the Template – Instantly access your Excel file upon purchase.
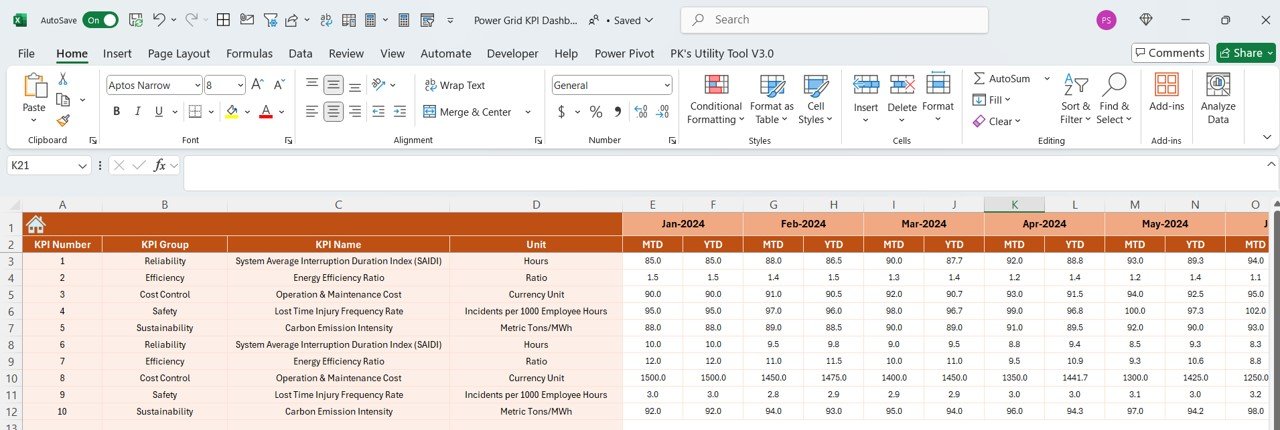
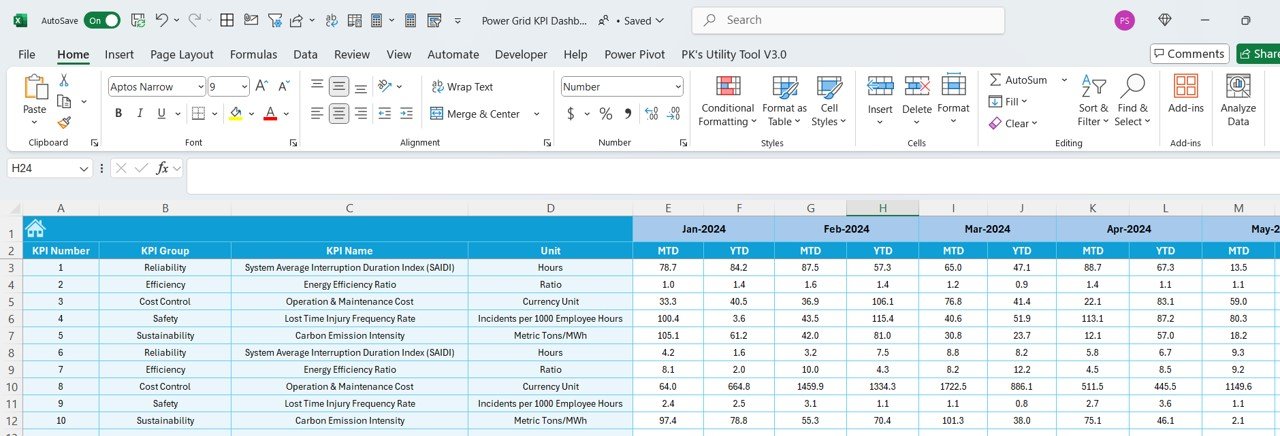
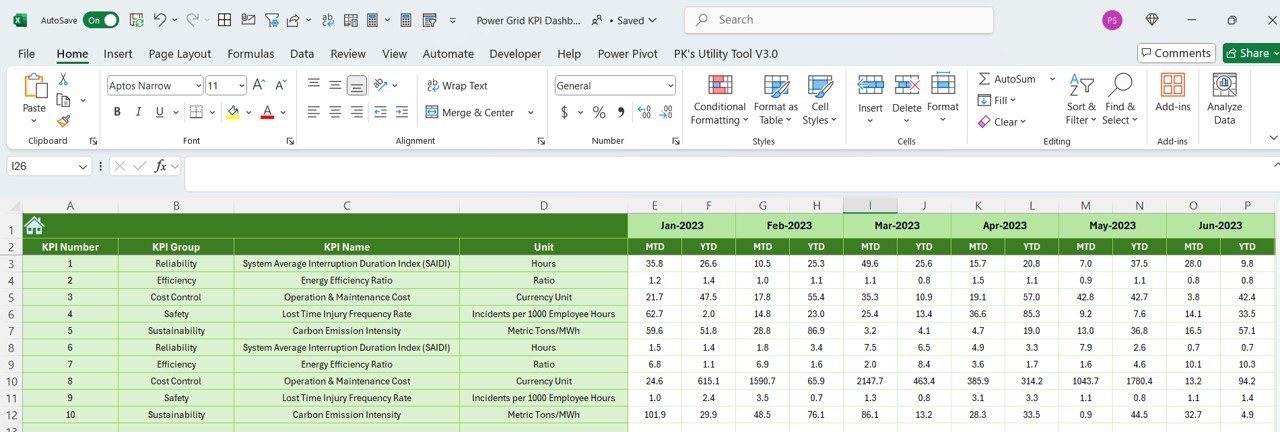
2️⃣ Input Grid Data – Enter data for energy consumption, grid performance, operational costs, and power quality metrics to begin tracking KPIs.
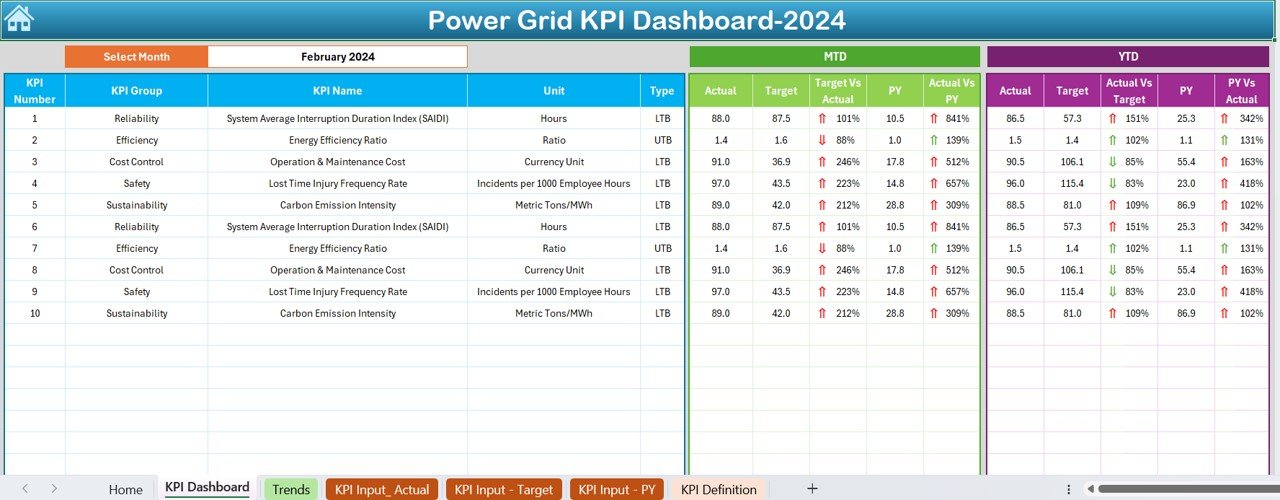
3️⃣ Monitor Key Metrics – Use the dashboard to monitor energy distribution, grid reliability, operational expenses, and power quality in real-time.
4️⃣ Analyze Trends – Track trends in energy consumption, system performance, and operational costs to identify areas for improvement.
5️⃣ Generate Reports – Create customized reports summarizing grid performance, power quality, and operational costs for informed decision-making.
Who Can Benefit from the Power Grid KPI Dashboard in Excel:
-
Grid Operators
-
Energy Companies
-
Utility Managers
-
Power Generation and Distribution Teams
-
Electrical Engineers
-
Operations Managers in Energy Sector
-
Government Energy Regulatory Bodies
-
Infrastructure and Facility Management Teams
The Power Grid KPI Dashboard in Excel is the ideal tool for anyone managing power grids, looking to optimize energy distribution, ensure grid reliability, and track operational costs. With features like energy loss tracking, power quality monitoring, and grid performance analysis, this dashboard helps you make better decisions and ensure efficient power delivery to your customers.
Click here to read the Detailed blog post
https://www.pk-anexcelexpert.com/power-grid-kpi-dashboard-in-excel/
Visit our YouTube channel to learn step-by-step video tutorials
Youtube.com/@PKAnExcelExpert


Reviews
There are no reviews yet.