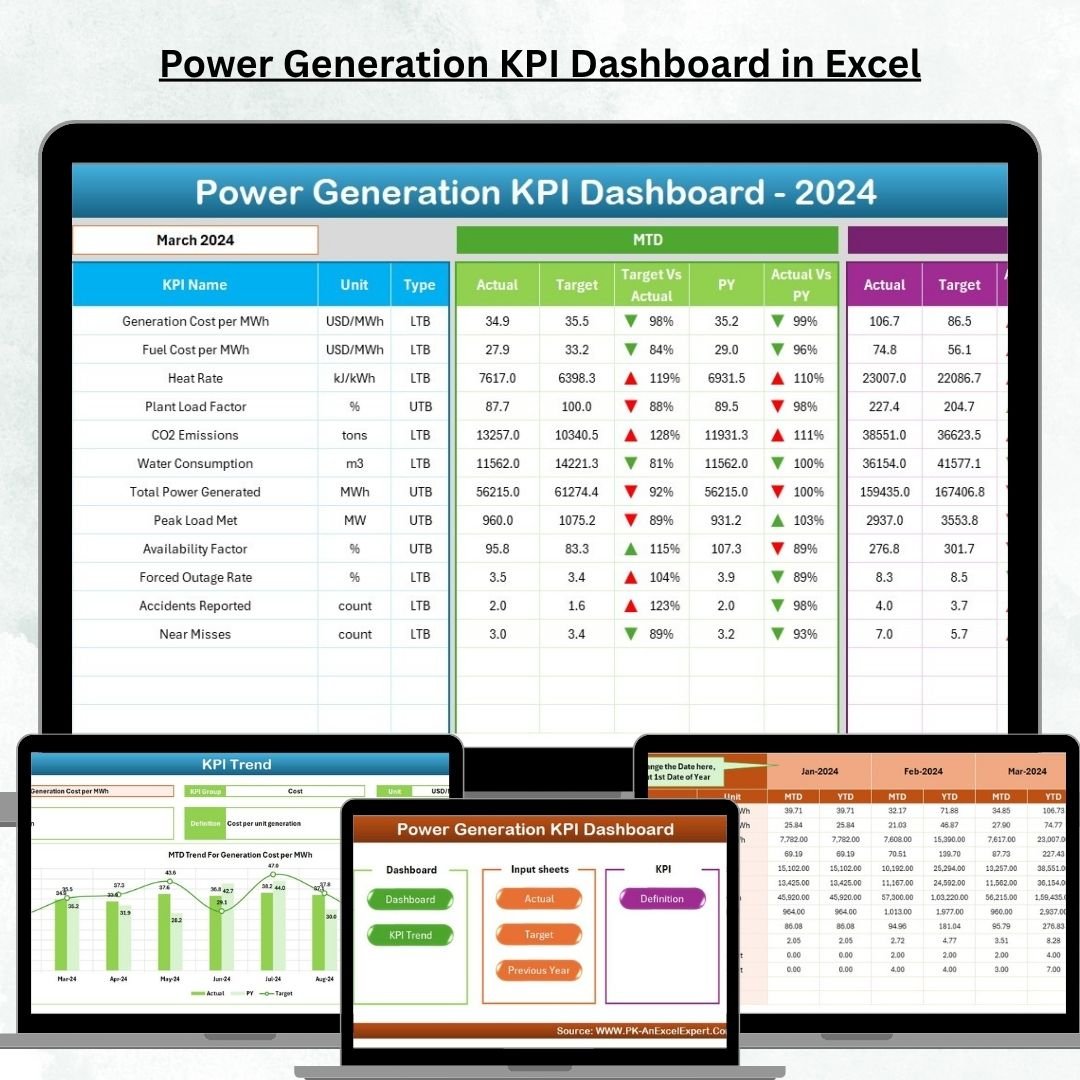
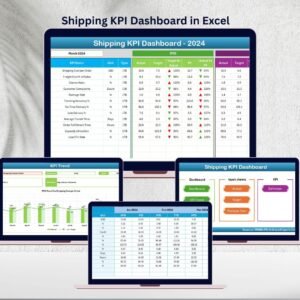
The power generation industry is the backbone of modern economies. From powering cities to supporting industries, energy companies face constant pressure to deliver reliable, efficient, and sustainable results. Tracking performance manually is not only time-consuming but also prone to costly errors. That’s why the Power Generation KPI Dashboard in Excel ⚡📊 is a must-have tool for energy professionals.
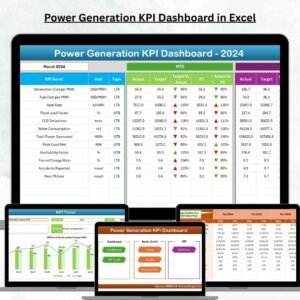
This ready-to-use dashboard consolidates all your power plant data into one place, enabling real-time monitoring of KPIs such as energy output, efficiency, downtime, and environmental compliance. With automated visuals, interactive controls, and a structured layout, it empowers decision-makers to act fast and improve performance without relying on expensive BI tools.
⚡ Key Features of Power Generation KPI Dashboard in Excel
✅ Centralized Reporting – Monitor all KPIs in one unified dashboard.
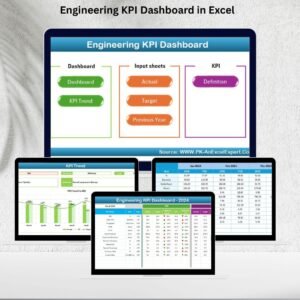
✅ Seven Dedicated Sheets – Home, Dashboard, KPI Trend, Actual Numbers, Targets, Previous Year, and KPI Definitions.
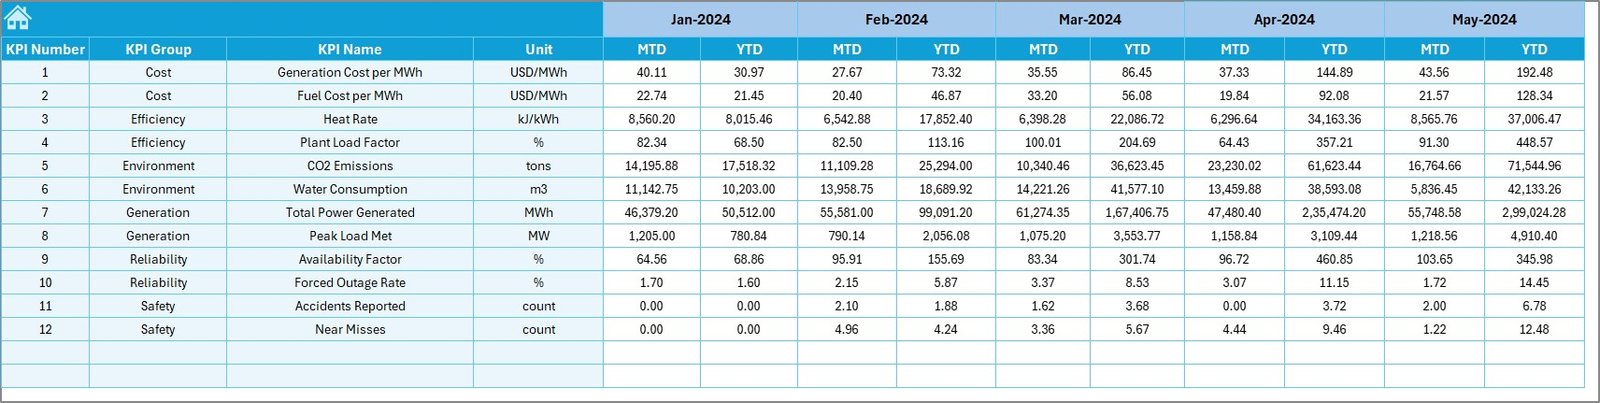
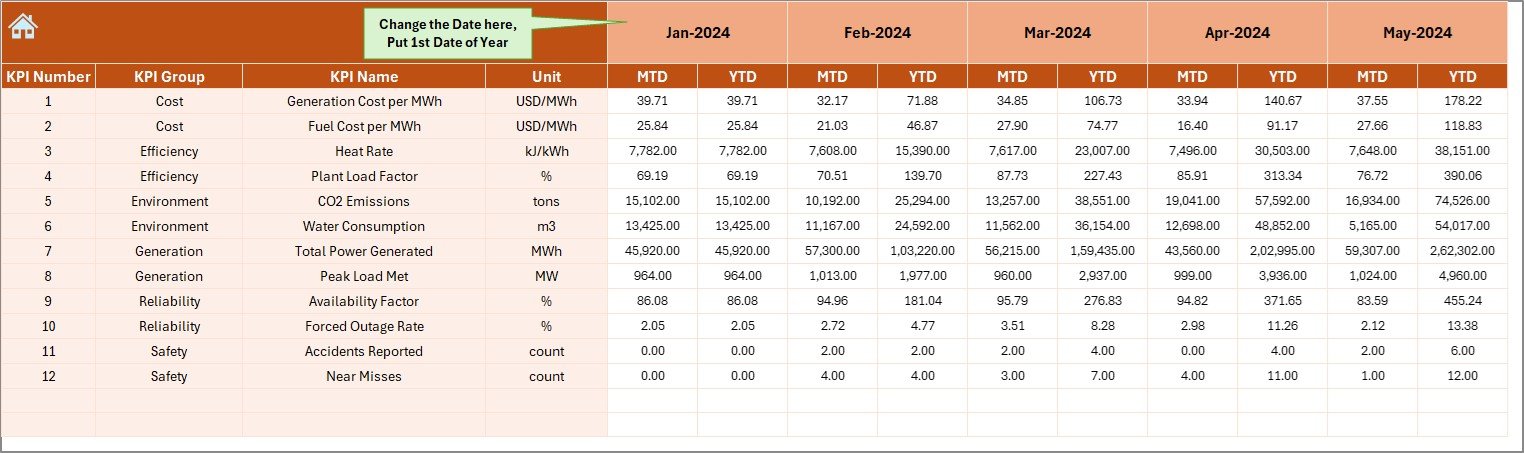
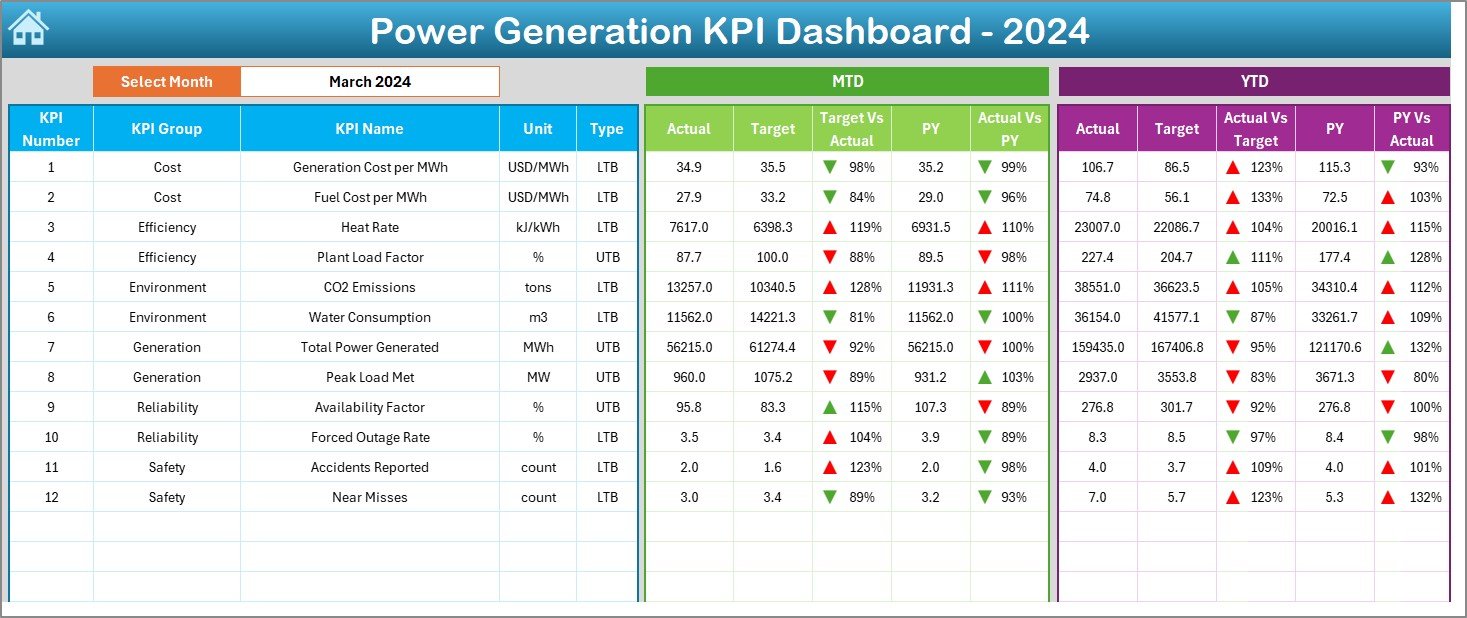
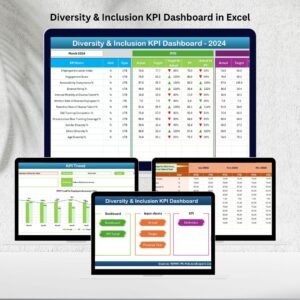
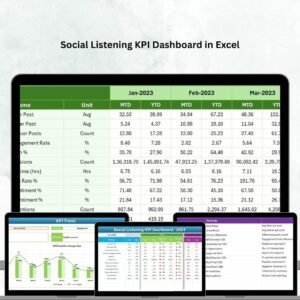
✅ MTD & YTD Comparisons – Track monthly and yearly data against targets and previous years.
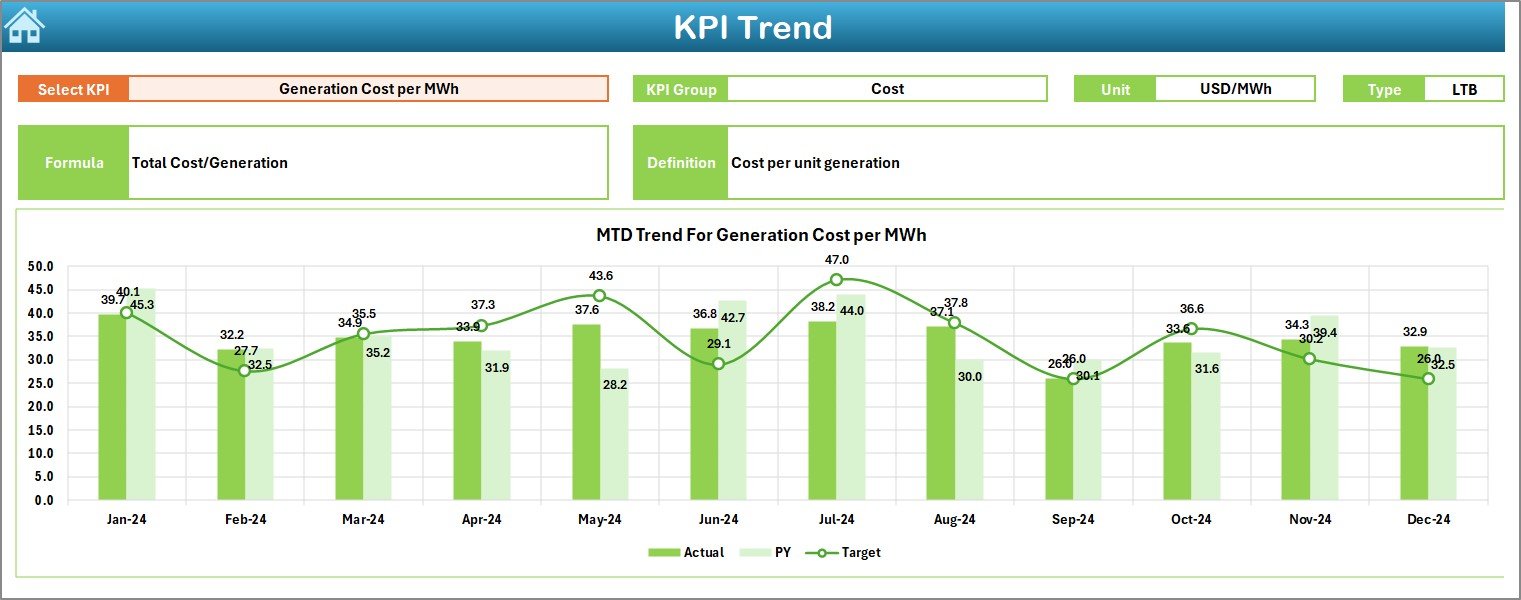
✅ Interactive Drop-Downs – Switch months and KPIs instantly for customized analysis.
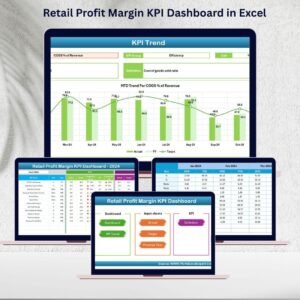
✅ Automated Visuals – Charts, conditional formatting, and arrows highlight progress and problem areas.
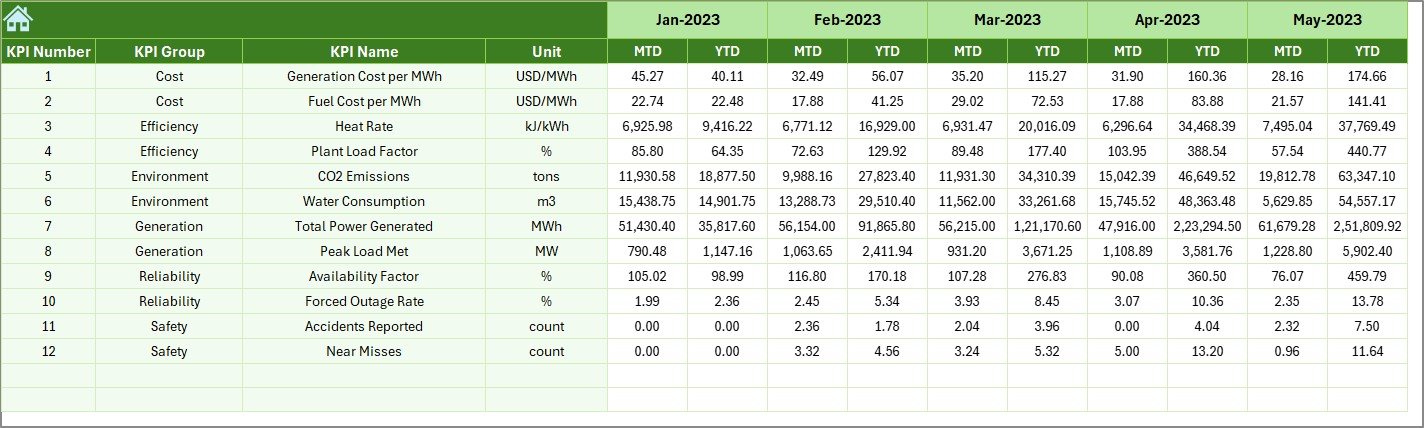
✅ Benchmarking Capability – Compare current performance with last year to track improvement.
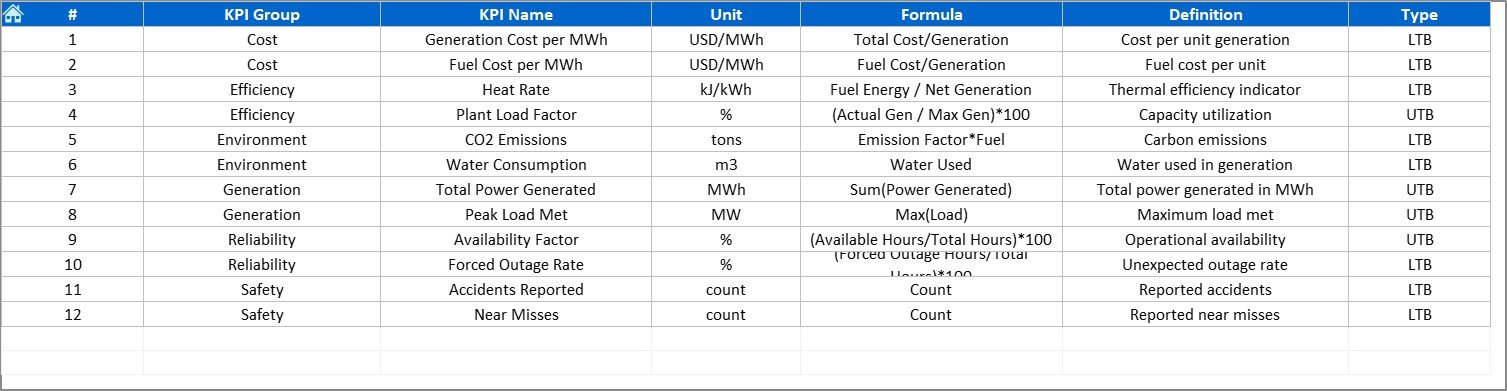
✅ Standardized KPIs – Use predefined formulas and definitions for consistent reporting.
✅ Excel-Powered – No complicated setup; just open, input, and analyze.
📂 What’s Inside the Power Generation KPI Dashboard
This template includes seven structured worksheets designed to cover every aspect of performance management:
-
Home Sheet – Navigation hub with quick links to all sections.
-
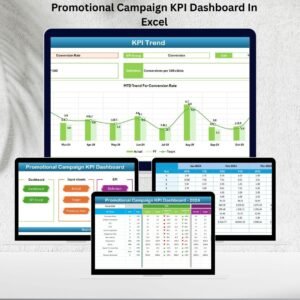
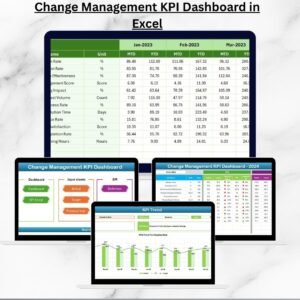
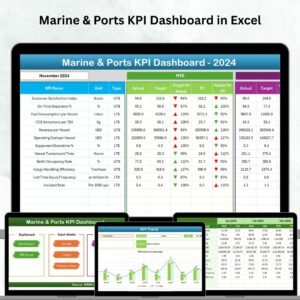
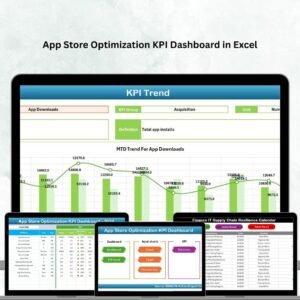
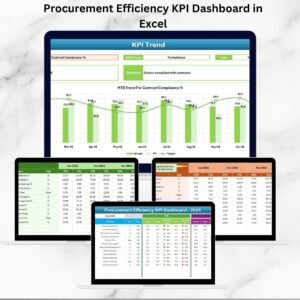
Dashboard Sheet – Main visualization page with KPI cards, charts, and drop-down filters.
-
KPI Trend Sheet – Trend analysis with Actual vs Target vs Previous Year comparisons.
-
Actual Numbers Input Sheet – Data entry for MTD and YTD performance.
-
Target Sheet – Define benchmarks and goals for each KPI.
-
Previous Year Numbers Sheet – Store historical performance for year-over-year analysis.
-
KPI Definition Sheet – Standardized list of KPI names, groups, formulas, and definitions.
🛠️ How to Use the Power Generation KPI Dashboard
-
Enter Data – Input actual results in the Actual Numbers sheet.
-
Set Benchmarks – Add monthly and yearly targets in the Target sheet.
-
Add Historical Data – Populate the Previous Year sheet for benchmarking.
-
Navigate Easily – Use the Home sheet buttons to jump between tabs.
-
Analyze Performance – Review trends, compare targets, and spot inefficiencies.
-
Take Action – Use insights to improve plant reliability, reduce downtime, and track sustainability goals.
👥 Who Can Benefit from This Dashboard?
-
Thermal Power Plants 🔥 – Track heat rate, fuel efficiency, and downtime.
-
Hydropower Stations 💧 – Monitor water flow, turbine output, and seasonal generation.
-
Solar Plants ☀️ – Compare energy generation vs irradiation levels.
-
Wind Farms 🌬️ – Measure turbine performance and grid availability.
-
Regulators & Auditors 🏛️ – Ensure environmental compliance and emissions monitoring.
-
Energy Managers & Analysts 📑 – Provide data-driven reports for better decision-making.


Reviews
There are no reviews yet.