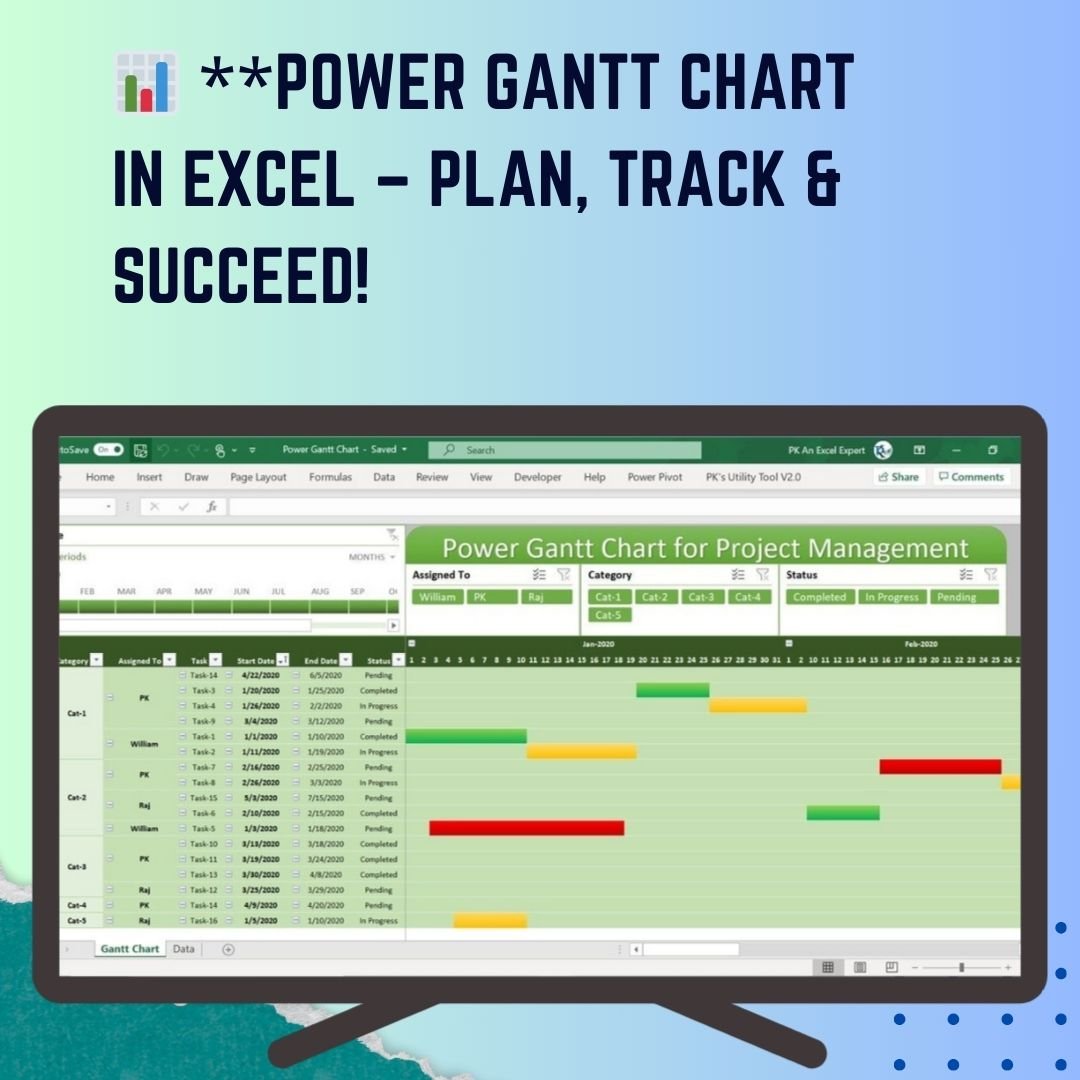
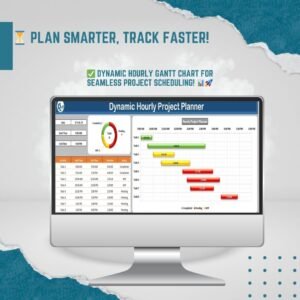
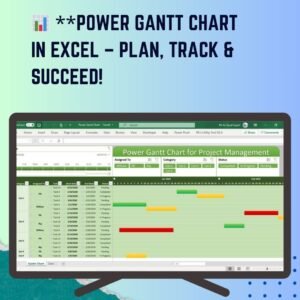
Managing projects efficiently is crucial for success, and our Power Gantt Chart in Excel is designed to make task tracking, resource allocation, and project planning effortless. This powerful Excel template provides a visual representation of project timelines, allowing project managers, teams, and freelancers to monitor progress, track task completion, and optimize workflow in real time.
With dynamic slicers, an interactive timeline, and auto-updating charts, this tool simplifies project tracking while ensuring seamless integration with your existing Excel-based project management systems. Whether you’re managing small tasks or large-scale projects, this customizable and user-friendly Excel Gantt chart will help you stay on top of deadlines and deliverables.
Key Features of Power Gantt Chart in Excel
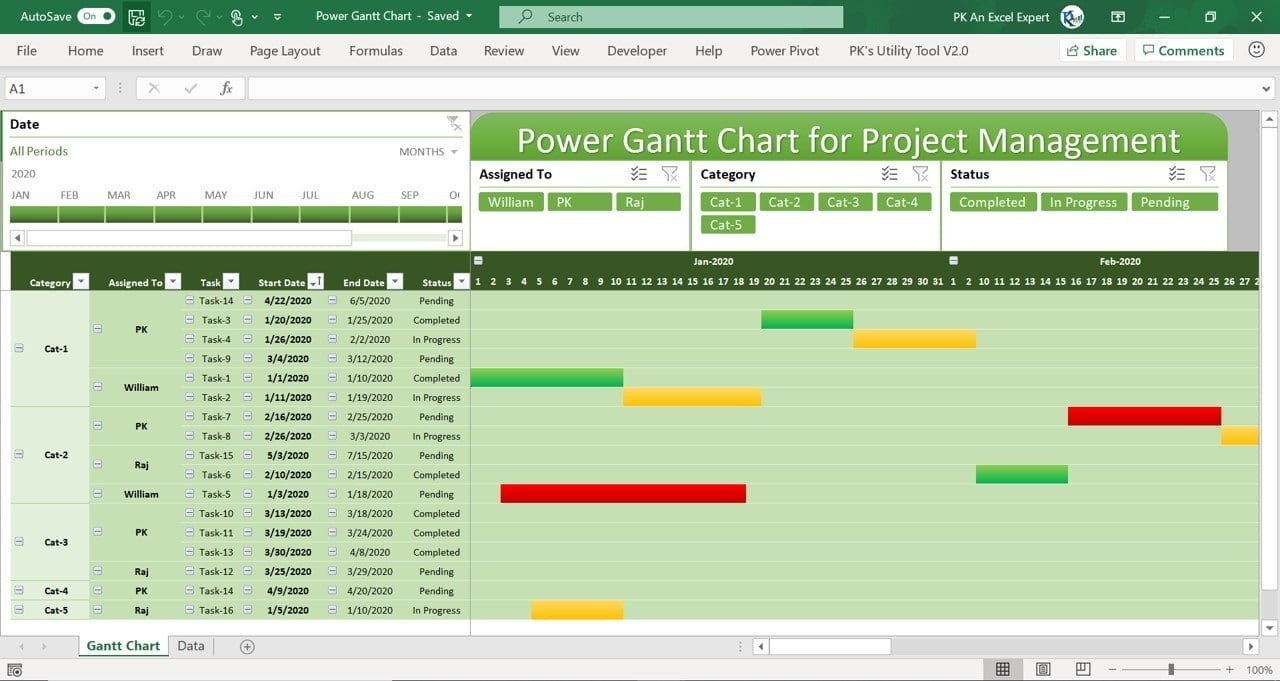
📌 1. Dynamic Slicers & Timeline
✔ Filter projects by team members, task category, and status to get a clear view of project progress.
✔ The interactive timeline allows you to focus on specific months or the entire year, making it easy to track ongoing and upcoming tasks.
✔ Quickly switch between “Completed,” “In Progress,” and “Pending” tasks with a single click.
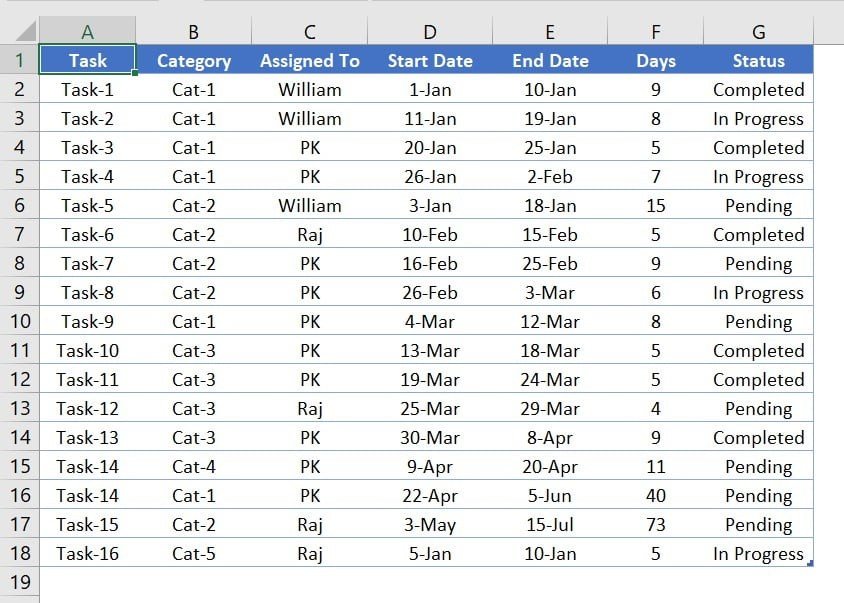
📌 2. User-Friendly Data Input
✔ No need for complex formulas! Simply enter your project details in the Data Sheet and refresh the Pivot Table to generate the Gantt Chart automatically.
✔ The table structure supports task name, category, assigned person, start date, end date, task duration, and status for precise project tracking.
📌 3. Automated Task Tracking
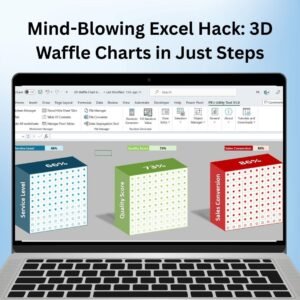
✔ Tasks are visually represented in color-coded bars:
- Green: Completed tasks
- Yellow: Tasks in progress
- Red: Pending tasks
✔ This real-time status update makes it easy to identify bottlenecks and overdue tasks.
📌 4. Seamless Integration with Your Project Workflow
✔ Designed to work alongside your existing Excel-based project management tools.
✔ The Gantt chart is fully customizable—modify colors, task categories, or team assignments based on your project needs.
📌 5. Customizable Views & Filtering Options
✔ View specific team members’ workload, filter tasks by department or project type, and adjust timeframes to match deadlines.
✔ The month-wise timeline provides an intuitive, zoomed-out view of the entire project lifecycle.
📌 6. Real-Time Project Analysis & Reporting
✔ Keep your stakeholders updated with auto-generated reports.
✔ Identify trends and make data-driven decisions by comparing task completion rates over different months.
✔ Export reports as PDFs for easy sharing.
📌 7. Multi-Project Support
✔ This template is perfect for tracking multiple projects in a single sheet.
✔ Easily manage overlapping projects and resource allocation without confusion.
📌 8. Comprehensive Video Tutorials
✔ Need guidance? We provide step-by-step video tutorials on our YouTube channel, ensuring you maximize the full potential of this template.
✔ Whether you’re a beginner or an experienced project manager, our tutorials cover everything from basic setup to advanced usage.
📌 9. Instant Download & Easy Setup
✔ No complicated installations—simply download, open in Excel, and start tracking tasks immediately!
✔ Instructions are included to help you navigate and customize the template to fit your workflow.
📌 10. Ideal for Professionals & Teams
✔ Perfect for project managers, small businesses, freelancers, consultants, and teams handling multiple tasks and projects.
✔ Boost productivity, enhance collaboration, and meet deadlines efficiently with this Excel-based Gantt Chart.
Why Choose Power Gantt Chart in Excel?
Managing projects manually can lead to missed deadlines, inefficient workflows, and lack of task visibility. With this dynamic and automated Excel Gantt Chart, you can track progress, allocate resources efficiently, and ensure every task is completed on time.
By using this pre-built Excel template, you save time, reduce errors, and enhance project transparency across your team. The interactive timeline and dynamic filters allow for real-time tracking and adjustments, making it an invaluable tool for professionals in IT, marketing, operations, HR, and more.
Get Started Today! 🚀
✅ Instant Download – Get access immediately after purchase.
✅ Fully Customizable – Modify categories, color schemes, and team assignments.
✅ Lifetime Access – Use it for unlimited projects.
✅ Step-by-Step Video Tutorials – Learn how to maximize efficiency.
📊 Boost your project management with the Power Gantt Chart in Excel! Try it today and take your productivity to the next level! 🎯💡
Click here to read the detailed blog post
Visit our YouTube channel to learn step-by-step video tutorials
Watch the step-by-step video tutorial:
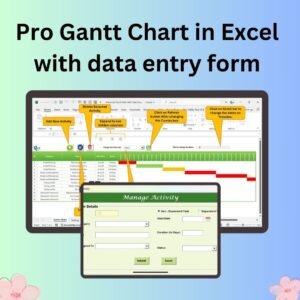
Also check our Pro Gantt Chart in Excel with data entry form


Reviews
There are no reviews yet.