Power distribution companies cannot afford guesswork. Every outage, loss, or compliance miss directly impacts reliability, revenue, and customer trust. That is exactly why the Power Distribution KPI Dashboard in Power BI is designed as a business-ready, decision-driven analytics solution—built to give you instant clarity, control, and confidence.
This ready-to-use dashboard transforms raw operational data into clear KPIs, dynamic visuals, and actionable insights. Instead of juggling multiple Excel sheets, static reports, and manual calculations, you get one centralized Power BI dashboard that tracks Month-to-Date (MTD) and Year-to-Date (YTD) performance effortlessly.
Built with Excel for data entry and Power BI for visualization, this dashboard delivers enterprise-level analytics without complexity or heavy IT dependency.
🚀 Key Features of Power Distribution KPI Dashboard in Power BI
⚡ Centralized KPI Monitoring
Track all power distribution KPIs from a single, structured Power BI report.
📅 MTD & YTD Performance Tracking
Monitor current performance while keeping long-term progress visible at the same time.
🎯 Target vs Actual Analysis
Instantly identify target-met and target-missed KPIs using intuitive visual indicators.
📊 Dynamic Slicers & Filters
Analyze performance by Month and KPI Group with real-time dashboard updates.
📈 Trend-Based Insights
Understand patterns, seasonality, and deviations through interactive trend charts.
🧩 Excel-Driven Data Model
Maintain and update data easily—no complex data pipelines required.
📘 KPI Definition & Governance Layer
Ensure clarity, consistency, and audit readiness with documented KPI formulas and definitions.
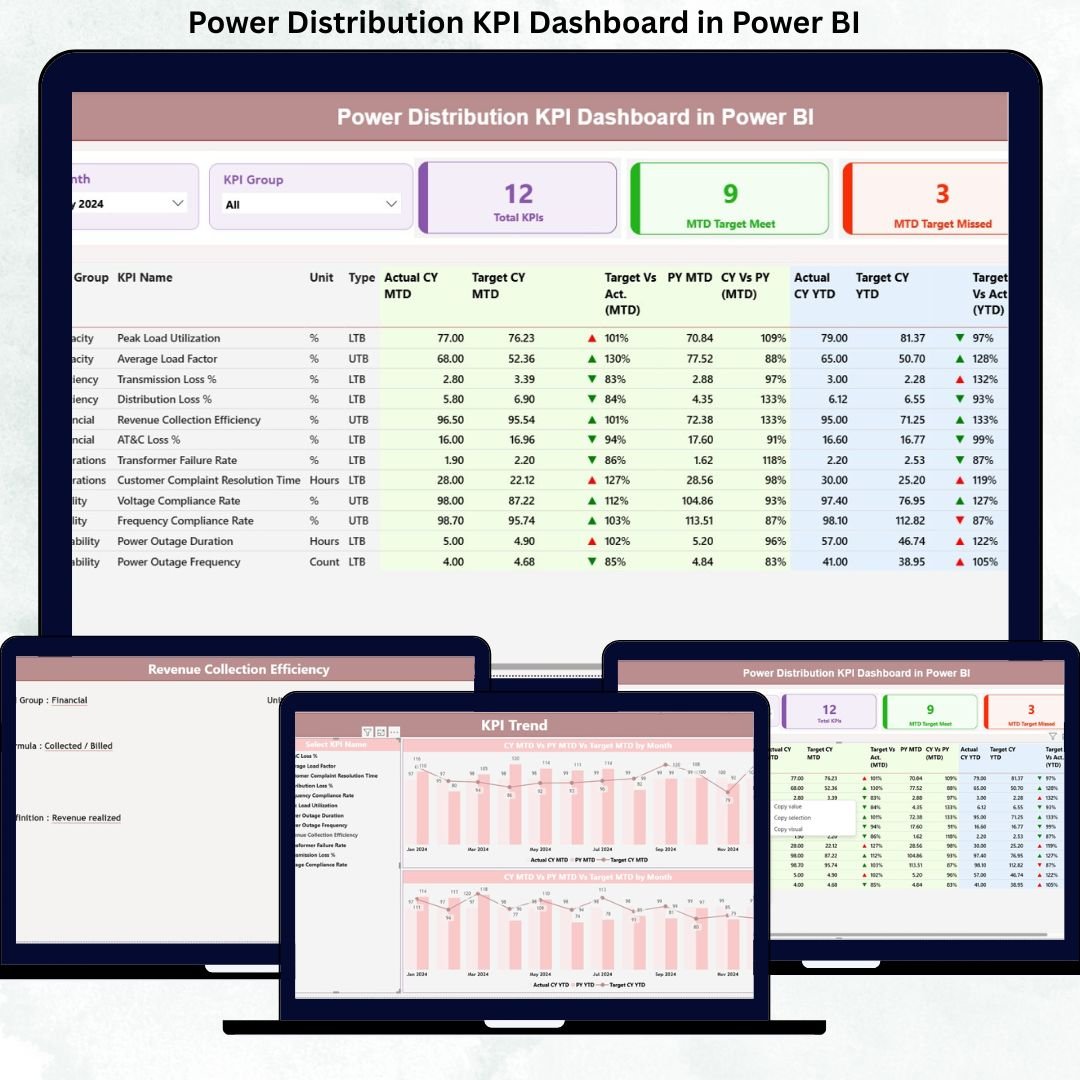
📦 What’s Inside the Power Distribution KPI Dashboard
This product includes a professionally structured Power BI file supported by an Excel data source, designed for real-world power distribution analytics.
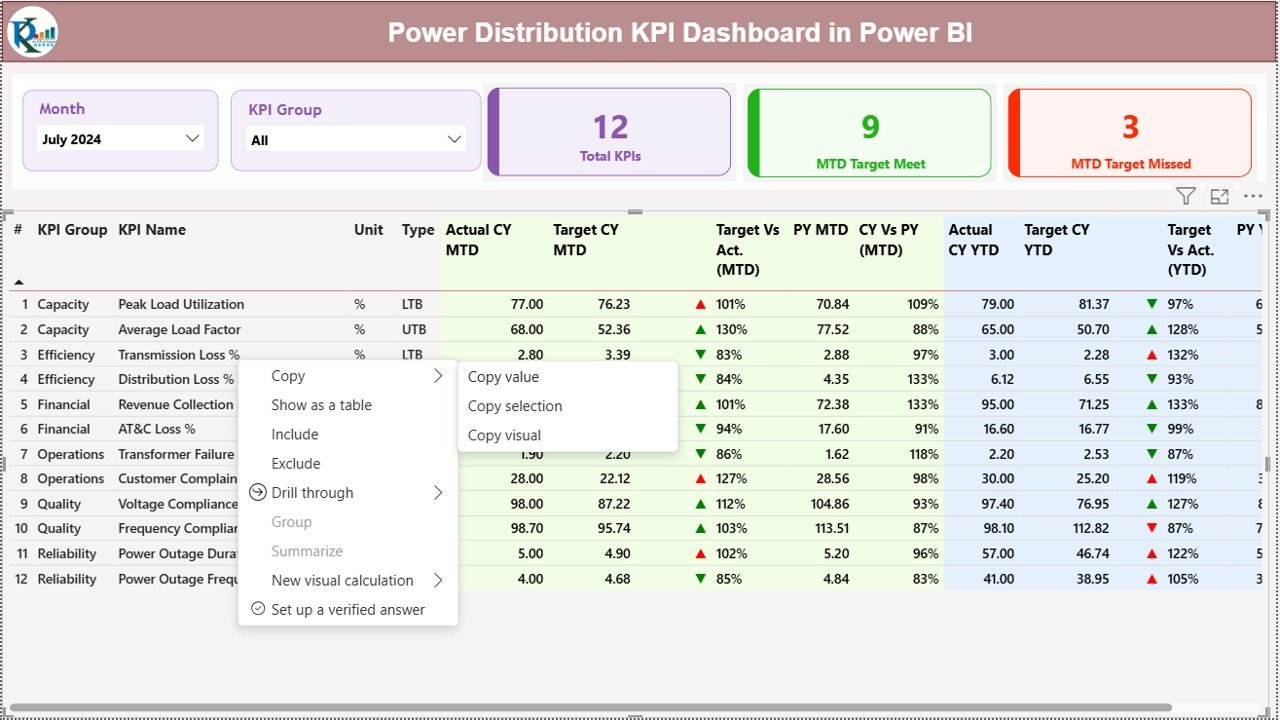
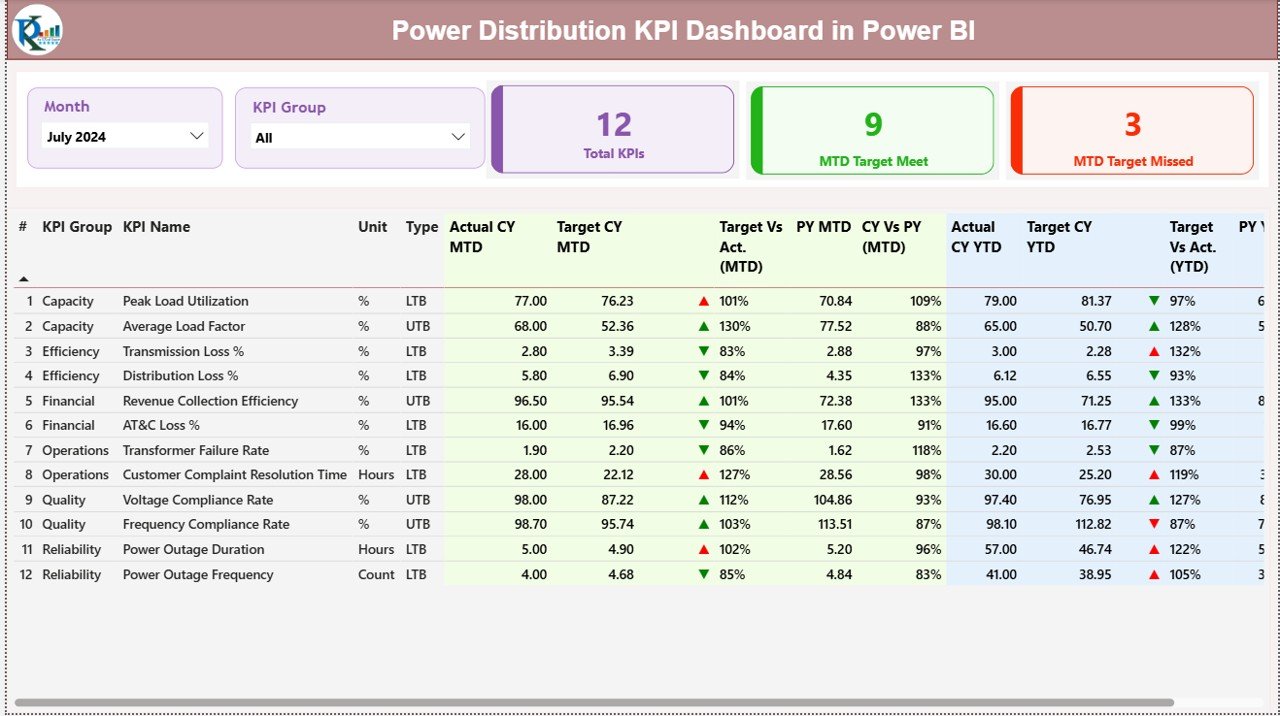
🔹 Summary Page
-
Month and KPI Group slicers
-
KPI status cards (Total KPIs, Target Met, Target Missed)
-
Detailed KPI table with MTD and YTD comparisons
-
Conditional formatting icons for instant status visibility
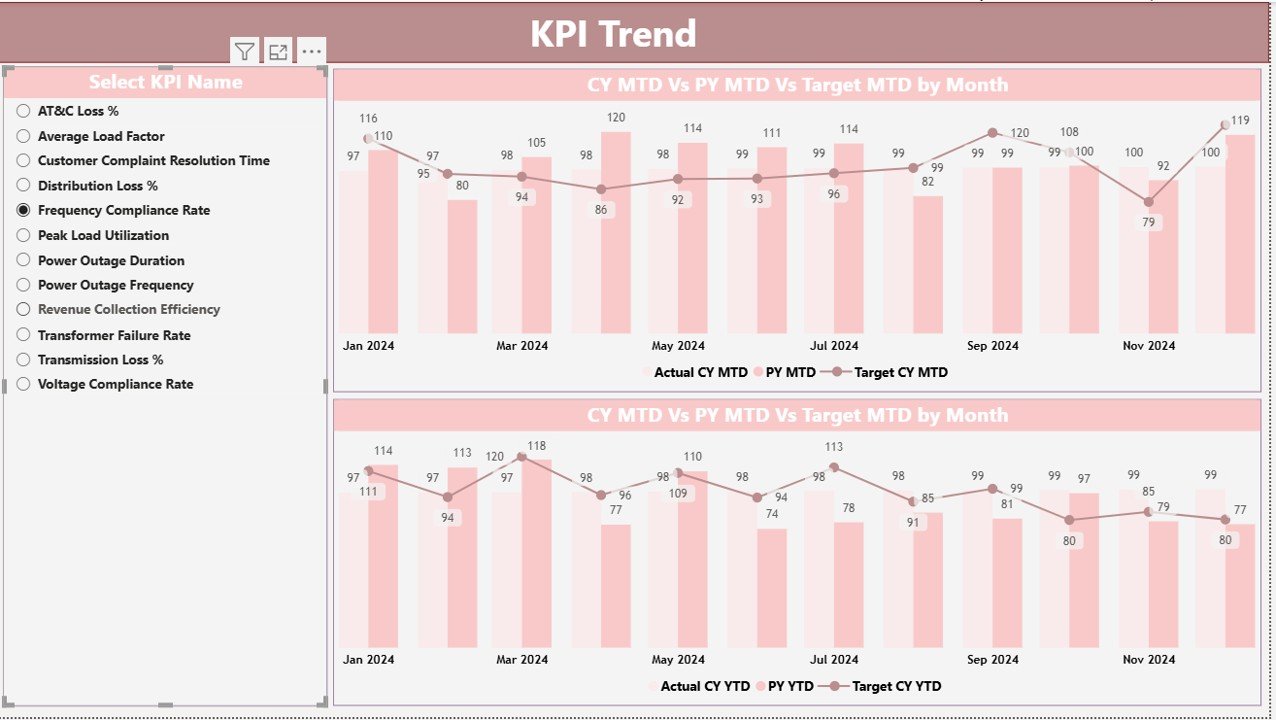
🔹 KPI Trend Page
-
MTD trend chart (Actual, Target, Previous Year)
-
YTD trend chart (Actual, Target, Previous Year)
-
KPI selector for focused analysis
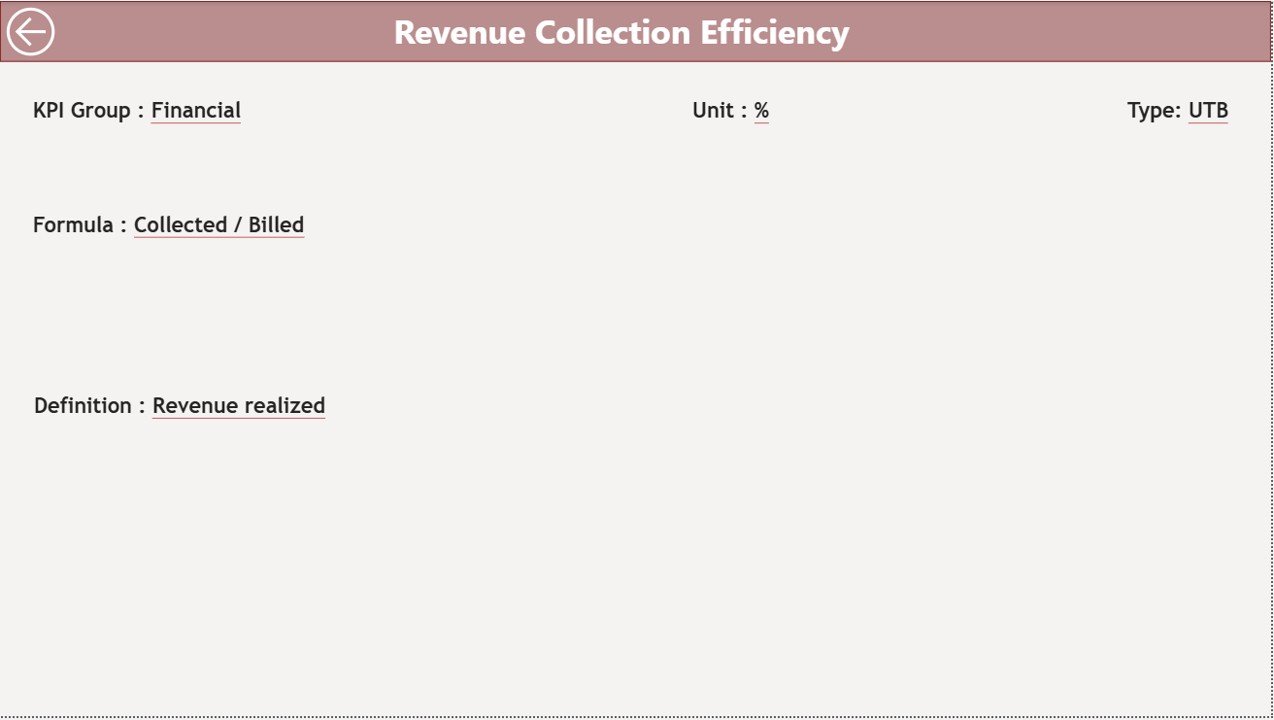
🔹 KPI Definition Page
-
KPI formula and calculation logic
-
KPI definition and unit
-
KPI type (LTB / UTB)
-
Drill-through navigation with back button
🔹 Excel Input Sheets
-
Actual performance data
-
Target values
-
KPI master and definitions
🛠️ How to Use the Power Distribution KPI Dashboard
1️⃣ Enter actual and target values in the provided Excel sheets
2️⃣ Save the Excel file
3️⃣ Refresh the Power BI dashboard
4️⃣ Use slicers to analyze performance instantly
No advanced Power BI knowledge required. If you can update Excel, you can operate this dashboard with confidence.
👥 Who Can Benefit from This Power Distribution KPI Dashboard
🏭 Power distribution managers
⚙️ Operations and maintenance teams
📊 Reliability and asset management teams
💼 Finance and planning departments
📑 Regulatory and compliance teams
🏢 Senior leadership and executives
Whether you manage a small utility or a large distribution network, this dashboard scales with your needs.
Click here to read the Detailed blog post
Watch the step-by-step video tutorial:


Reviews
There are no reviews yet.