Managing power distribution operations without clear performance visibility is risky, inefficient, and costly. When critical KPIs are scattered across multiple spreadsheets, identifying outages, losses, inefficiencies, and service gaps becomes slow and reactive. That is exactly where the Power Distribution KPI Dashboard in Excel becomes a game-changer.
This ready-to-use Excel dashboard is designed to help power distribution companies track, analyze, and improve operational performance using structured KPIs, automated calculations, and visual indicators—all inside Microsoft Excel. No complex software. No heavy learning curve. Just actionable insights at your fingertips.
Whether you manage reliability, efficiency, compliance, or customer service KPIs, this dashboard transforms raw operational data into clear, decision-ready insights.
🚀 Key Features of Power Distribution KPI Dashboard in Excel
⚡ Centralized KPI Monitoring – Track all power distribution KPIs in one structured Excel dashboard
📊 MTD & YTD Performance Tracking – Monitor Month-to-Date and Year-to-Date performance instantly
🎯 Target vs Actual Comparison – Identify gaps with automated variance analysis
📈 Previous Year Analysis – Measure improvement with PY vs Actual comparisons
🔽🔼 Conditional Formatting Indicators – Up/down arrows highlight performance status
🧭 Smart Navigation Panel – One-click access to all dashboard sections
🧠 KPI Definition Reference – Clear formulas, units, and definitions for standardization
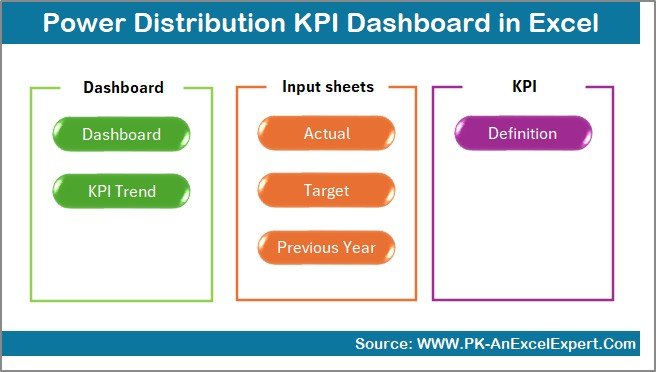
📦 What’s Inside the Power Distribution KPI Dashboard in Excel
This digital product includes 7 well-structured Excel worksheets, each designed for a specific analytical purpose:
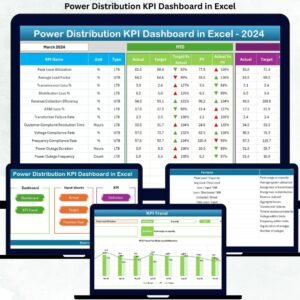
📌 Summary Page
Acts as the home screen with 6 navigation buttons, allowing users to move across the dashboard instantly.
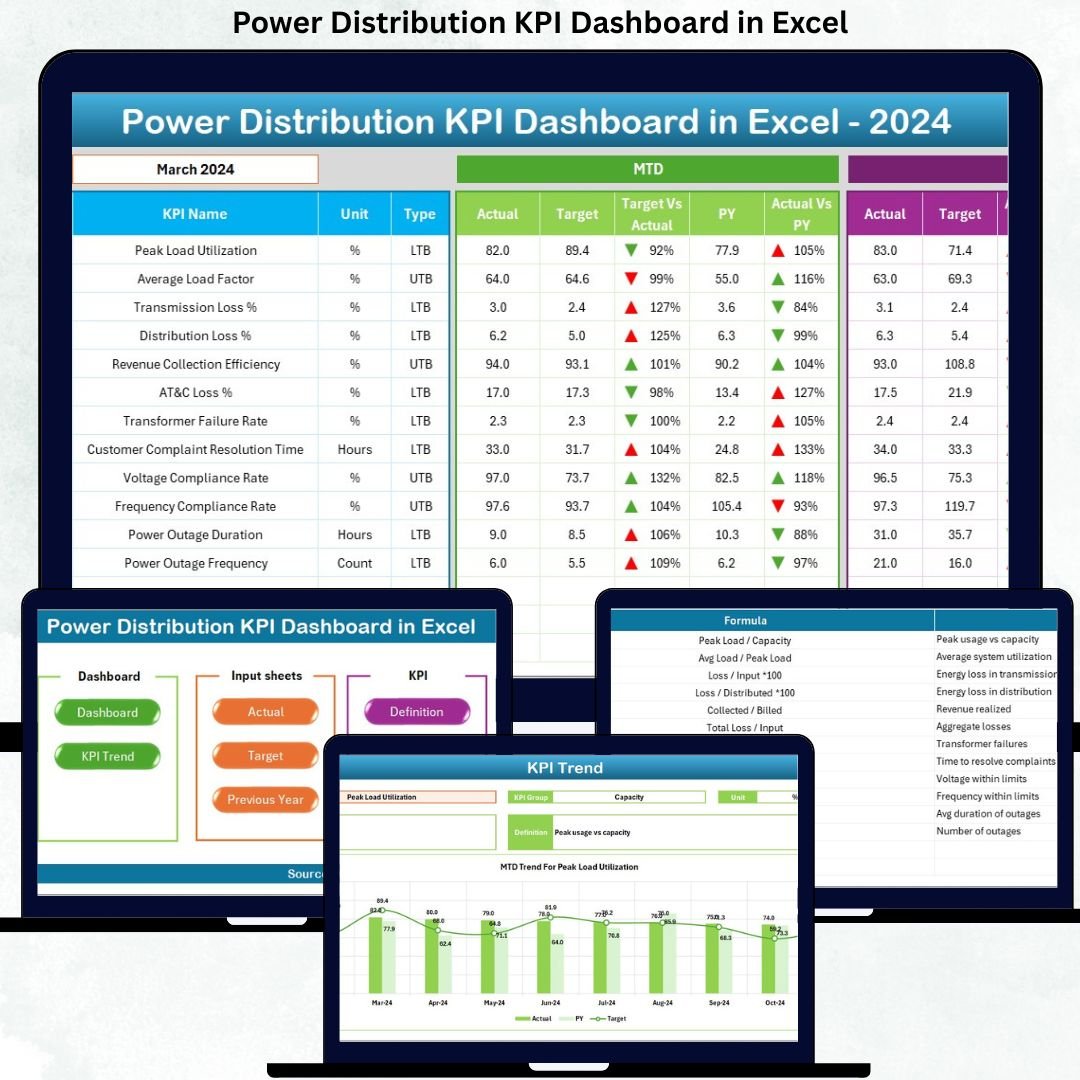
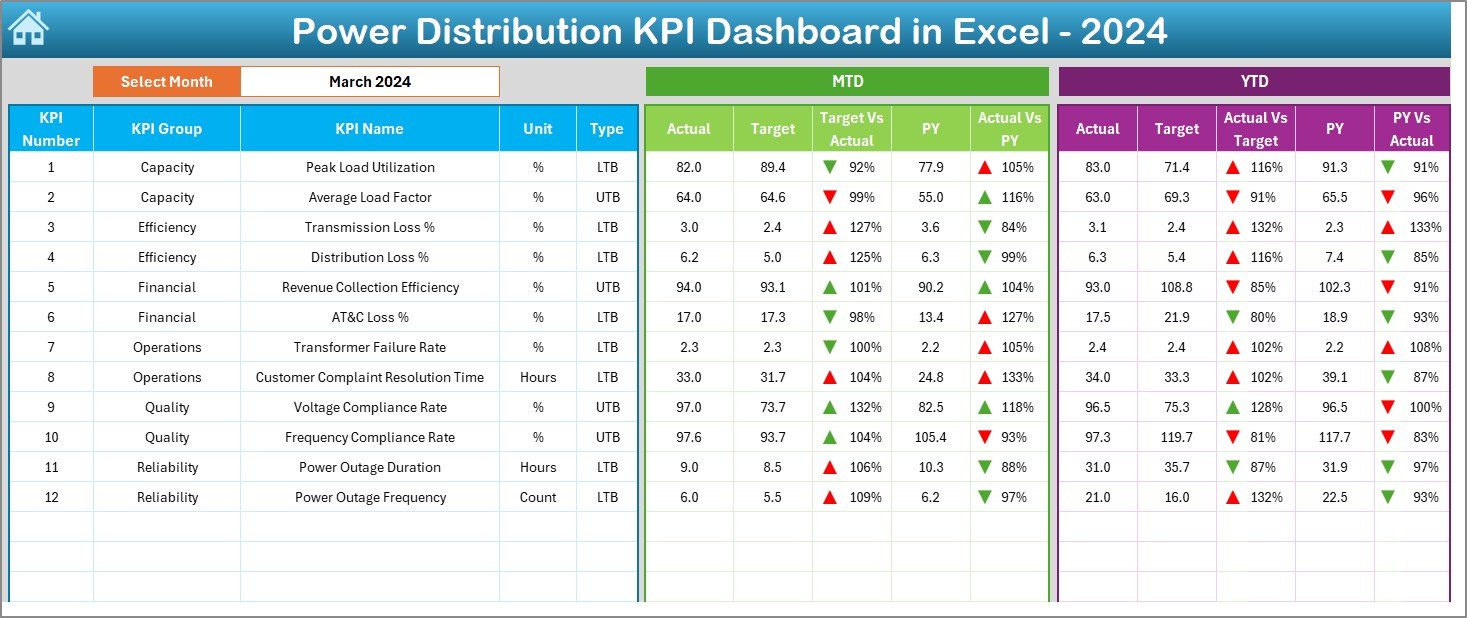
📌 Dashboard Sheet
The core reporting page showing:
-
Month selection (drop-down driven)
-
MTD & YTD Actual, Target, and Previous Year values
-
Target vs Actual and PY vs Actual comparisons
-
Visual performance indicators using conditional formatting
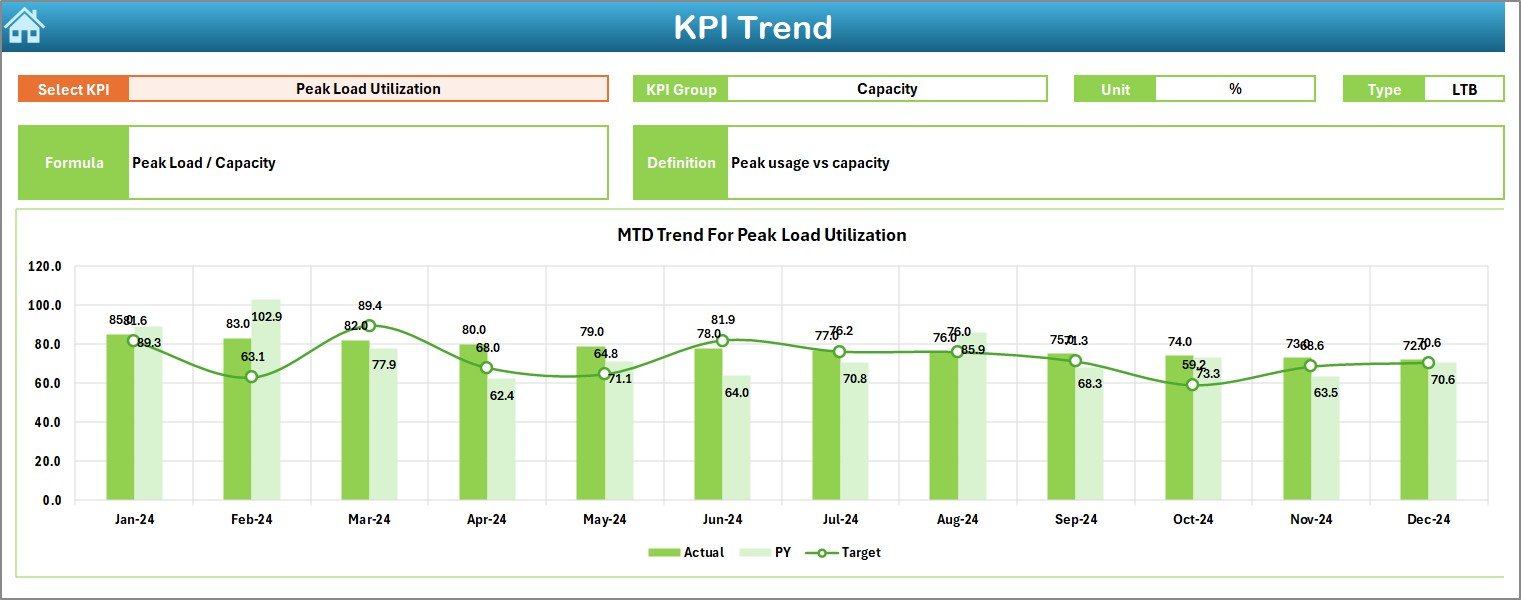
📌 Trend Sheet
Analyze KPI performance over time with:
-
KPI-wise MTD trend charts
-
KPI-wise YTD trend charts
-
KPI group, unit, type, formula, and definition visibility
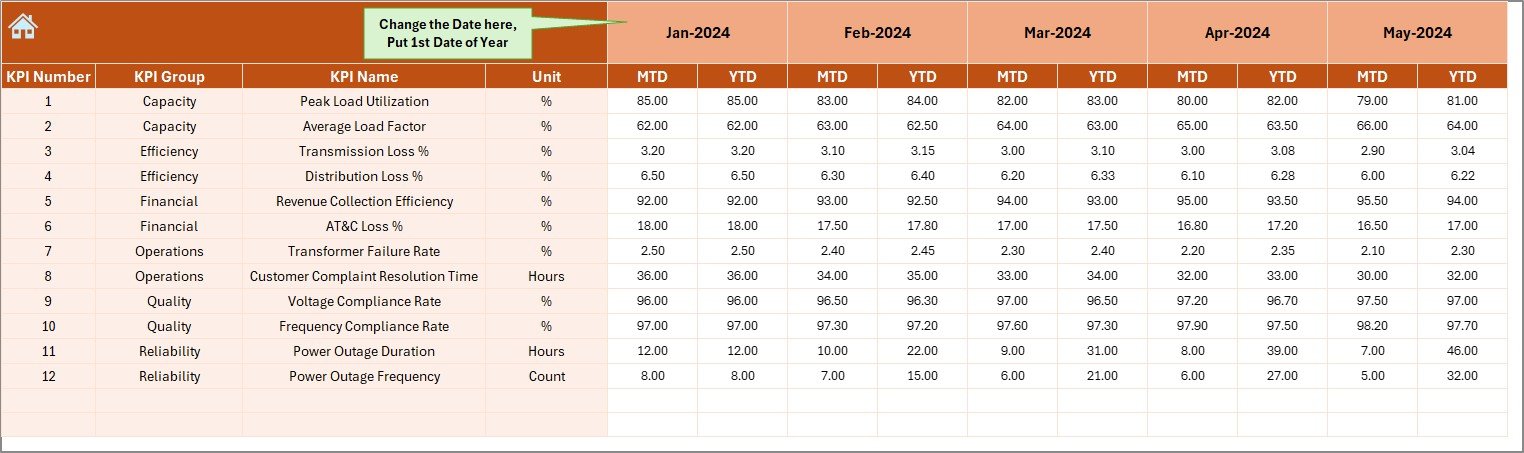
📌 Actual Numbers Input Sheet
Enter monthly MTD and YTD actual values easily with controlled inputs.
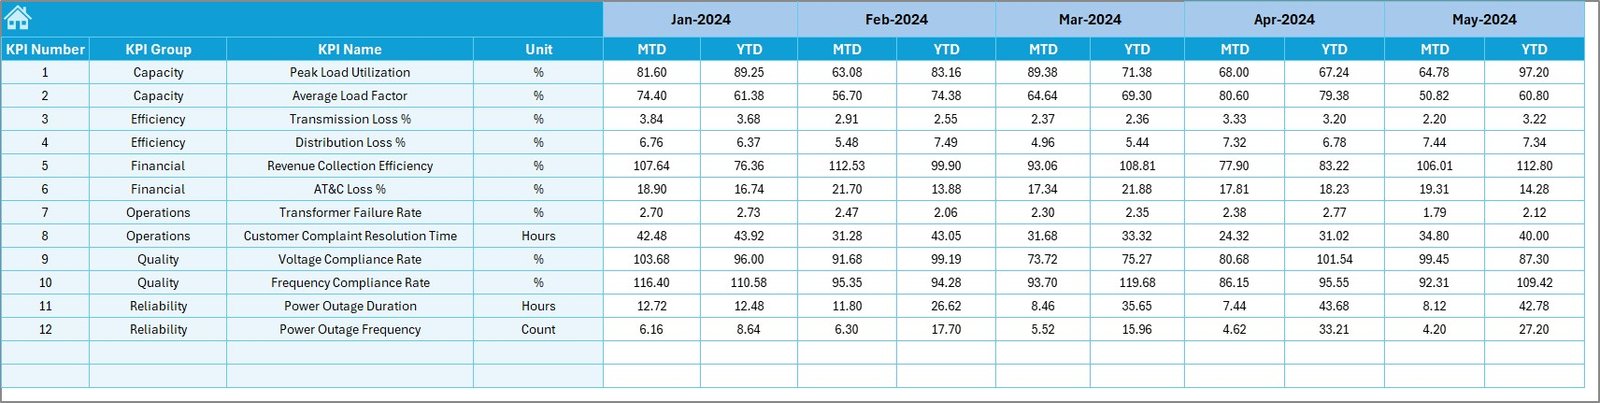
📌 Target Sheet
Maintain KPI targets separately for clear and accurate comparisons.
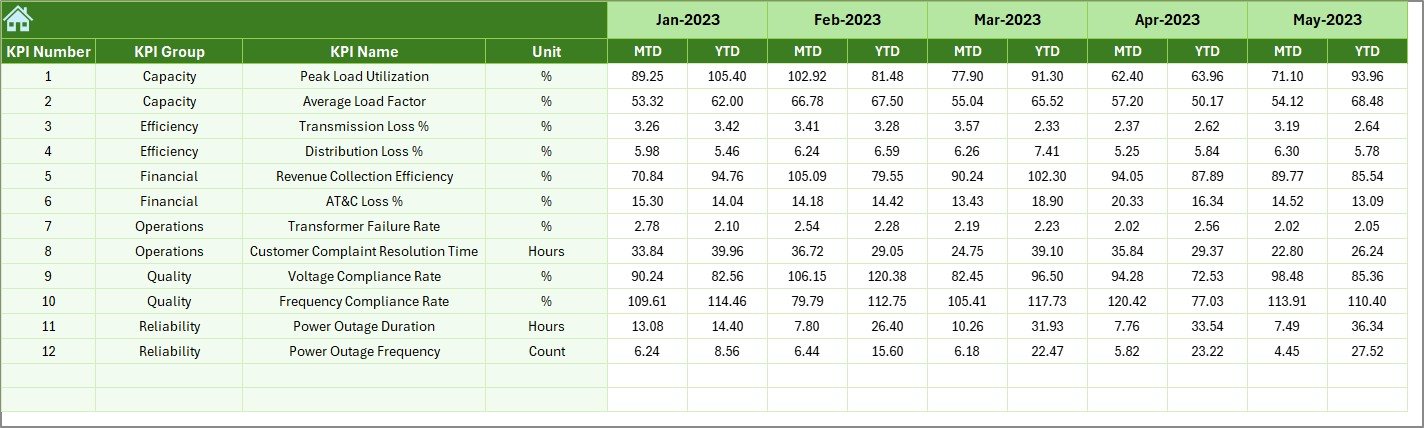
📌 Previous Year Numbers Sheet
Store historical data for year-on-year performance evaluation.
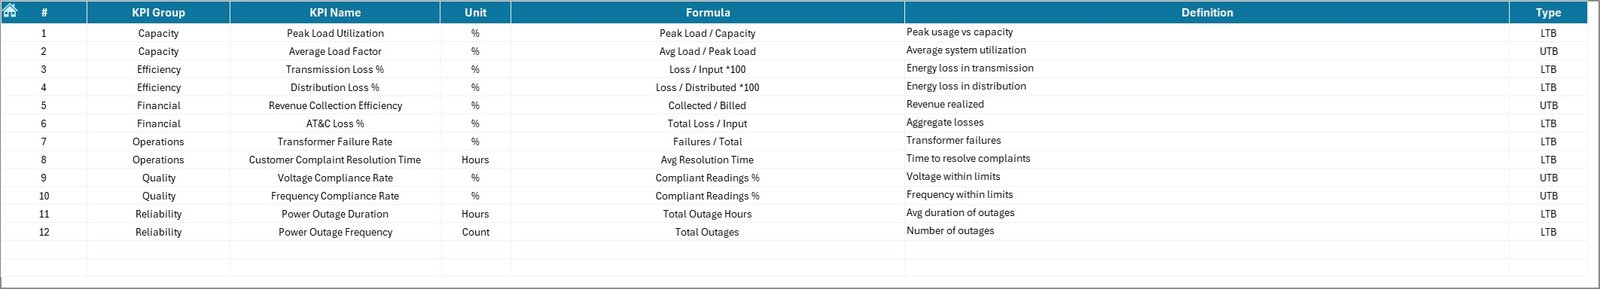
📌 KPI Definition Sheet
A standardized reference containing KPI names, units, formulas, and definitions.
🛠️ How to Use the Power Distribution KPI Dashboard in Excel
Using this dashboard is simple—even for non-technical users:
1️⃣ Enter actual performance data in the Actual Numbers Input Sheet
2️⃣ Update KPI targets in the Target Sheet
3️⃣ Maintain previous year data for comparison
4️⃣ Select the reporting month from the dashboard
5️⃣ Instantly analyze KPIs using visuals, trends, and indicators
Because calculations and visuals are automated, you spend less time preparing reports and more time improving performance.
👥 Who Can Benefit from This Power Distribution KPI Dashboard in Excel
This dashboard is ideal for:
⚙️ Power Distribution Companies
⚡ Utility Service Providers
🧑🔧 Electrical Maintenance & Operations Teams
📋 Compliance & Audit Departments
📈 Energy Operations Managers
🏛️ Government Electricity Boards
🏢 Private Power Distribution Firms
If your organization relies on Excel and needs clear KPI visibility, this dashboard is built for you.
Click here to read the Detailed blog post
Watch the step-by-step video tutorial:


Reviews
There are no reviews yet.