Running a profitable poultry farm requires consistent monitoring, fast decisions, and crystal-clear insights. Poultry Farming KPI Dashboard in Power BI But with daily changes in feed cost, mortality, egg production, flock health, and operational expenses, keeping everything under control becomes challenging—especially when data is spread across multiple sheets or systems.
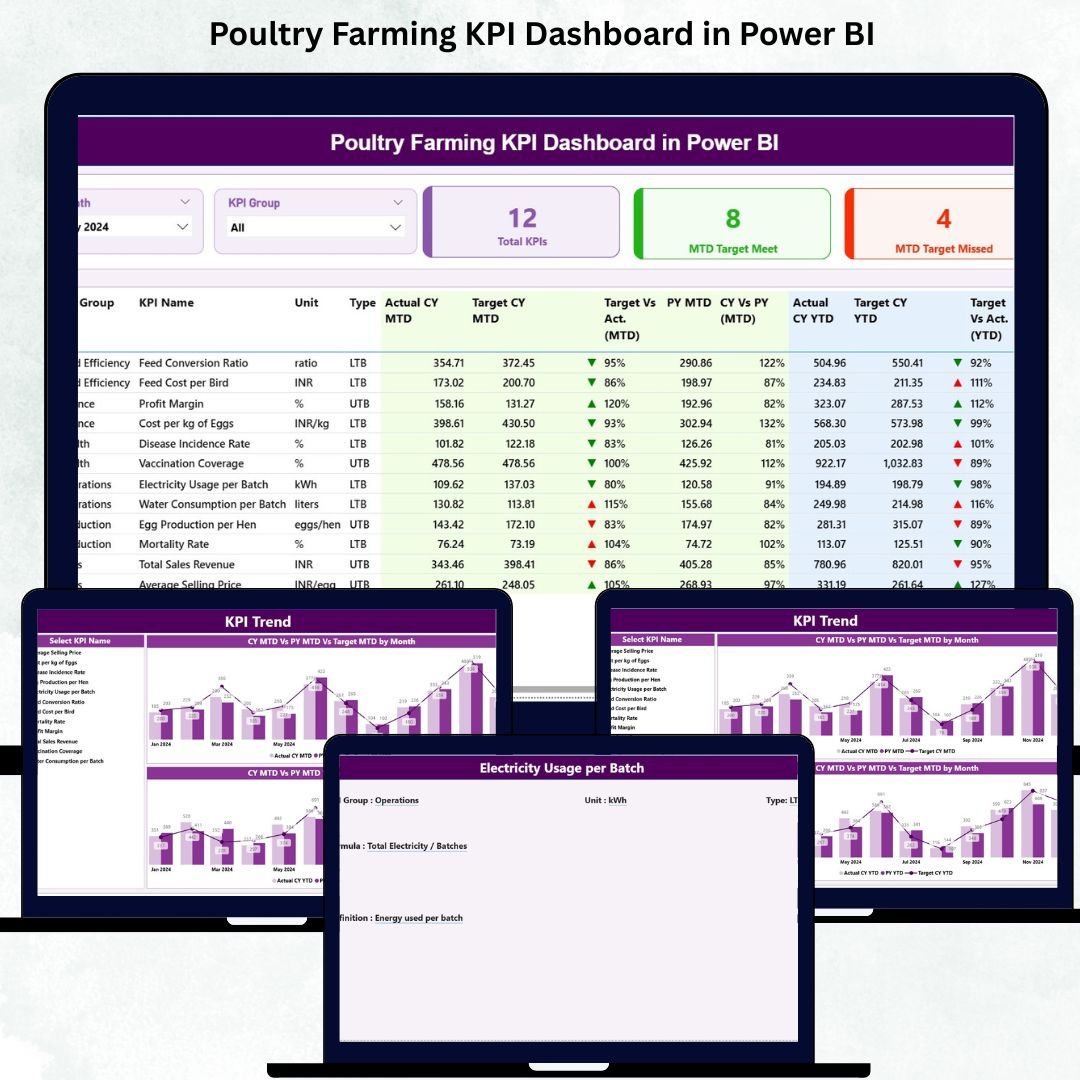
That’s where the Poultry Farming KPI Dashboard in Power BI transforms your entire farm management. Poultry Farming KPI Dashboard in Power BI This ready-to-use digital dashboard turns complex poultry data into simple, actionable visuals. Poultry Farming KPI Dashboard in Power BI Whether you manage thousands of birds, multiple batches, or a fully automated poultry operation, this dashboard gives you real-time clarity and complete confidence in your decisions.
Designed for poultry farm owners, managers, supervisors, analysts, and agribusiness teams—this dashboard helps you track KPIs, compare trends, monitor health, reduce cost, improve production, and maximize profitability.
🌟 Key Features of Poultry Farming KPI Dashboard in Power BI
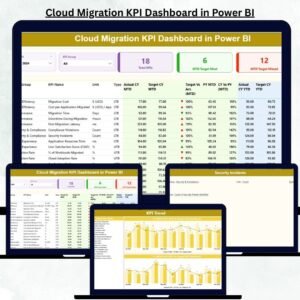
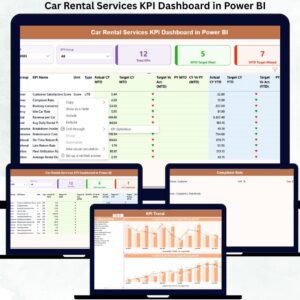
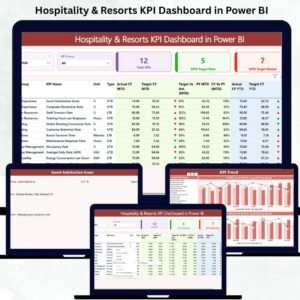
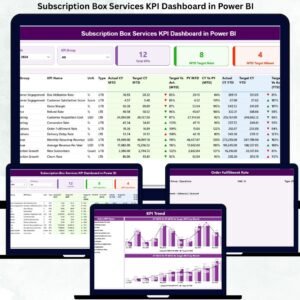
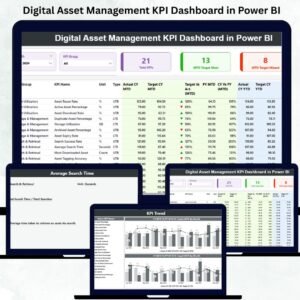
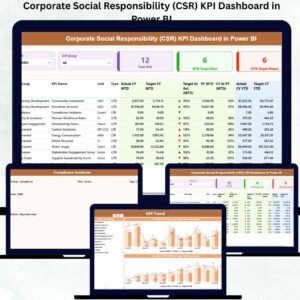
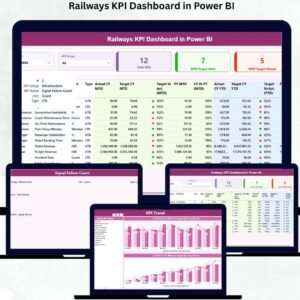
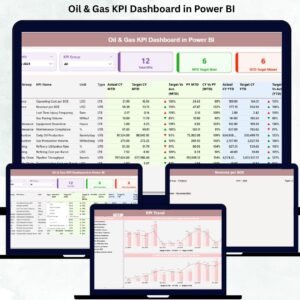
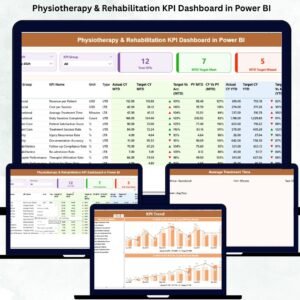
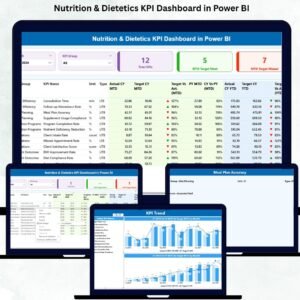
1️⃣ Summary Page – Your Poultry Farm’s Performance Snapshot 🧭
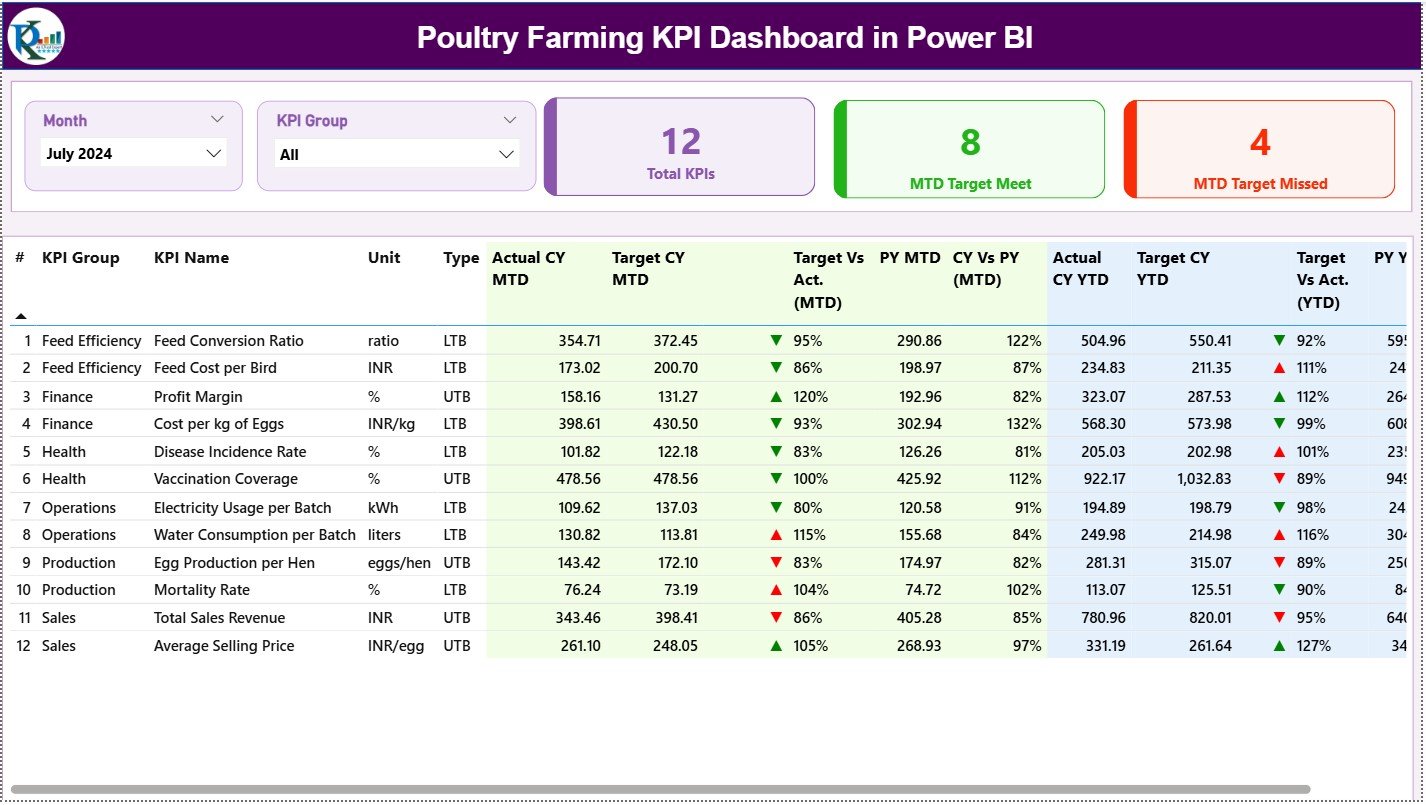
The Summary Page gives you instant visibility into your farm’s performance for any selected month.
-
Month slicer for quick filtering
-
KPI Group slicer (production, feed, hatchery, health, operations)
-
KPI cards showing Total KPIs, Target Met, and Target Missed
A detailed KPI table below shows:
-
Actual vs Target (MTD & YTD)
-
CY vs PY comparison
-
Trend icons: green ▲ for good, red ▼ for poor performance
-
KPI units, types (LTB/UTB), and KPIn numbers
This single page provides a 360° view of poultry operations.
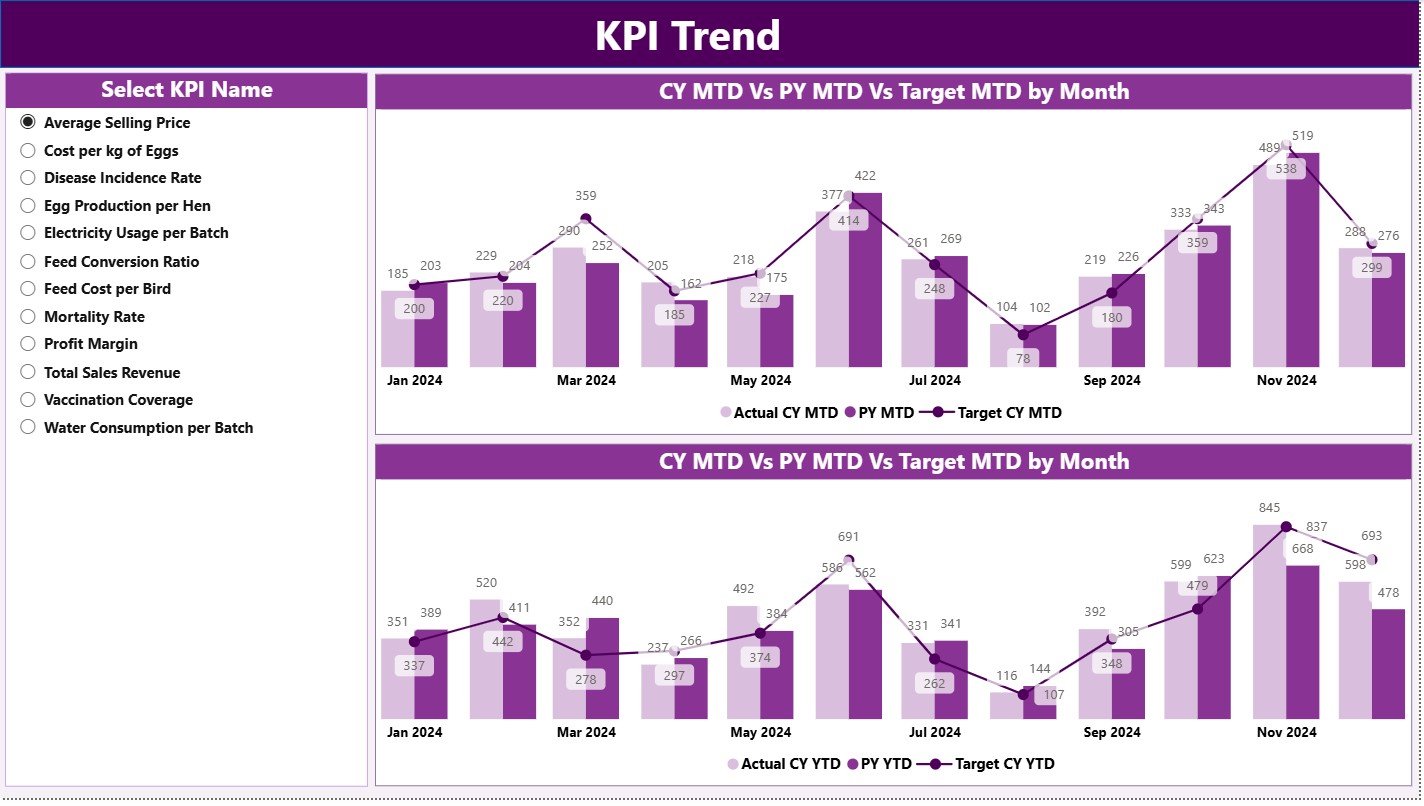
2️⃣ KPI Trend Page – Compare Month-to-Month & Year-to-Year Trends 📈
Understand how each KPI behaves over time.
-
MTD Combo Chart (Actual vs Target vs Previous Year)
-
YTD Combo Chart (cumulative performance)
-
KPI Name slicer for easy switching
Spot changes in feed conversion ratio, egg production rate, mortality, or revenue instantly.
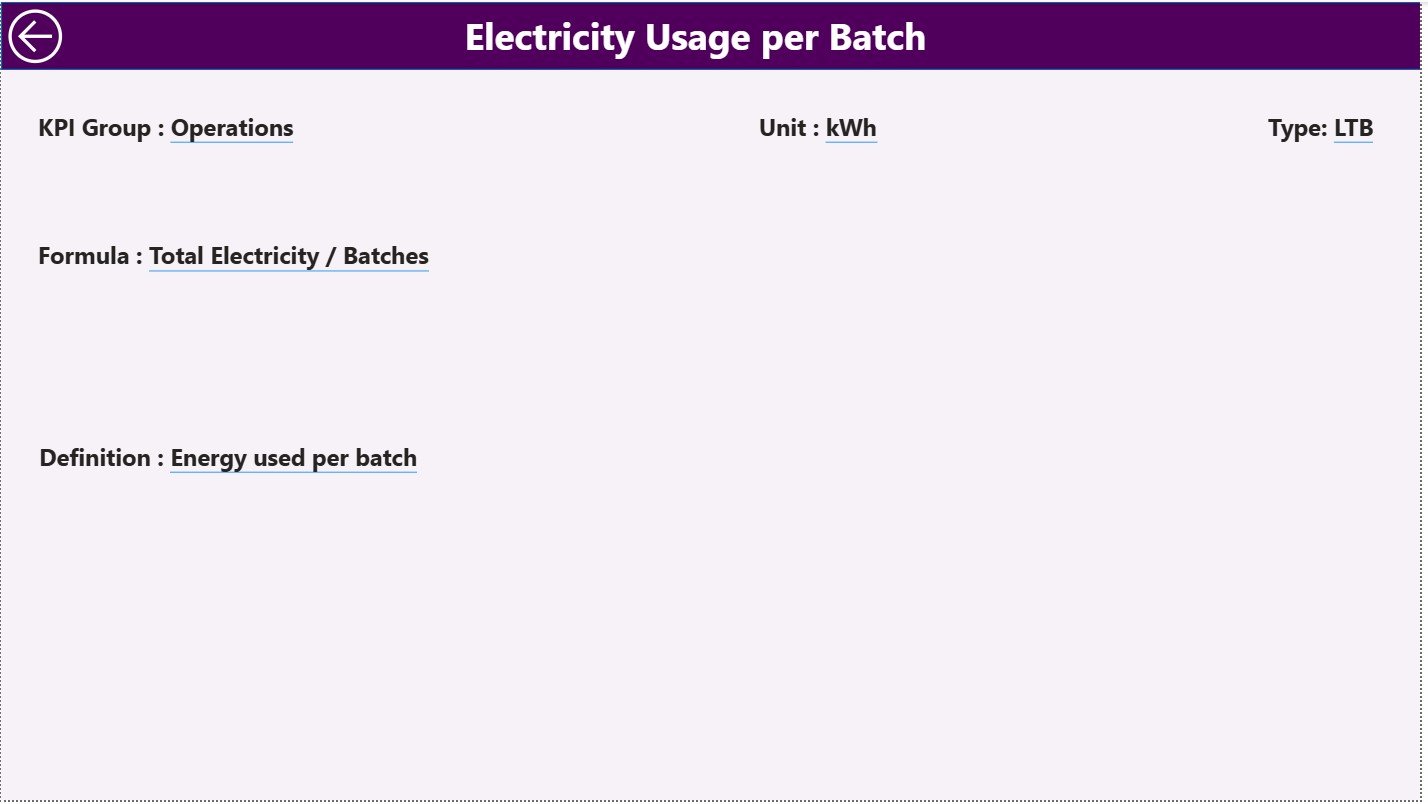
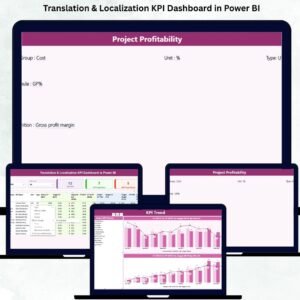
3️⃣ KPI Definition Page – Clear Understanding for Every KPI 📘
This hidden drill-through page reveals:
-
KPI Name, Number & Group
-
Formula
-
Definition
-
Unit
-
KPI Type (LTB / UTB)
Perfect for onboarding new team members and maintaining reporting accuracy.
📦 What’s Inside the Poultry Farming KPI Dashboard
This product gives you everything you need to implement professional poultry analytics:
✔ Ready-to-use Power BI Dashboard
-
Summary Page
-
KPI Trend Page
-
KPI Definition Page
✔ Structured Excel Data File (3 Sheets)
-
Input Actual
-
Input Target
-
KPI Definition
✔ Predefined KPIs with formulas
Just update your farm data and refresh the dashboard—no technical skills required.
✔ Interactive visuals & conditional formatting
Green = Positive
Red = Needs attention
✔ Drill-through KPI insights
Click any KPI to understand it deeply.
🛠 How to Use the Poultry Farming KPI Dashboard
Using the dashboard is simple, even for beginners:
1️⃣ Enter Actual Data
Update MTD & YTD values in the Input Actual sheet.
2️⃣ Enter Target Data
Add MTD & YTD targets in the Input Target sheet.
3️⃣ Update or Add KPIs
Modify KPI formulas, definitions, or units in the KPI Definition sheet.
4️⃣ Load Data into Power BI Desktop
Refresh the visuals with one click.
5️⃣ Analyze Trends, KPIs & Comparisons
Use slicers and drill-through pages for deeper insights.
👥 Who Can Benefit from This Poultry Farming KPI Dashboard?
🐔 Poultry Farm Owners
Track flock performance, mortality, production, and cost effortlessly.
📊 Farm Managers & Supervisors
Monitor operations across batches, flocks, and production cycles.
🧑🌾 Agribusiness Teams
Analyze KPIs for consistent improvement and cost control.
🧪 Researchers & Students
Use real KPI datasets for studies and research.
Whether you handle broilers, layers, breeders, or mixed operations—this dashboard brings clarity and accuracy to your everyday decisions.


Reviews
There are no reviews yet.