Managing procurement in port operations is complex, high-risk, and cost-intensive. Ports deal with continuous purchasing of fuel, heavy equipment, spare parts, dredging materials, maintenance services, IT infrastructure, safety systems, and vendor contracts. Even a small inefficiency can quickly lead to budget overruns, supplier delays, and compliance risks.
That is exactly why the Port Procurement KPI Dashboard in Excel is designed as a powerful, practical, and business-ready solution for modern port operations.
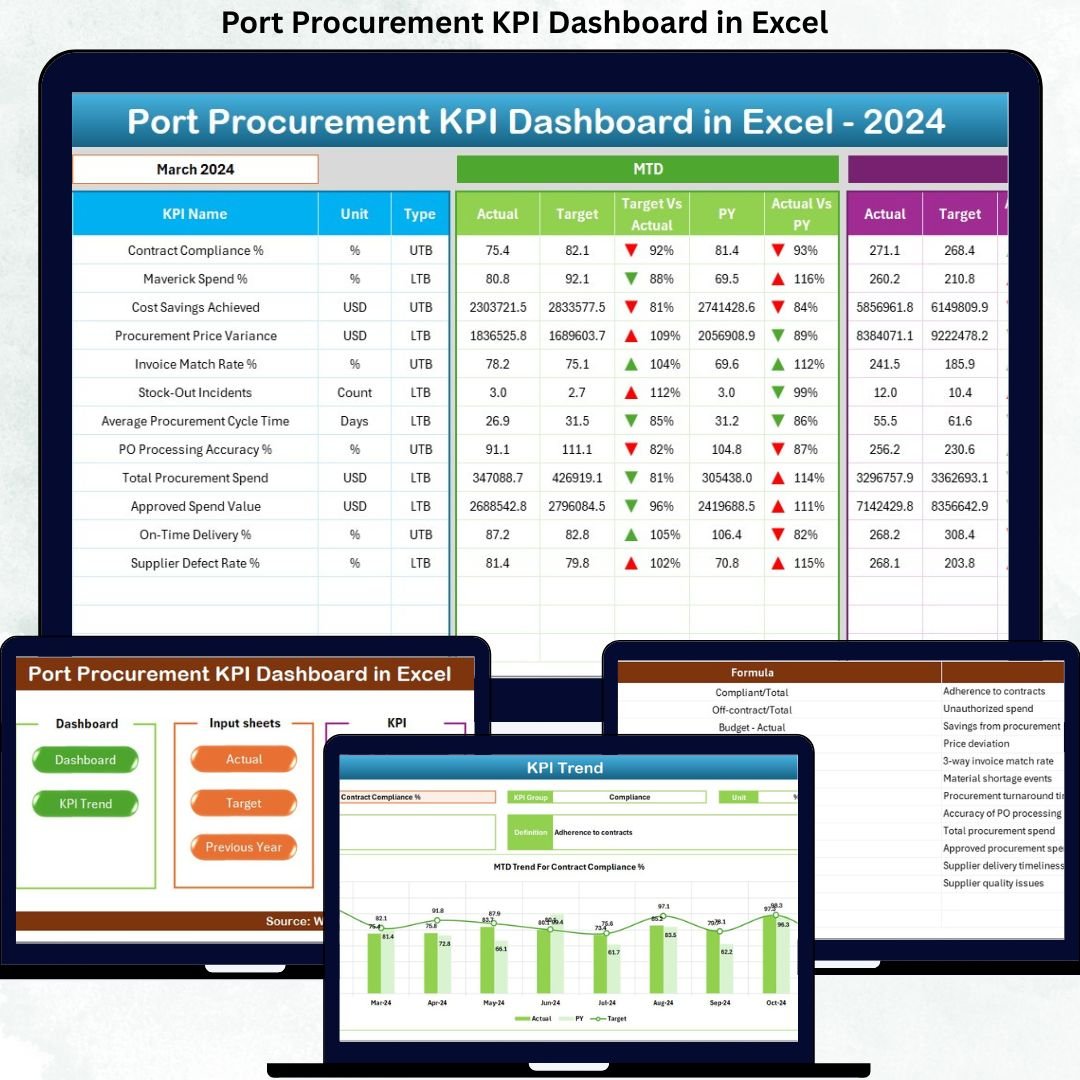
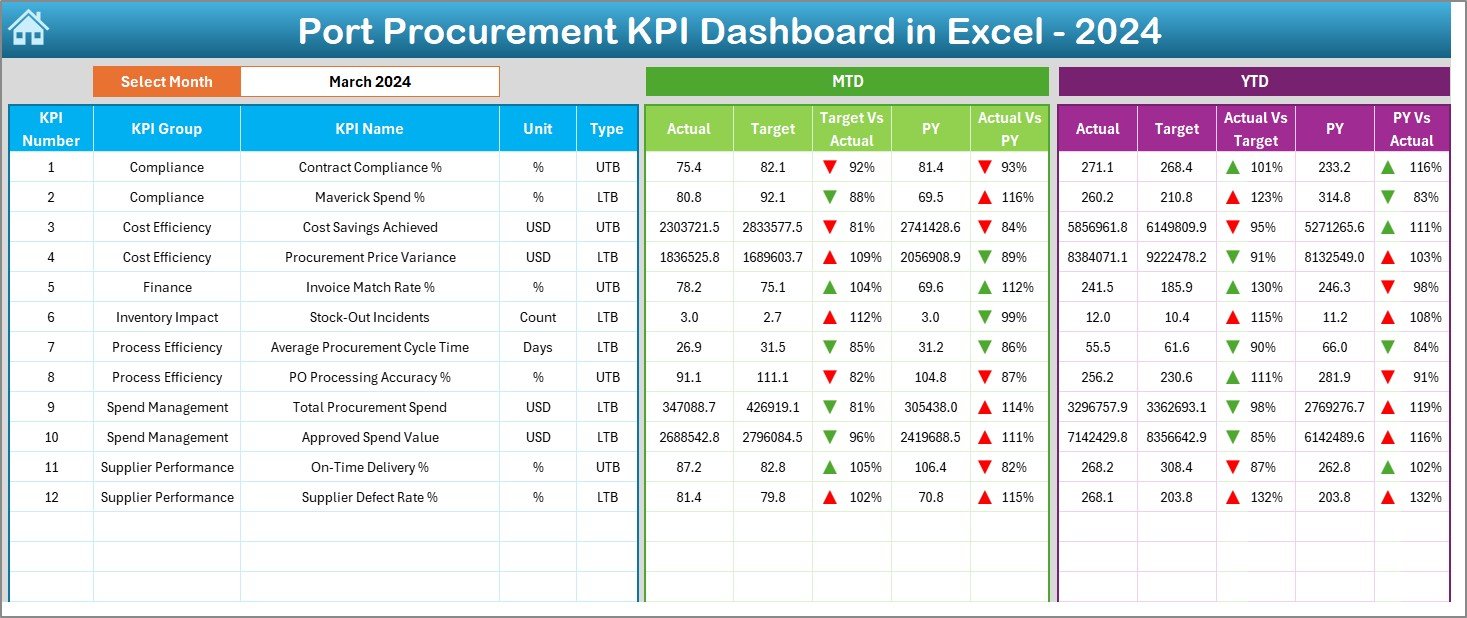
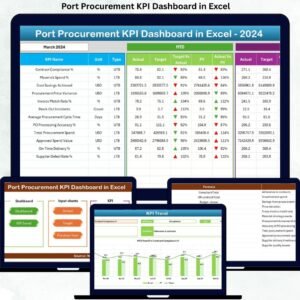
This professionally built Excel dashboard converts raw procurement data into clear KPIs, trends, and performance indicators, allowing procurement teams and leadership to take faster, smarter, and data-driven decisions—without expensive BI tools or complex systems.
🚀 Key Features of Port Procurement KPI Dashboard in Excel
📊 Centralized KPI Monitoring – Track all critical procurement KPIs from one single dashboard
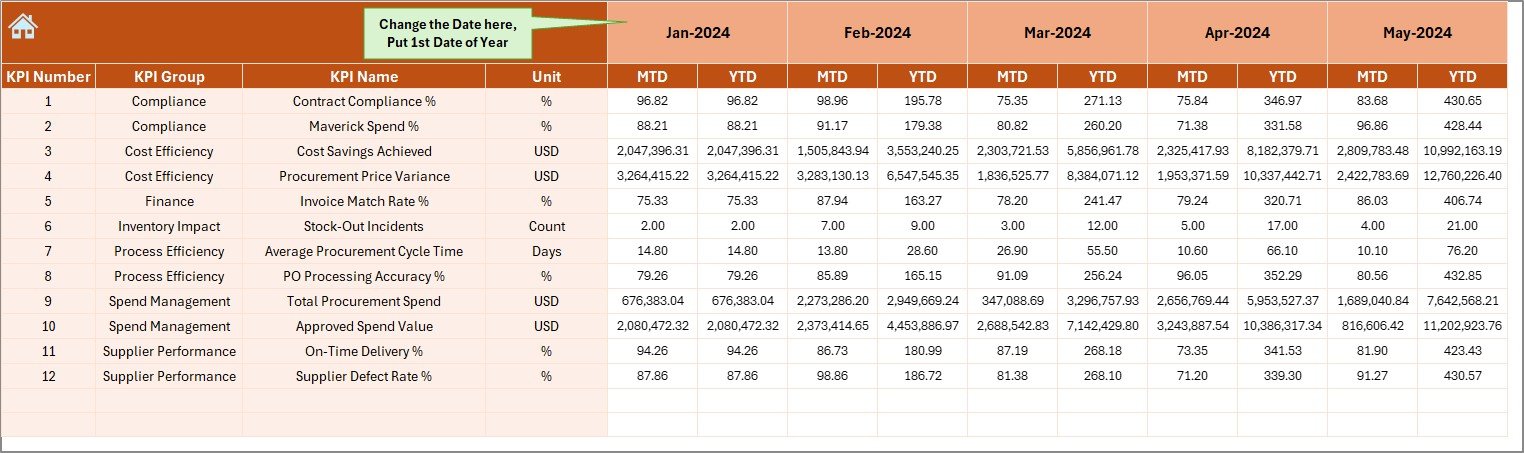
📅 Dynamic Month Selection – Change the reporting month instantly using a simple drop-down
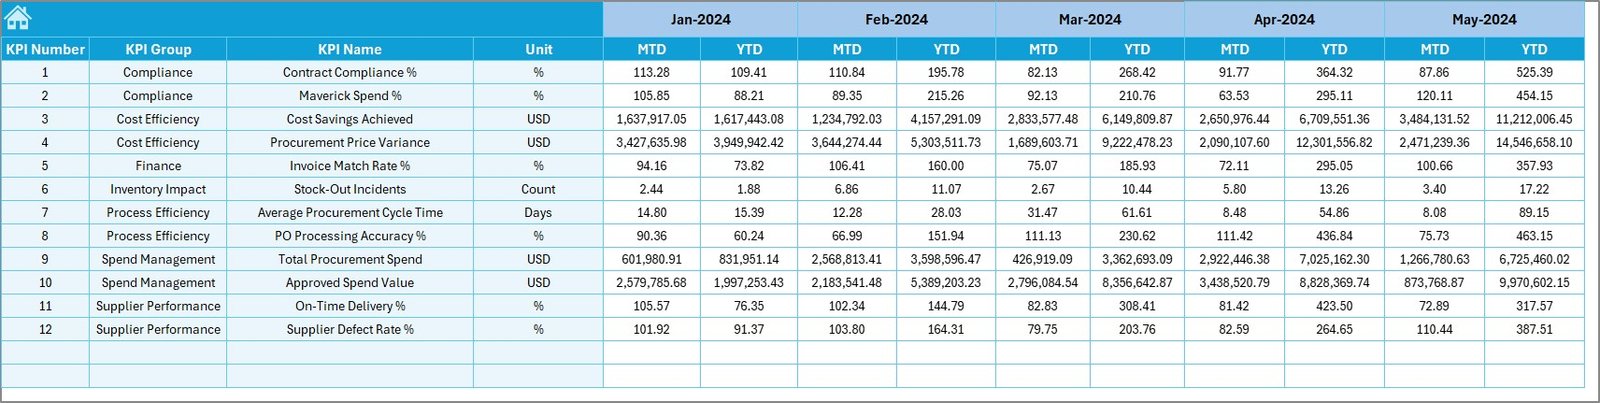
📈 MTD & YTD Performance Tracking – Monitor Monthly-to-Date and Year-to-Date performance effortlessly
🎯 Target vs Actual Analysis – Identify cost overruns and efficiency gaps in seconds
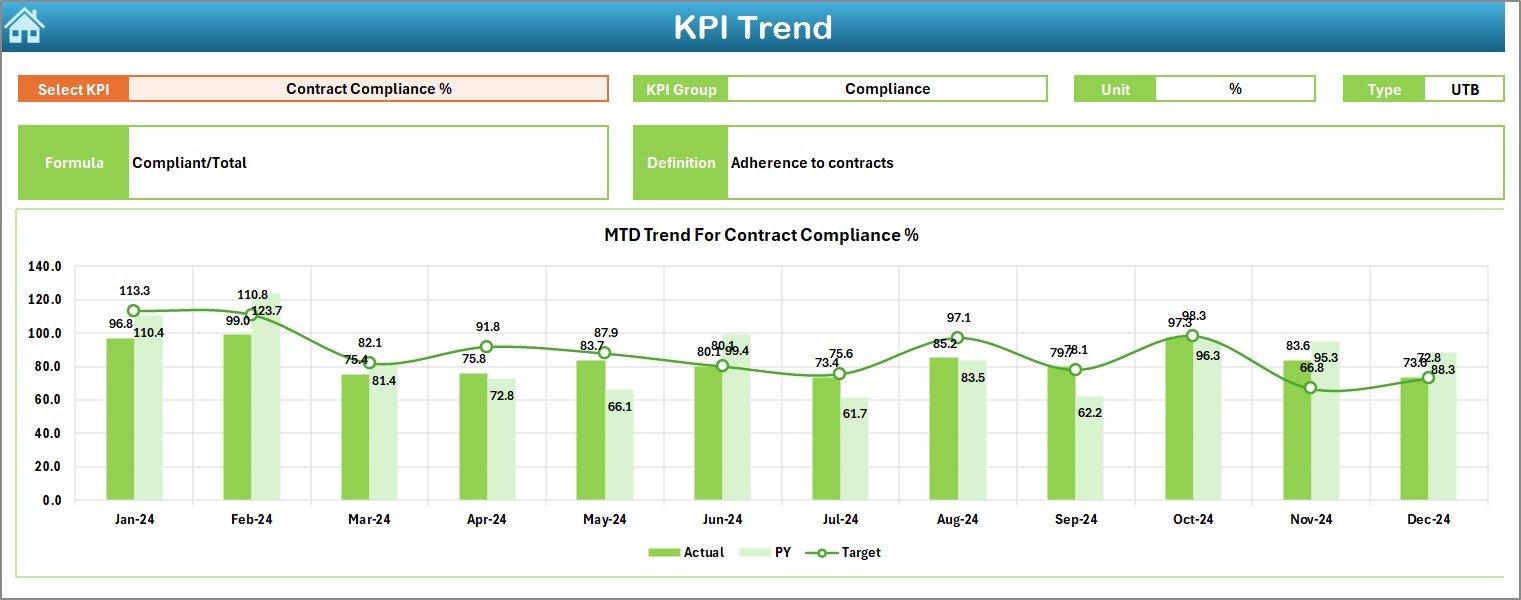
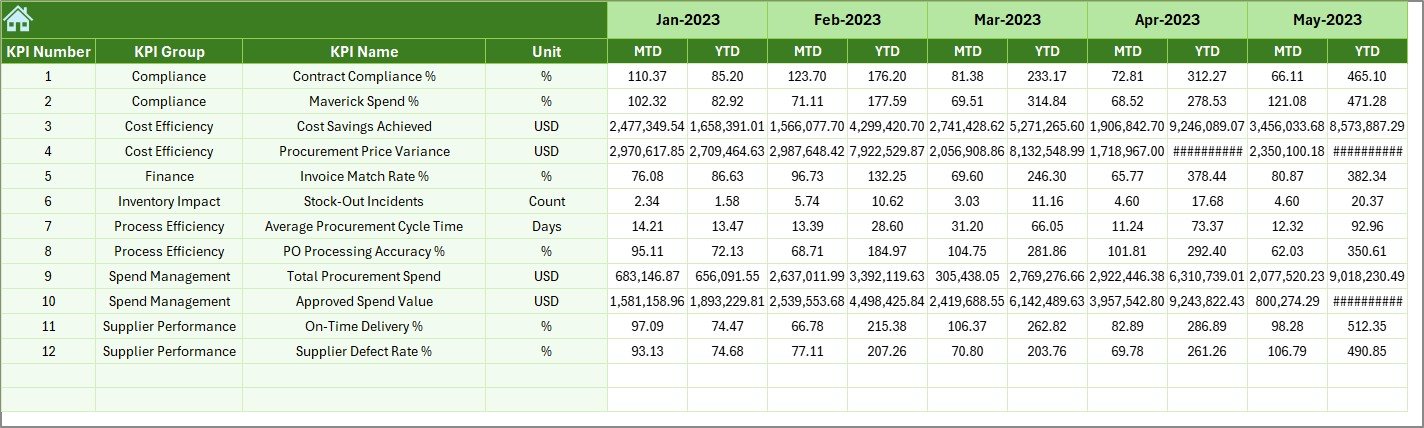
📉 Previous Year Comparison – Measure improvement or decline using historical data
🚦 Conditional Formatting Indicators – Visual arrows instantly show performance direction
🧭 Easy Navigation Summary Page – Jump between sheets using clickable buttons
💼 100% Excel-Based Solution – No coding, no BI tools, no additional software cost
📦 What’s Inside the Port Procurement KPI Dashboard in Excel
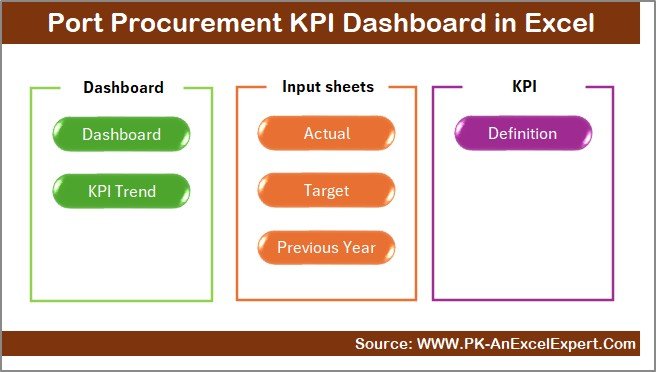
This dashboard contains 7 professionally structured worksheets, each designed to serve a specific business purpose:
📌 Summary Page – Acts as an index with navigation buttons for quick access
📌 Dashboard Sheet – Displays all procurement KPIs with MTD, YTD, targets, and comparisons
📌 Trend Sheet – Deep KPI analysis with trend charts and KPI metadata
📌 Actual Numbers Sheet – Simple input area for monthly and yearly actual values
📌 Target Sheet – Define and manage procurement targets
📌 Previous Year Sheet – Enable year-over-year performance comparison
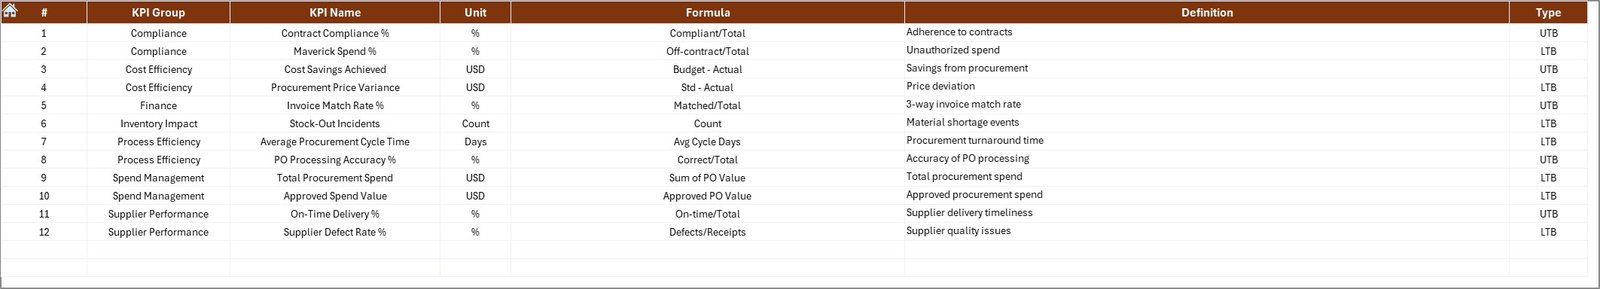
📌 KPI Definition Sheet – Standardize KPI names, formulas, units, and definitions
Together, these sheets create a structured, transparent, and audit-ready procurement reporting system.
🛠️ How to Use the Port Procurement KPI Dashboard in Excel
Using this dashboard is simple and intuitive:
1️⃣ Enter actual procurement data in the Actual Numbers Sheet
2️⃣ Define targets in the Target Sheet
3️⃣ Add last year’s values in the Previous Year Sheet
4️⃣ Select the reporting month from the Dashboard (Cell D3)
5️⃣ Instantly view updated KPIs, variances, and trends
No advanced Excel skills are required. If you know basic Excel, you can start using this dashboard immediately.
👥 Who Can Benefit from This Port Procurement KPI Dashboard?
This dashboard is ideal for:
⚓ Port Procurement Managers – Gain control over purchasing performance
💰 Finance & Cost Control Teams – Monitor cost variance and budget discipline
🏗️ Operations Managers – Ensure procurement supports smooth port operations
🤝 Vendor Management Teams – Track supplier efficiency and delivery performance
📋 Internal Audit Teams – Ensure KPI consistency and governance
🏛️ Senior Port Authorities – Get high-level insights without technical complexity
Whether you manage a small port or a large port authority, this dashboard adapts easily.
Click here to read the Detailed Blog Post
Watch the step-by-step video tutorial:
Visit our YouTube channel to learn step-by-step video tutorials:
YouTube.com/@PKAnExcelExpert


Reviews
There are no reviews yet.