Managing contracts in a port environment is complex, data-heavy, and time-sensitive. With multiple vendors, service providers, and compliance requirements, tracking contract performance manually becomes inefficient and risky.
That’s exactly where the Port Contract Management KPI Dashboard in Power BI becomes a game-changer.
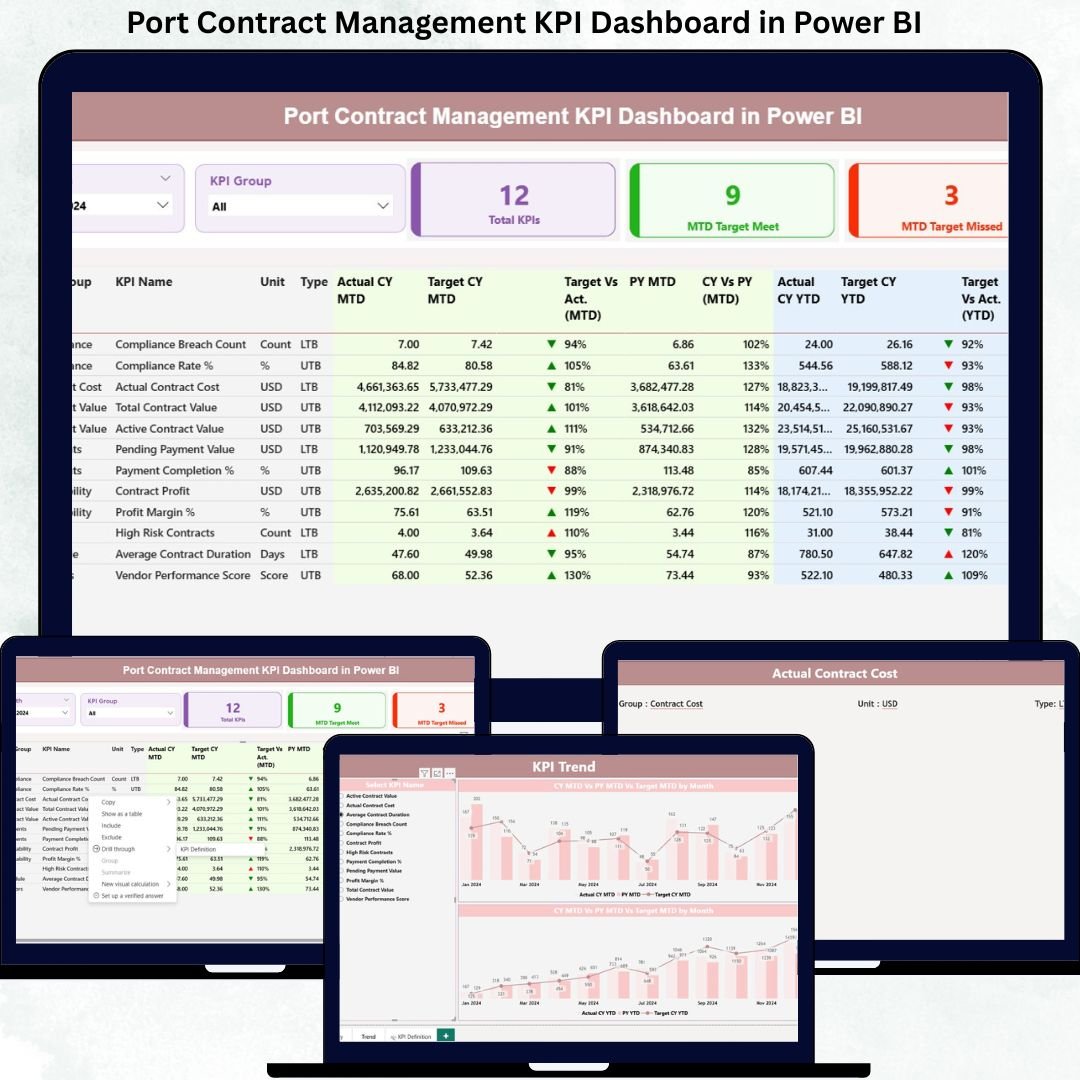
This professionally designed dashboard helps port authorities and operations teams monitor contract performance, track KPIs, analyze trends, and make data-driven decisions — all from a single interactive Power BI report.
Built using Excel as a data source and Power BI for visualization, this dashboard ensures flexibility, clarity, and real-time performance monitoring without technical complexity.
🚀 Key Features of the Port Contract Management KPI Dashboard
✅ Interactive KPI Monitoring – Track contract KPIs in real time with dynamic visuals.
✅ MTD & YTD Performance Tracking – Monitor monthly and yearly performance effortlessly.
✅ Target vs Actual Comparison – Instantly identify underperforming contracts.
✅ Drill-Through KPI Analysis – View detailed KPI definitions with one click.
✅ Excel-Based Data Input – Easy to maintain and update without coding.
✅ Power BI Visualization – Clean, professional, and decision-focused layout.
✅ User-Friendly Navigation – Simple slicers and page navigation.
✅ Scalable Design – Add more KPIs or contract categories anytime.
📊 What’s Inside the Port Contract Management KPI Dashboard
This dashboard is structured into three powerful analytical pages, each designed to provide meaningful insights.
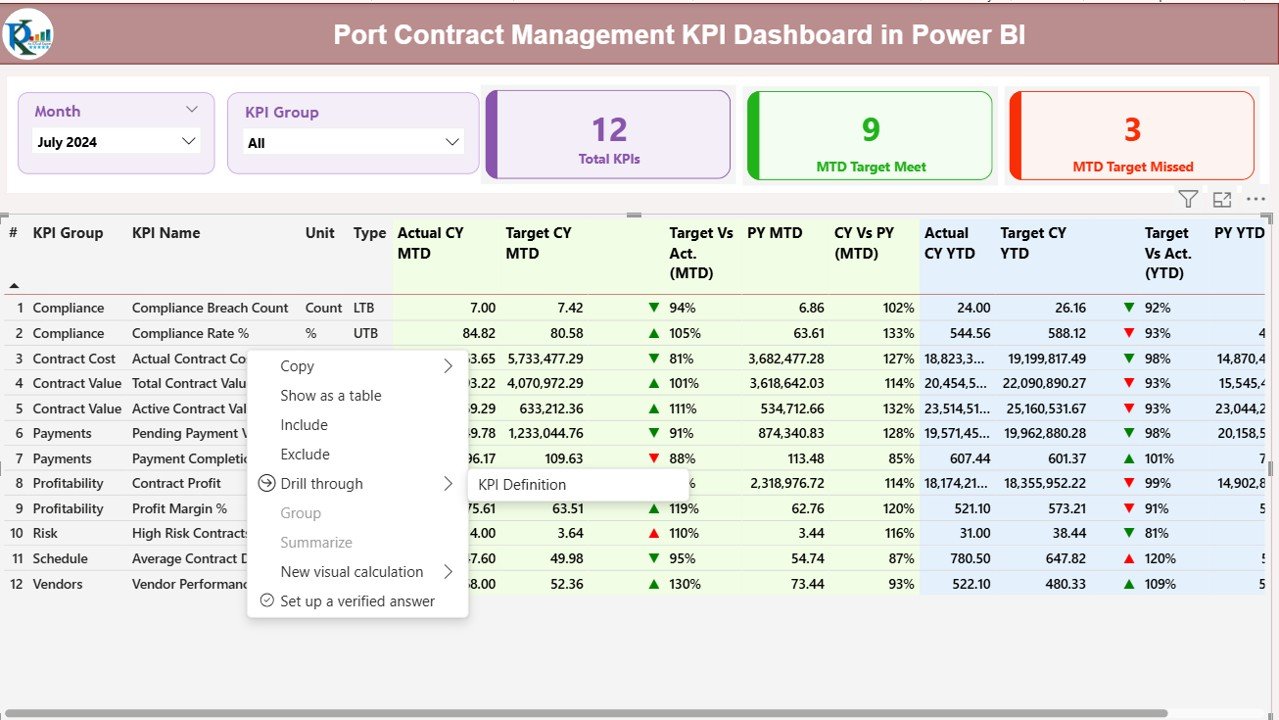
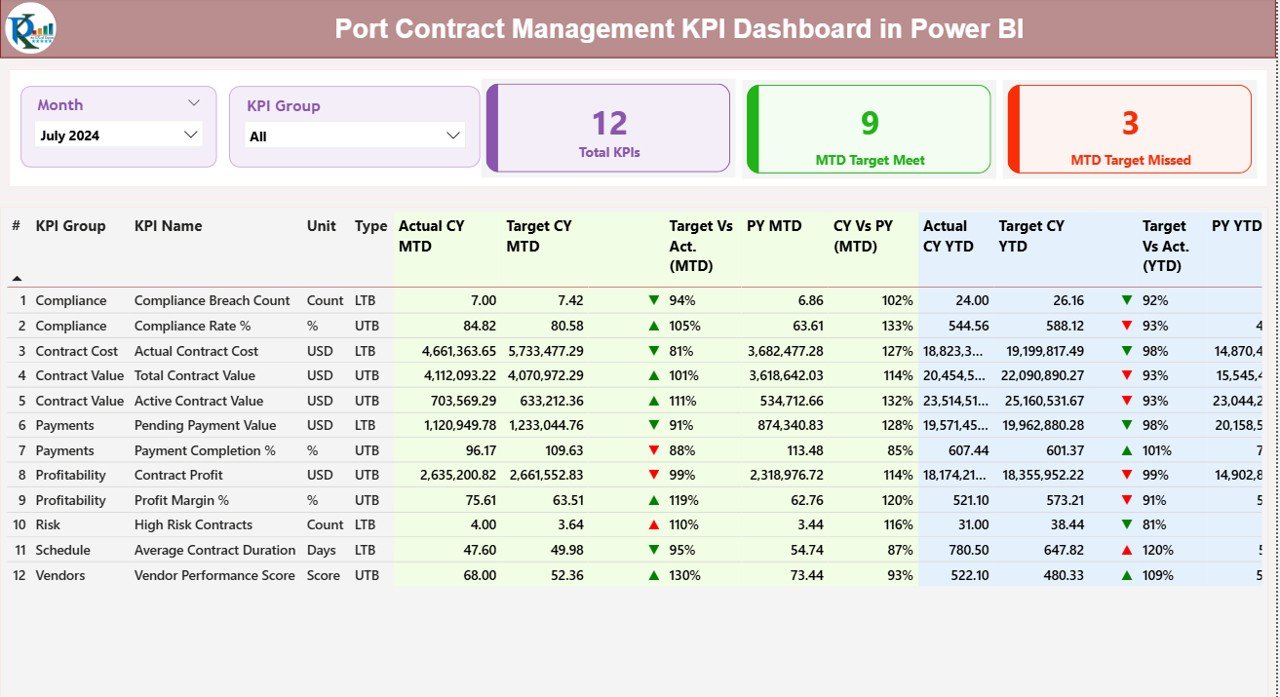
🔹 Summary Page – Complete KPI Overview
The Summary Page gives a quick snapshot of overall performance.
Includes:
-
Month slicer
-
KPI Group slicer
-
Total KPI count
-
MTD Target Met count
-
MTD Target Missed count
📌 Detailed KPI Table Includes:
-
KPI Number
-
KPI Group
-
KPI Name
-
Unit of Measurement
-
KPI Type (LTB / UTB)
-
Actual CY MTD
-
Target CY MTD
-
Target vs Actual (%)
-
Previous Year MTD
-
CY vs PY Comparison
-
YTD Performance Indicators
This layout helps decision-makers instantly identify gaps and take corrective actions.
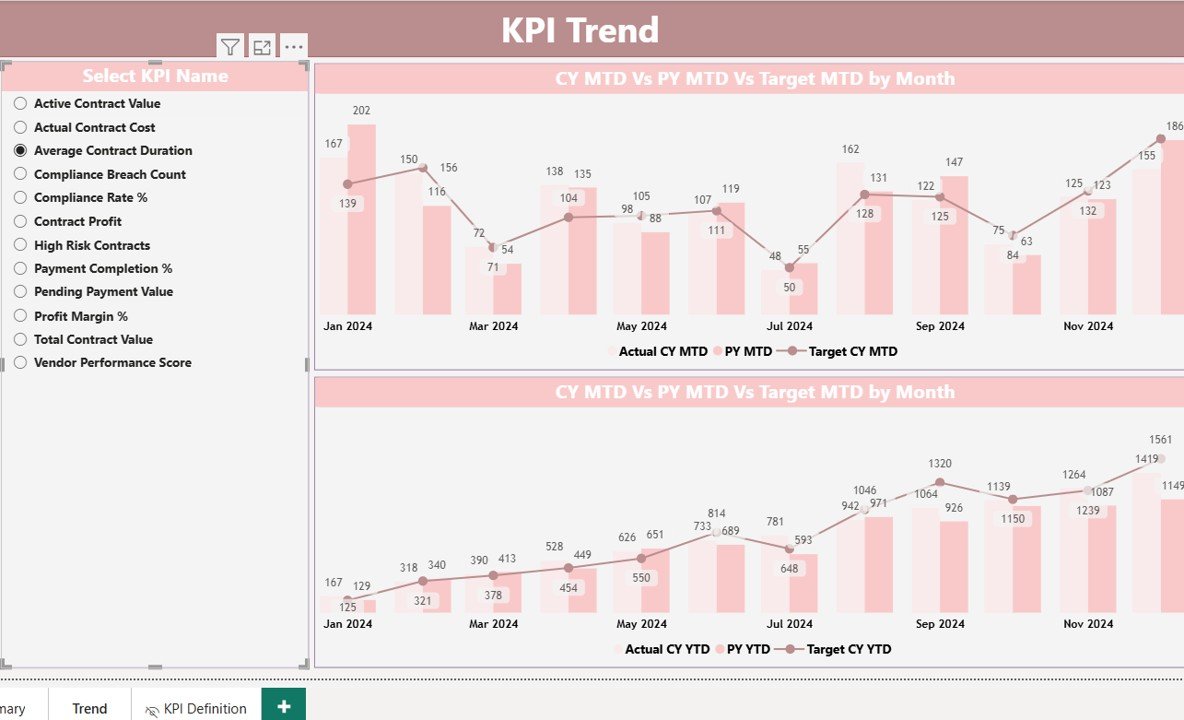
🔹 KPI Trend Page – Performance Analysis
This page focuses on trend visualization and comparison.
✔ Actual vs Target trends
✔ Current Year vs Previous Year analysis
✔ MTD and YTD performance view
✔ Interactive KPI selector
It helps users:
-
Identify performance trends
-
Track improvements or declines
-
Analyze seasonal patterns
-
Make data-driven decisions
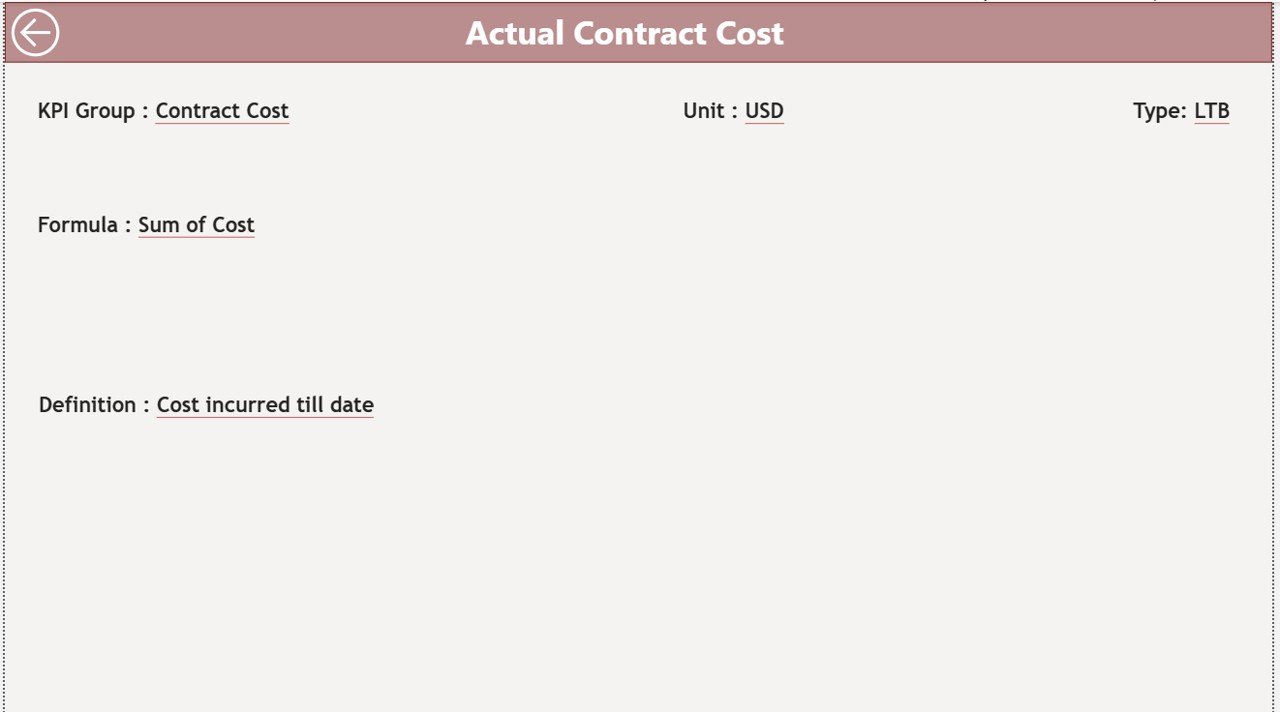
🔹 KPI Definition Page – Drill-Through View
This page explains each KPI in detail.
📌 Includes:
-
KPI definition
-
Formula
-
Unit of measurement
-
KPI type (LTB / UTB)
-
Business purpose
Users can access this page directly by right-clicking on any KPI from the dashboard.
🛠️ How to Use the Port Contract Management KPI Dashboard
1️⃣ Enter KPI data in the Excel input sheets
2️⃣ Update actual and target values
3️⃣ Refresh Power BI dashboard
4️⃣ Use slicers to analyze performance
5️⃣ Review trends and KPI status
6️⃣ Take data-driven actions
No advanced technical knowledge required.
👥 Who Can Benefit from This Dashboard?
✅ Port Authorities
✅ Terminal Managers
✅ Contract Managers
✅ Operations Teams
✅ Logistics Managers
✅ Performance Analysts
✅ Senior Management
This dashboard is ideal for anyone responsible for monitoring contract performance and operational efficiency in port environments.
🎯 Why Choose This Dashboard?
✔ Saves time on manual reporting
✔ Improves contract visibility
✔ Enhances decision-making
✔ Reduces performance risks
✔ Improves accountability
✔ Easy to customize and scale
If you want a professional, ready-to-use Power BI dashboard for port contract management, this solution is built exactly for your needs.
Click here to read the Detailed Blog Post
Watch the step-by-step video tutorial:


Reviews
There are no reviews yet.