Managing a plastics manufacturing operation requires constant control over production volume, energy usage, scrap levels, rework, machine utilization, and supplier quality. However, when this data is spread across Excel sheets, ERP exports, and manual reports, operational teams struggle to identify inefficiencies quickly.
That is exactly why the Plastics Manufacturing Dashboard in Power BI becomes a powerful operational intelligence solution 🚀.
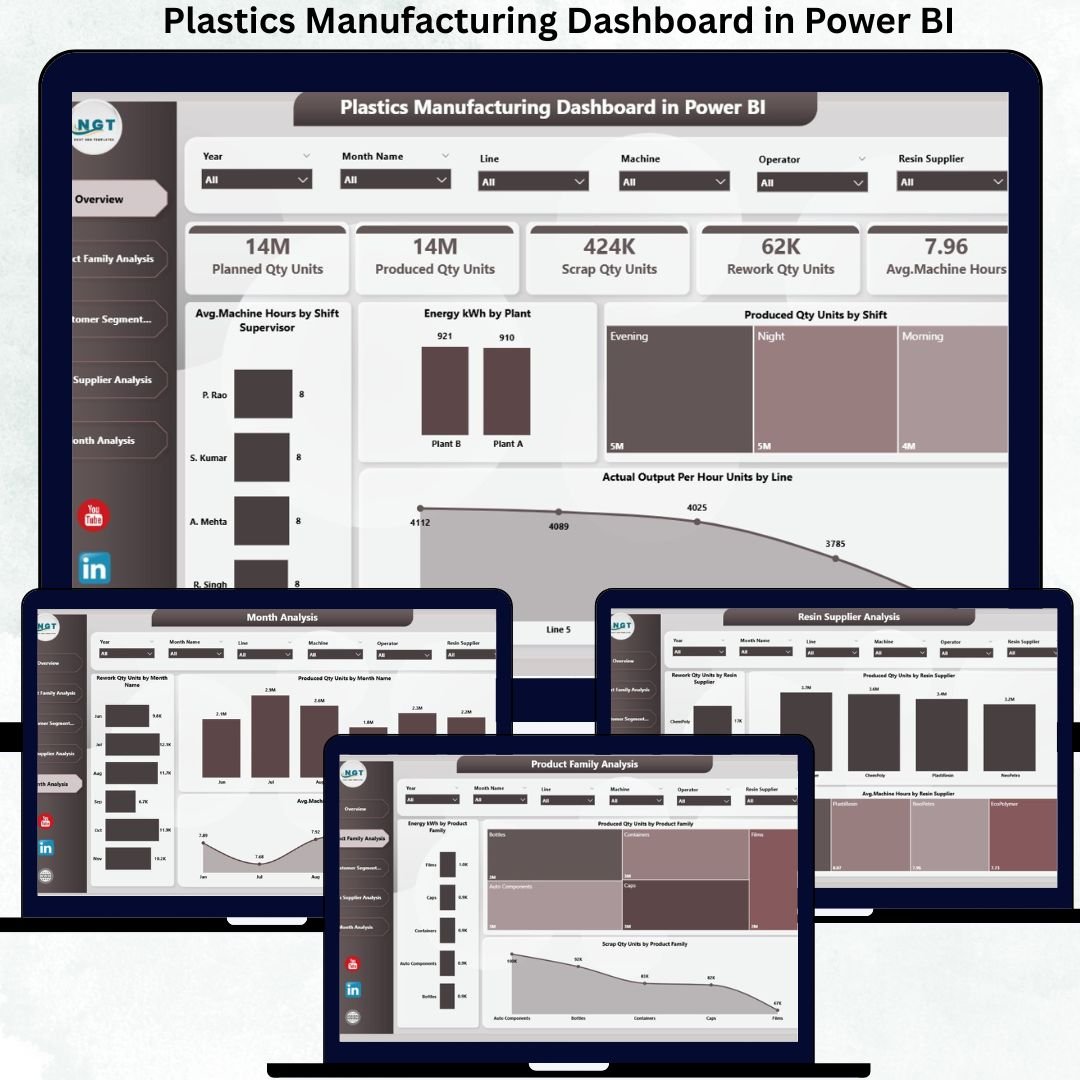
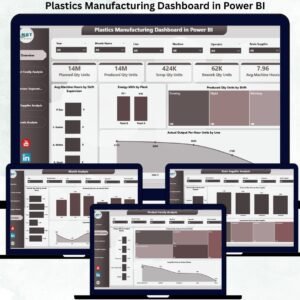
The Plastics Manufacturing Dashboard in Power BI is a ready-to-use, interactive analytics dashboard designed to monitor and improve manufacturing performance across product families, customer segments, resin suppliers, machines, and time periods.
Instead of manually reviewing production and quality reports, this dashboard converts raw manufacturing data into clear KPI cards, interactive charts, and trend-based insights. As a result, plant managers, production heads, quality teams, and leadership gain real-time visibility into what is happening on the shop floor.
Because the dashboard is built in Power BI, users can filter data dynamically, track trends over time, and take faster, data-driven actions—without complex tools or coding.
✅ Key Features of Plastics Manufacturing Dashboard in Power BI
🏭 End-to-End Manufacturing Visibility – One dashboard for complete control
⚡ Energy Consumption Tracking – Identify energy-intensive products & customers
🧩 Scrap & Rework Analysis – Reduce waste and improve yield
🛠️ Machine Utilization Insights – Optimize machine hours effectively
📦 Product Family Performance – Compare output, energy, and scrap
🚚 Resin Supplier Quality Analysis – Improve sourcing decisions
📈 Monthly Trend Monitoring – Detect issues before they escalate
🔍 Interactive Slicers & Filters – Analyze by product, customer, supplier, or month
📦 What’s Inside the Plastics Manufacturing Dashboard in Power BI
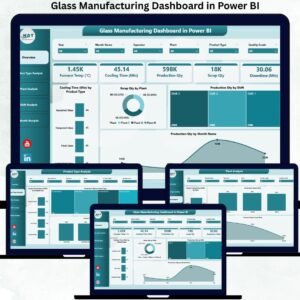
✅ Overview Page – Executive Manufacturing Snapshot
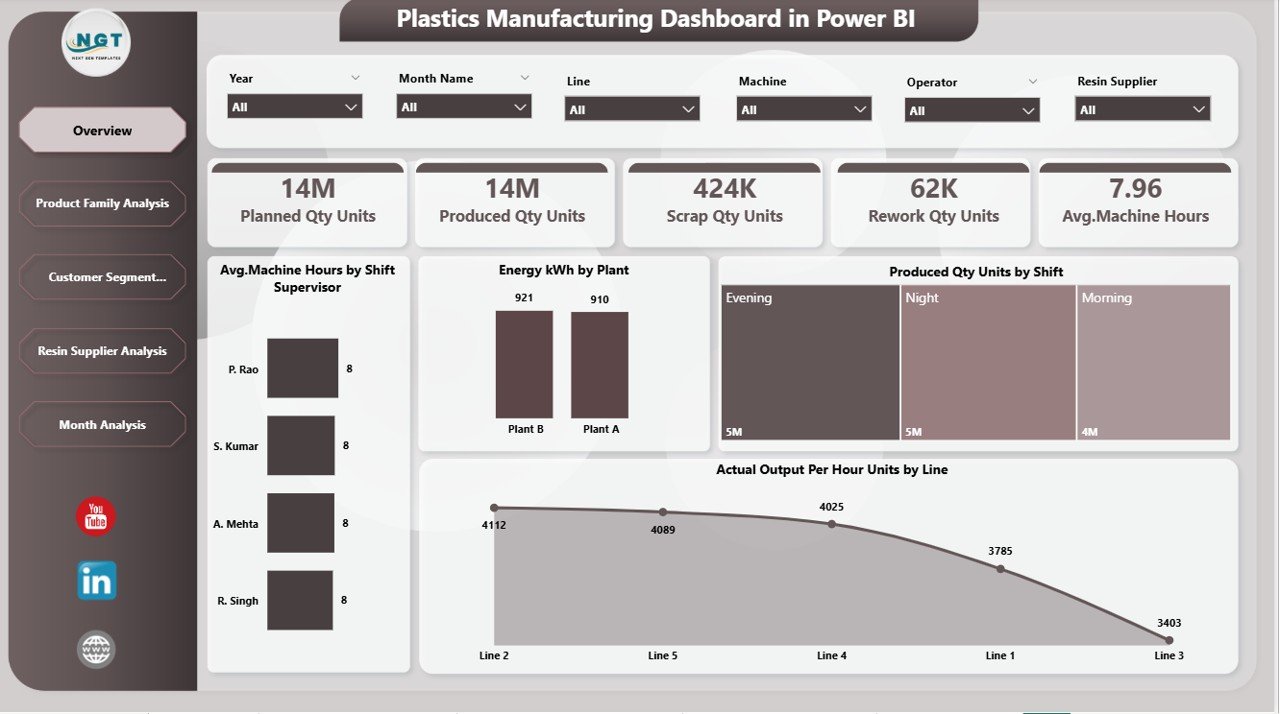
This page gives leadership an instant overview of manufacturing health.
Key Highlights
-
Interactive slicers for dynamic filtering
-
KPI cards showing high-level performance indicators
-
Analytical charts summarizing operational efficiency
This page allows managers to quickly assess production stability before diving deeper.
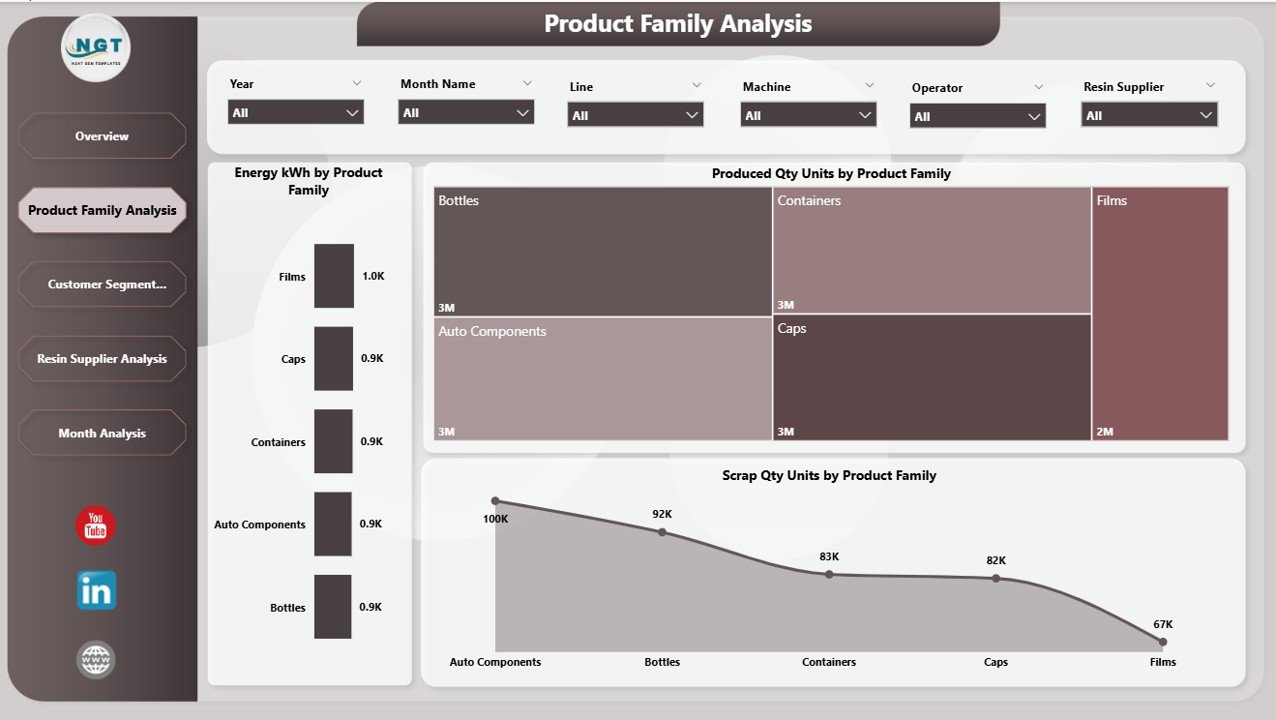
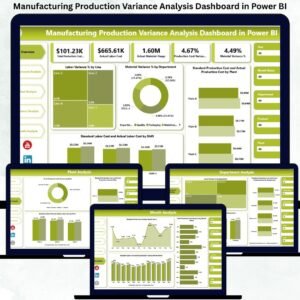
✅ Product Family Analysis Page
Helps understand how different product families impact cost and efficiency.
Charts Included
-
Energy Consumption (kWh) by Product Family
-
Produced Quantity (Units) by Product Family
-
Scrap Quantity (Units) by Product Family
Business Value
✅ Identify energy-heavy products
✅ Detect high-scrap product lines
✅ Improve product-level profitability
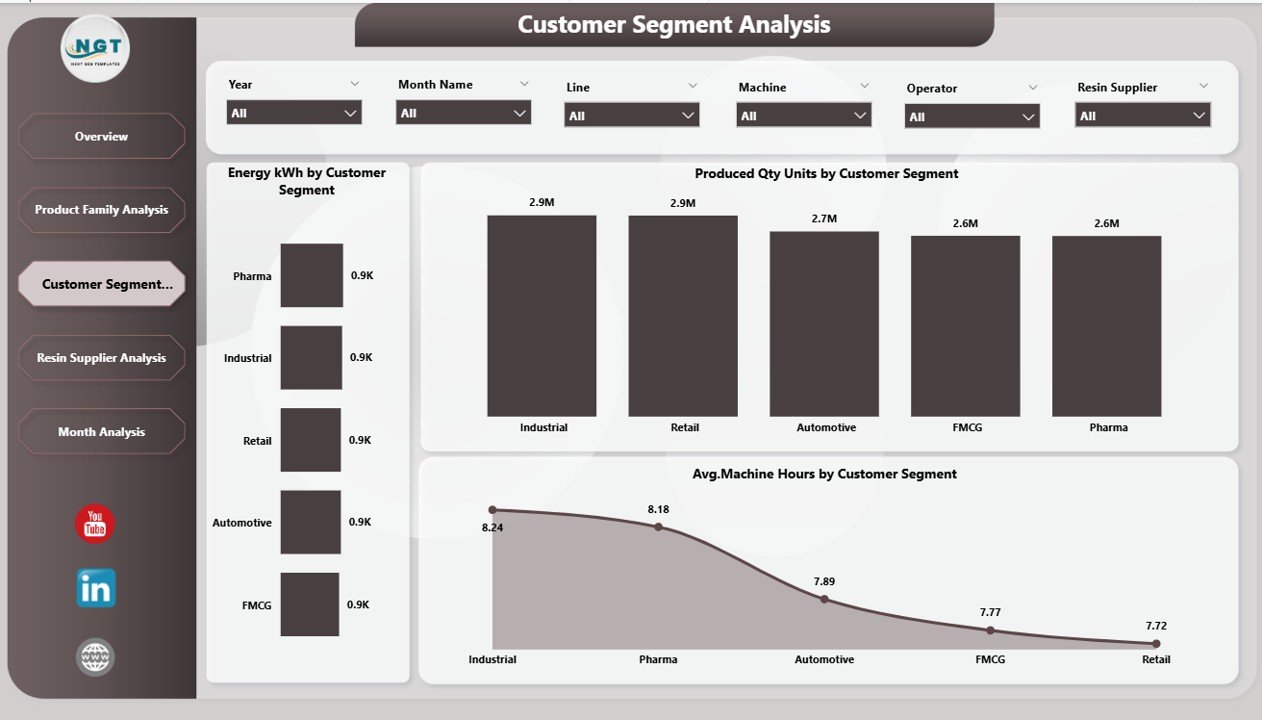
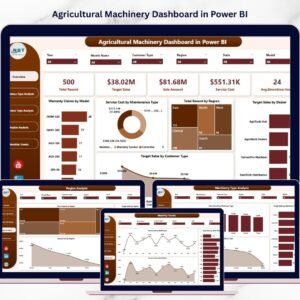
✅ Customer Segment Analysis Page
Analyzes production efficiency by customer segment.
Charts Included
-
Energy (kWh) by Customer Segment
-
Produced Quantity (Units) by Customer Segment
-
Average Machine Hours by Customer Segment
Why It Matters
✅ Recognize high-cost customer segments
✅ Improve pricing and service strategies
✅ Align production planning with profitability
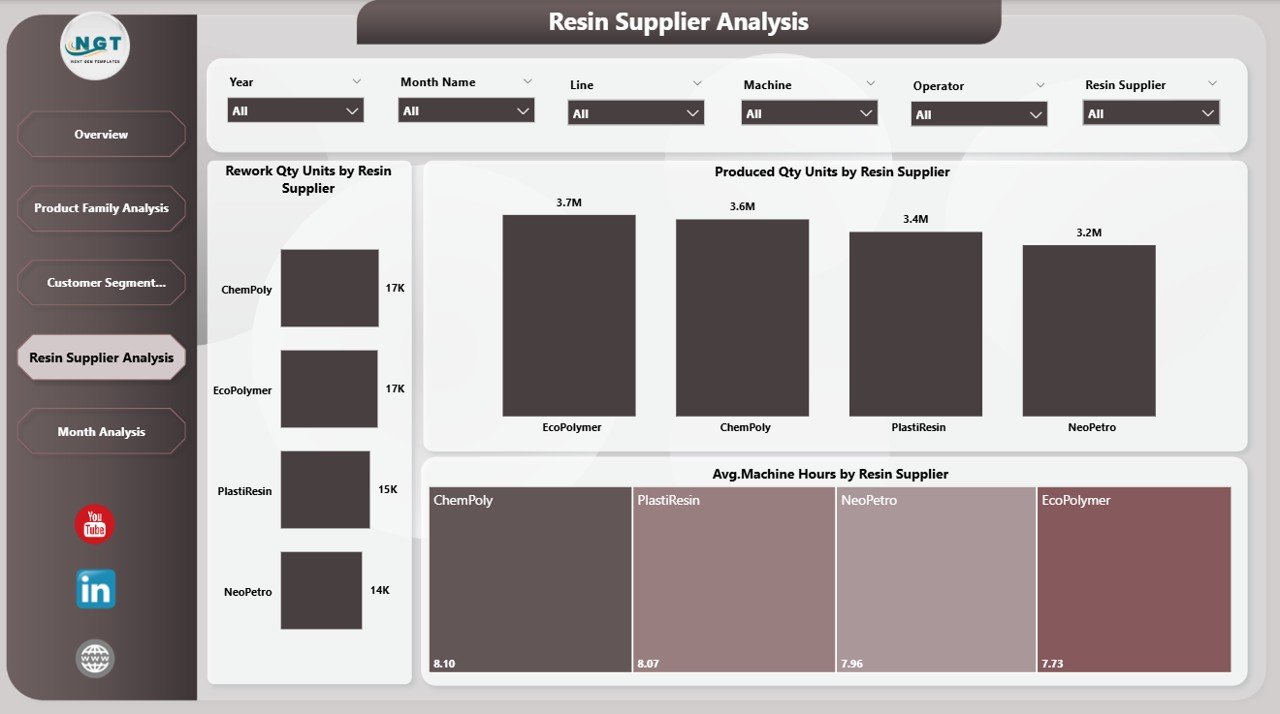
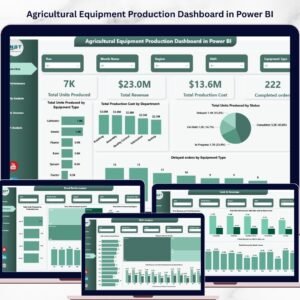
✅ Resin Supplier Analysis Page
Raw material quality drives production quality—this page makes it visible.
Charts Included
-
Rework Quantity (Units) by Resin Supplier
-
Produced Quantity (Units) by Resin Supplier
-
Average Machine Hours by Resin Supplier
Business Impact
✅ Reduce rework and defects
✅ Improve supplier accountability
✅ Strengthen procurement negotiations
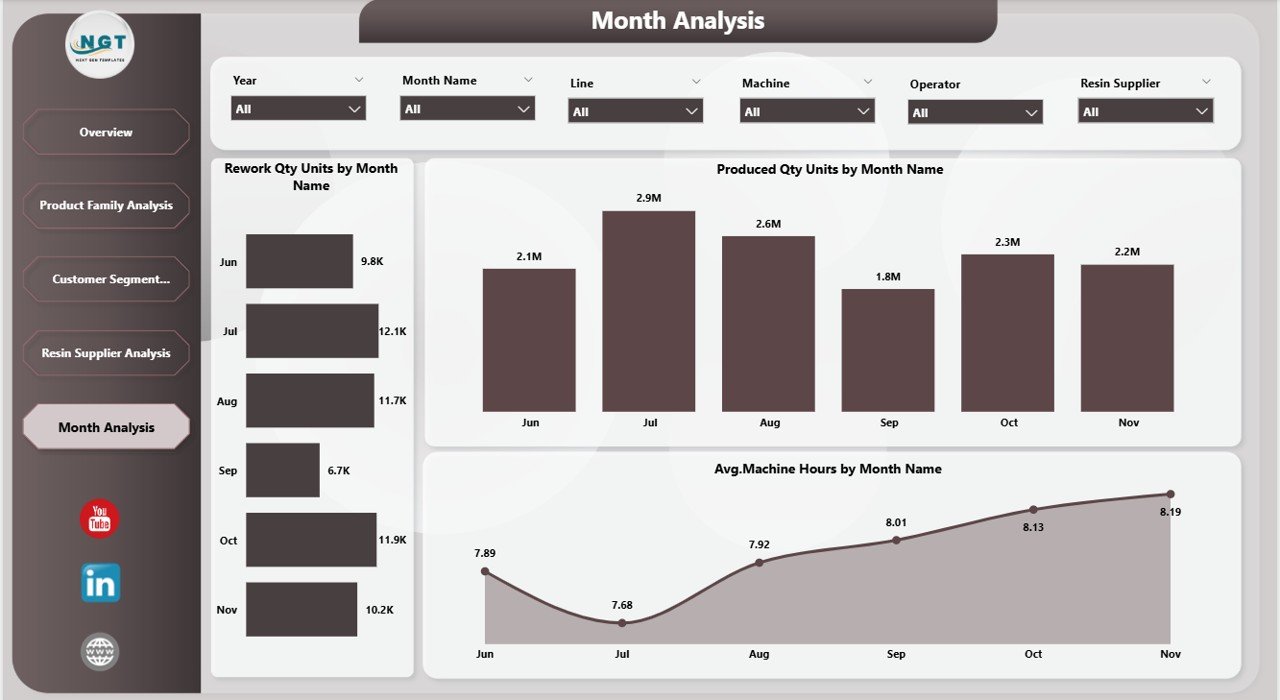
✅ Monthly Trends Page
Tracks how manufacturing performance changes over time.
Charts Included
-
Rework Quantity (Units) by Month
-
Produced Quantity (Units) by Month
-
Average Machine Hours by Month
Use Cases
✅ Identify seasonal production patterns
✅ Detect rising inefficiencies early
✅ Support long-term capacity planning
🛠️ How to Use the Plastics Manufacturing Dashboard
1️⃣ Load manufacturing data from Excel into Power BI
2️⃣ Refresh the dataset
3️⃣ Use slicers to filter by product family, customer segment, supplier, or month
4️⃣ Monitor energy, scrap, rework, and machine utilization
5️⃣ Share insights with production, quality, and management teams
✅ No advanced Power BI or coding skills required
👥 Who Can Benefit From This Dashboard
🏭 Plant Managers
⚙️ Production Engineers
📊 Operations & Manufacturing Heads
✅ Quality & Process Improvement Teams
📦 Procurement & Supply Chain Teams
📈 Senior Leadership
If manufacturing efficiency and cost control matter to your organization, this dashboard is built for you.
🚀 Why This Dashboard Creates Real Manufacturing Impact
✅ Lowers scrap and rework costs
✅ Reduces energy consumption per unit
✅ Improves supplier quality tracking
✅ Enhances production planning
✅ Eliminates manual reporting
✅ Enables proactive decision-making
This dashboard transforms manufacturing data into actionable operational intelligence.
📘 Click here to read the Detailed blog post
🎥 Visit our YouTube channel to learn step-by-step video tutorials
👉 https://youtube.com/@PKAnExcelExpert


Reviews
There are no reviews yet.