Managing pharmaceutical data is complex, time-consuming, and high-risk when handled manually. You must track sales, costs, discounts, profit margins, therapy areas, regions, products, and channels—often at the same time. When this data sits in scattered Excel files, visibility drops, reporting slows down, and critical insights remain hidden.
That is exactly why the Pharmaceuticals Dashboard in Excel is a powerful, ready-to-use solution 🚀.
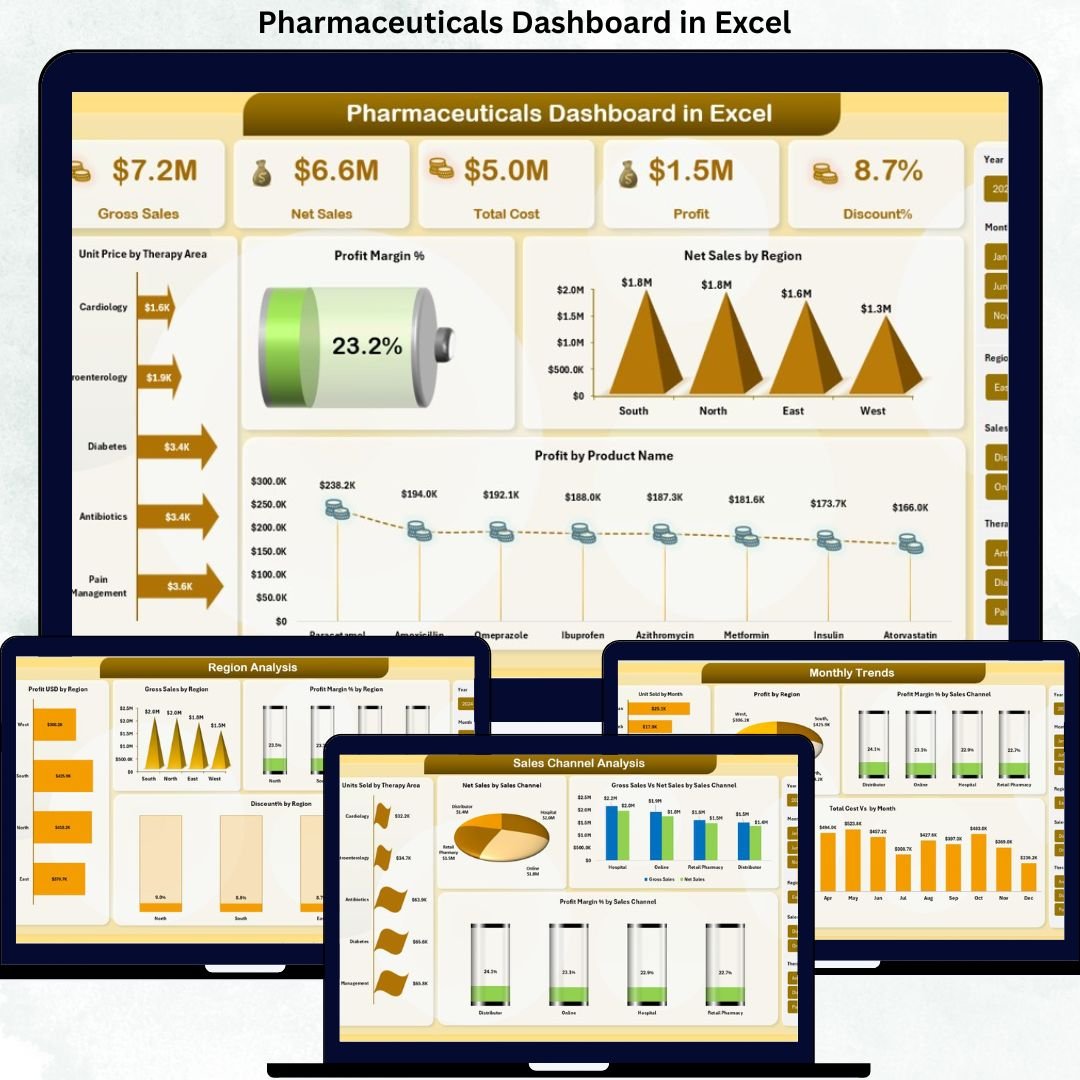
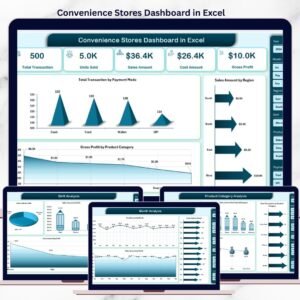
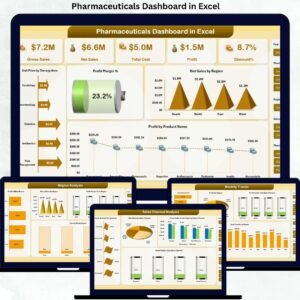
This professionally designed Excel dashboard converts raw pharmaceutical data into clear KPIs, interactive visuals, and actionable insights—without the need for expensive BI tools. It is built for decision-makers who want clarity, control, and confidence in pharma analytics.
⭐ Key Features of Pharmaceuticals Dashboard in Excel
📊 Comprehensive KPI Tracking
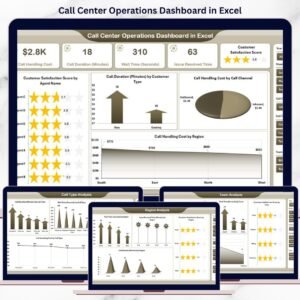
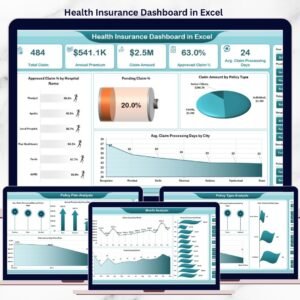
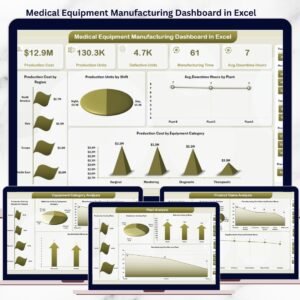
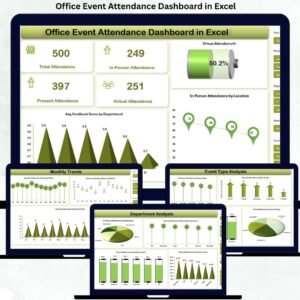
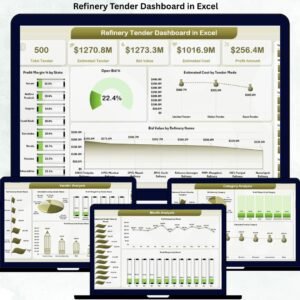
Monitor Gross Sales, Net Sales, Total Cost, Profit, Discount %, and Profit Margin % from a single dashboard.
🧠 Multi-Dimensional Analysis
Analyze performance by Region, Therapy Area, Product Name, Sales Channel, and Month for deeper insights.
📈 Interactive Visuals & Charts
Dynamic charts help you identify trends, gaps, and opportunities instantly.
🎯 Decision-Focused Dashboard Design
Each sheet answers a specific business question, making insights easy to understand and act upon.
⚡ 100% Excel-Based Solution
No Power BI or external tools required—works seamlessly within Excel.
🔄 Customizable & Scalable
Easily update data, add KPIs, or modify visuals as business needs evolve.
📦 What’s Inside the Pharmaceuticals Dashboard in Excel
This ready-to-use Excel file includes multiple structured dashboard pages:
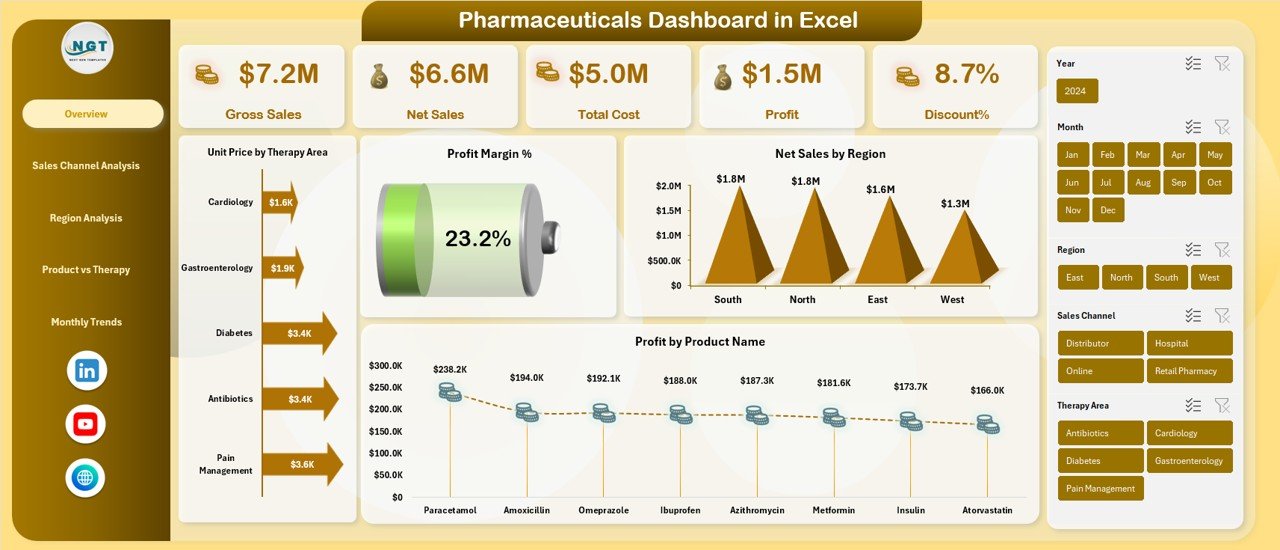
🧩 Overview Sheet
• Gross Sales
• Net Sales
• Total Cost
• Profit
• Discount %
• Profit Margin %
• Unit Price by Therapy Area
• Net Sales by Region
• Profit by Product Name
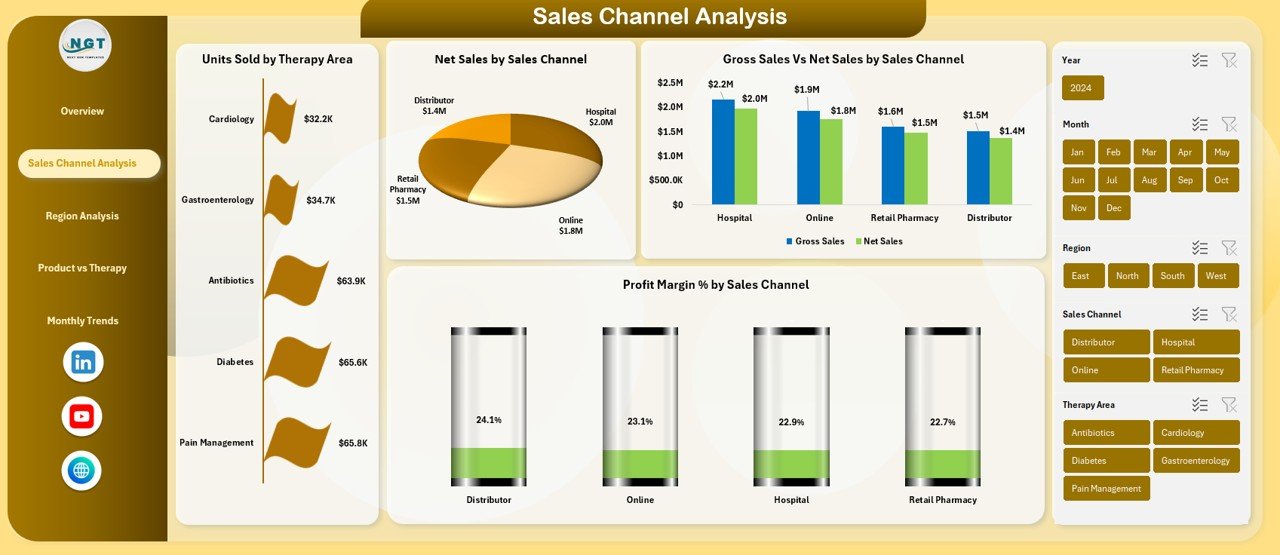
🛒 Sales Channel Analysis
• Units Sold by Therapy Area
• Net Sales by Sales Channel
• Gross Sales vs Net Sales by Sales Channel
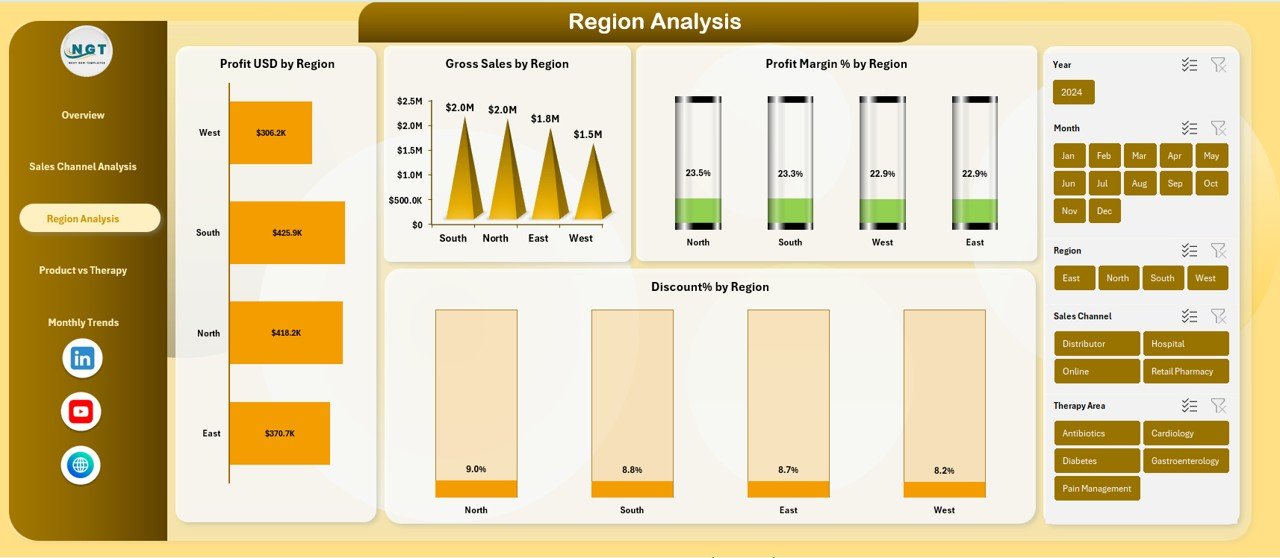
🌍 Region Analysis
• Profit USD by Region
• Gross Sales by Region
• Profit Margin % by Region
• Discount % by Region
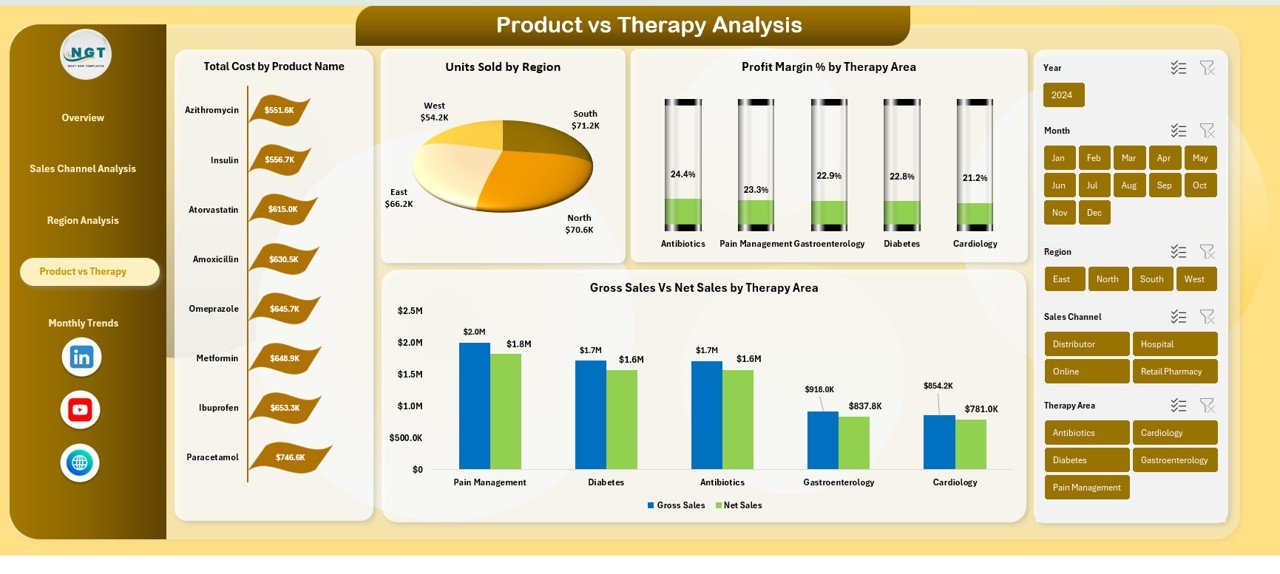
💊 Product vs Therapy Analysis
• Total Cost by Product Name
• Units Sold by Region
• Gross Sales vs Net Sales by Therapy Area
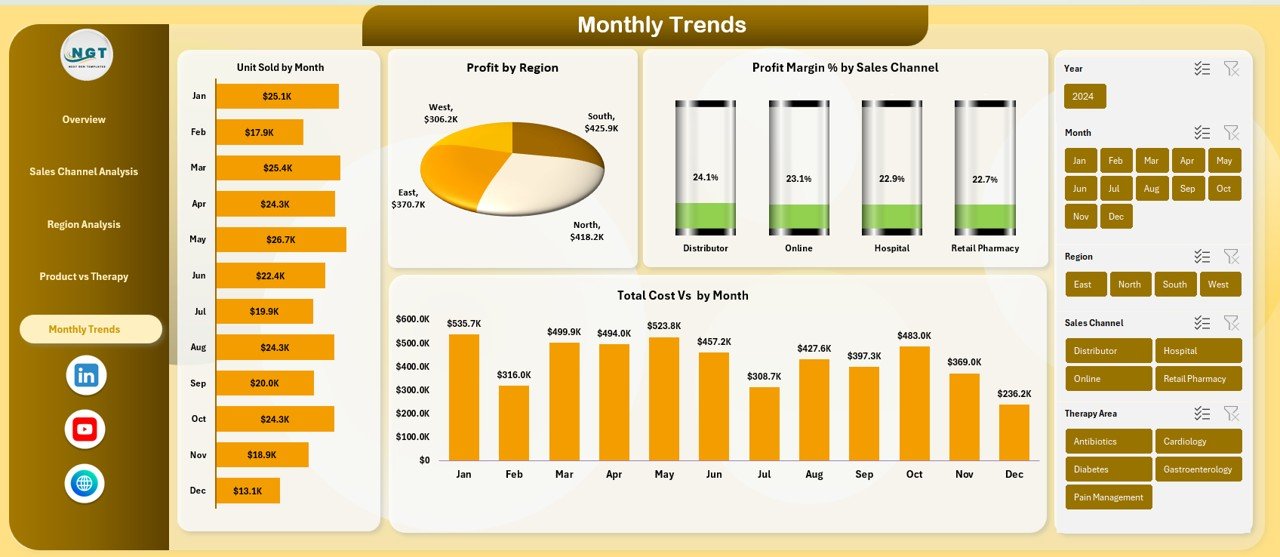
📅 Monthly Trends Analysis
• Units Sold by Month
• Profit by Region (Monthly)
• Profit Margin % by Sales Channel
• Total Cost by Month
Each page is designed to deliver clear answers, not just charts.
🧭 How to Use the Pharmaceuticals Dashboard in Excel
1️⃣ Enter or paste your pharmaceutical sales and cost data
2️⃣ Refresh pivot tables (one click)
3️⃣ Use slicers to filter by region, therapy, product, or channel
4️⃣ Review KPIs and trends instantly
5️⃣ Use insights for pricing, budgeting, and strategic decisions
No advanced Excel skills required—basic Excel knowledge is enough.
👥 Who Can Benefit from This Pharmaceuticals Dashboard in Excel
👨💼 Pharmaceutical Sales Managers
💰 Finance & Controlling Teams
📦 Product & Therapy Managers
🌐 Regional & Zonal Heads
📊 Business & Data Analysts
🏢 Senior Management & Executives
Whether you manage a small pharma business or a large pharmaceutical organization, this dashboard adapts to your needs.
Click here to read the Detailed Blog Post
Watch the step-by-step video tutorial:


Reviews
There are no reviews yet.