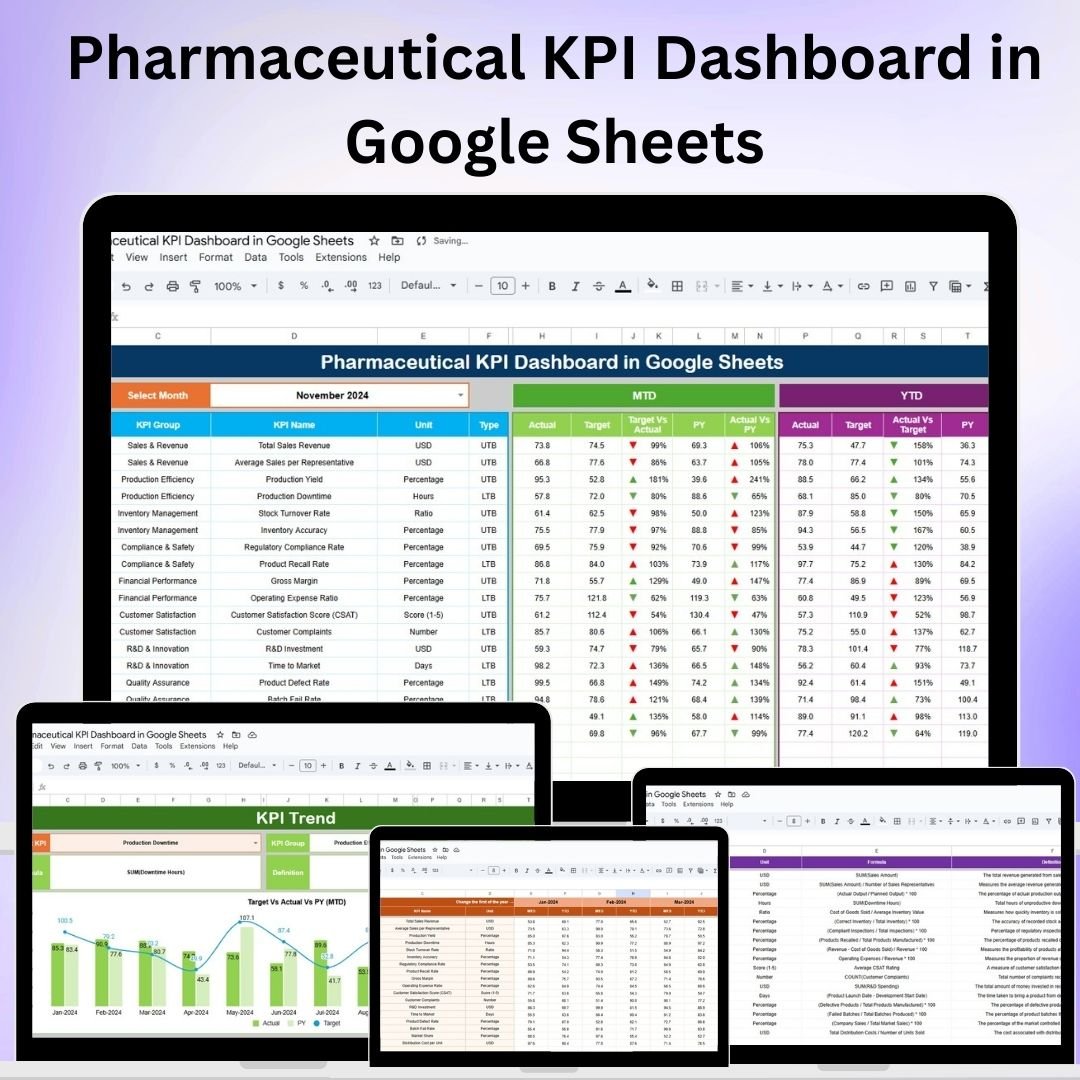
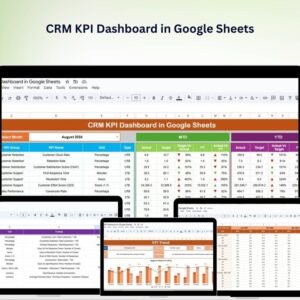
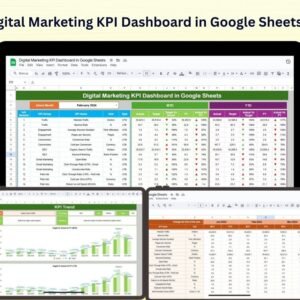
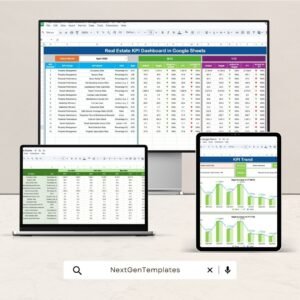
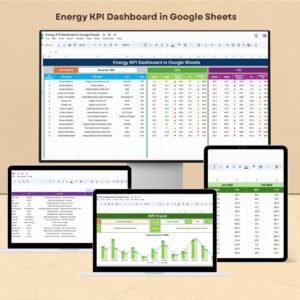
The Pharmaceutical KPI Dashboard in Google Sheets is a comprehensive tool designed to help pharmaceutical companies monitor and analyze their key performance indicators (KPIs). This dashboard provides a centralized platform to track critical metrics such as sales performance, inventory levels, production cycles, and more, enabling teams to make informed, data-driven decisions.
By leveraging the capabilities of Google Sheets, this dashboard offers a cost-effective and accessible solution for businesses of all sizes to enhance operational efficiency and drive performance improvements.
Key Features of the Pharmaceutical KPI Dashboard in Google Sheets
📊 Centralized KPI Tracking
-
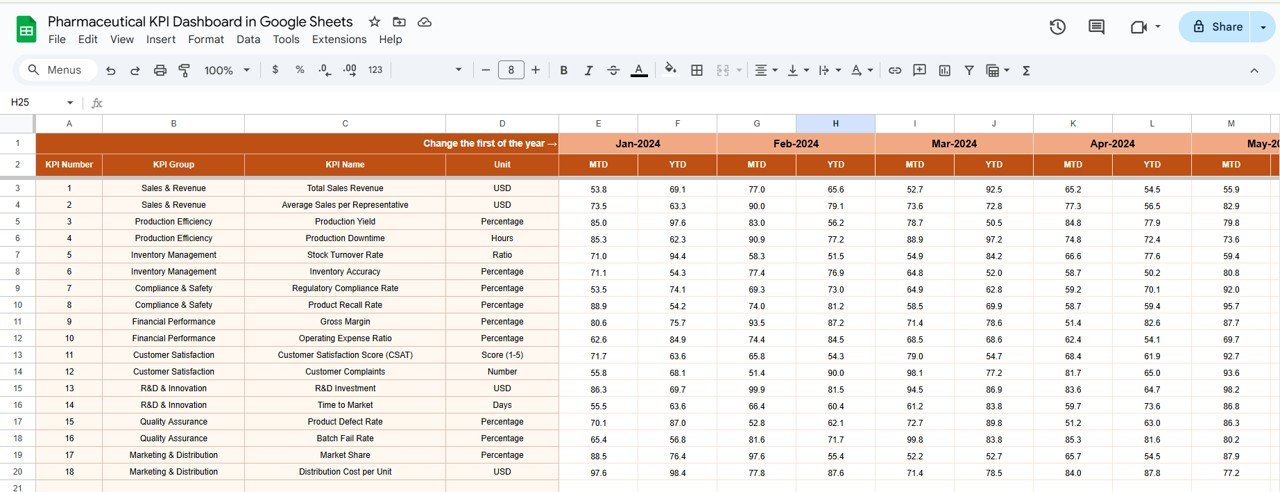
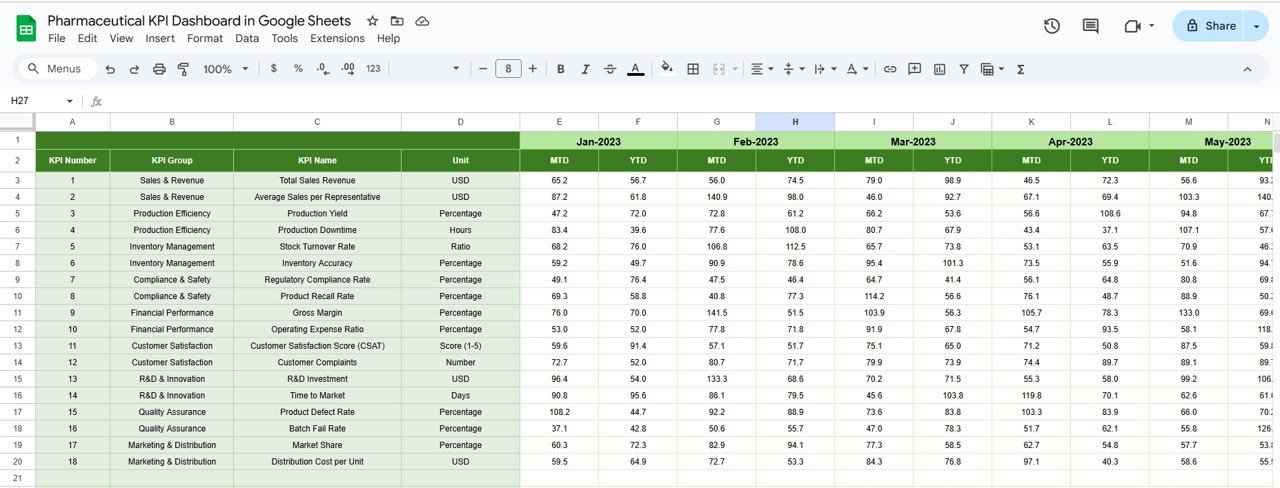
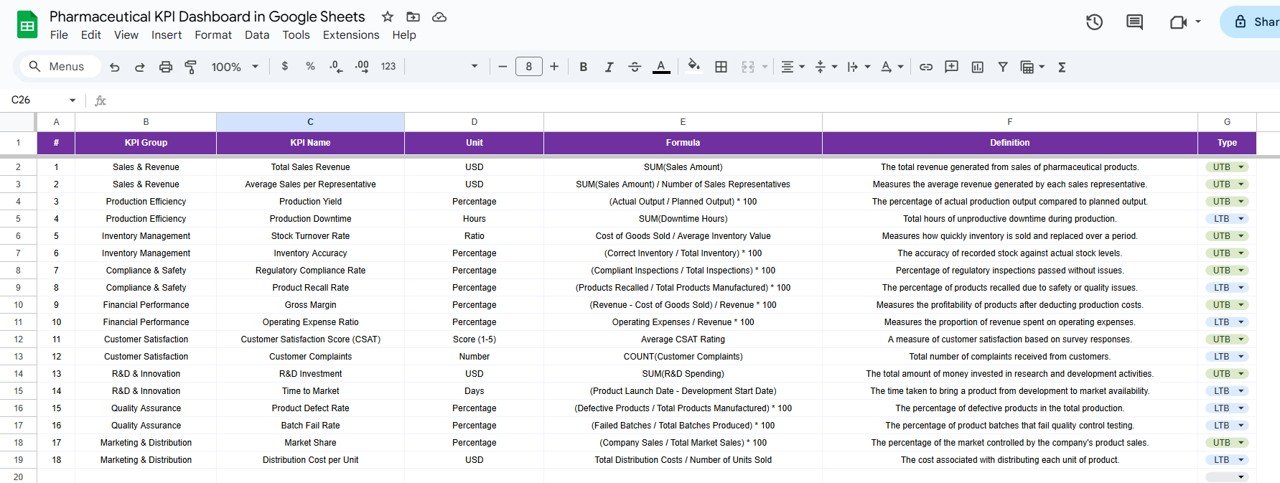
Comprehensive Metric Monitoring: Track essential pharmaceutical KPIs such as sales revenue, market share, R&D productivity, and more in one centralized dashboard.
-
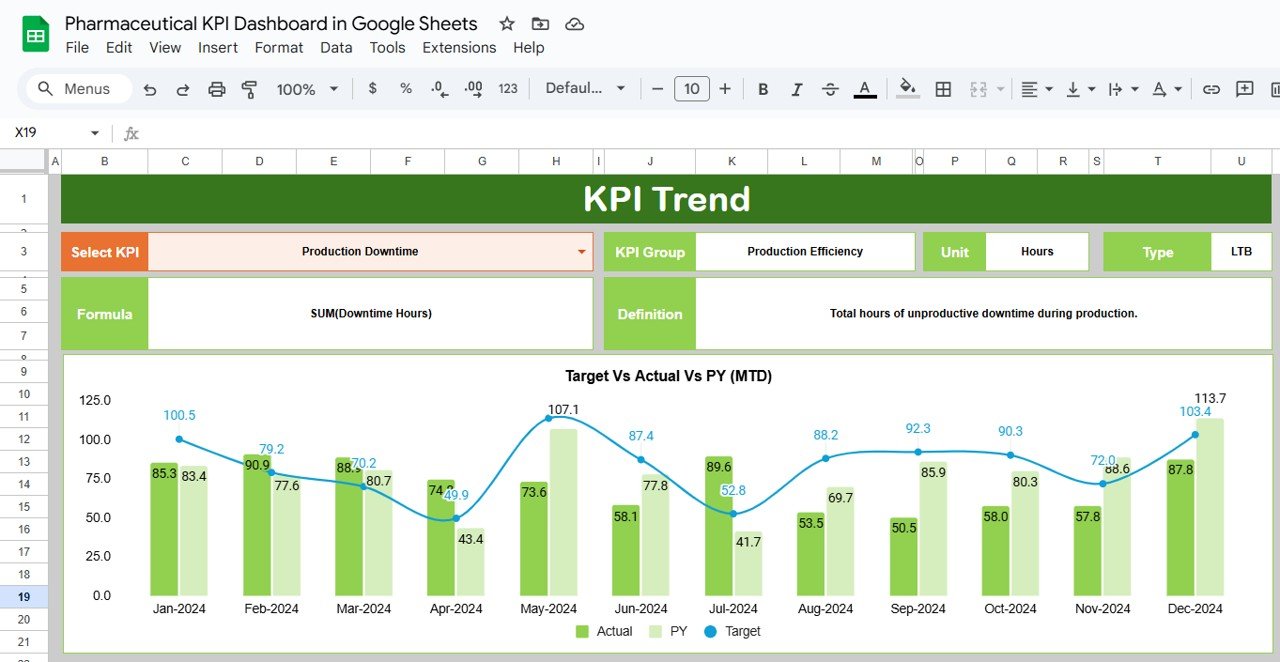
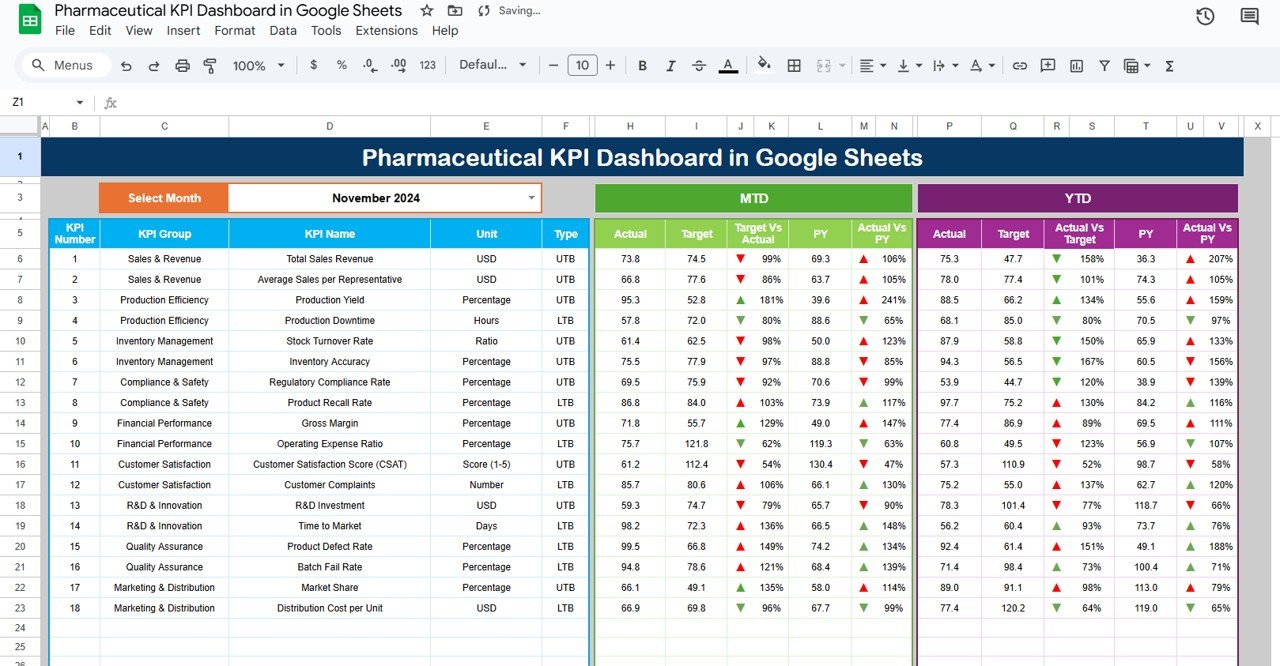
Real-Time Data Visualization: Utilize dynamic charts, graphs, and tables to visualize trends and performance over time, facilitating quick insights.
-
Customizable Metrics: Tailor the dashboard to include KPIs specific to your organization’s goals and objectives.
📈 Performance Analysis and Monitoring
-
Trend Tracking: Monitor KPIs over time, comparing actual data against targets and previous periods to assess improvements or identify areas needing attention.
-
Comprehensive Breakdown: Break down performance by department, region, or other categories to gain a more granular view of where challenges may lie and where performance is excelling.
🔧 Data Integration and Reporting
-
Easy Data Import: Import data directly from your systems or analytics platforms to keep the dashboard updated with real-time information.
-
Actionable Insights: Gain actionable insights by identifying performance bottlenecks, inefficiencies, and opportunities for improvement.
💡 User-Friendly Interface
-
Simplified Dashboard: Designed to be intuitive and easy to use, even for those without technical expertise. The dashboard is set up in a way that allows teams to instantly grasp performance metrics and make necessary adjustments.
-
Customizable Layouts: Adjust the layout and features of the dashboard to better align with your team’s needs and preferences.
Benefits of Using the Pharmaceutical KPI Dashboard in Google Sheets
✅ Informed Decision-Making
With easy access to essential KPIs, decision-makers can act on real-time data to optimize strategies and improve performance.
✅ Improved Operational Efficiency
Track performance across multiple metrics in real-time, enabling timely interventions and improvements in processes.
✅ Enhanced Strategic Planning
Monitor key metrics such as sales performance and inventory levels to make informed decisions that align with long-term goals.
✅ Cost-Efficient Solution
The Google Sheets template provides an affordable solution for tracking KPIs, removing the need for costly software and making it accessible to businesses of all sizes.
Getting Started with Your Pharmaceutical KPI Dashboard in Google Sheets
-
Download the Template: Access the Pharmaceutical KPI Dashboard template to begin customizing it for your business.
-
Set Up Your KPIs: Identify the key KPIs that are most relevant to your business and add them to the dashboard.
-
Import Data: Import relevant data from your analytics platforms to keep the dashboard up-to-date.
-
Monitor Performance: Use the visualizations and metrics to monitor trends, track KPIs, and make informed decisions.
-
Collaborate: Share the dashboard with key stakeholders to keep everyone informed and aligned on goals and progress.
By utilizing the Pharmaceutical KPI Dashboard in Google Sheets, your organization can improve operational efficiency, enhance strategic planning, and make better, data-driven decisions that lead to higher success and profitability.
Click here to read the Detailed blog post
Pharmaceutical KPI Dashboard in Google Sheets
Visit our YouTube channel to learn step-by-step video tutorials
YouTube.com/@PKAnExcelExpert


Reviews
There are no reviews yet.