
Running an ophthalmology clinic today requires more than excellent eye care. Clinics must also closely monitor patient visits, surgeries, revenue, discounts, insurance cases, and doctor performance. However, when data stays scattered across multiple Excel files or systems, visibility disappears—and decision-making becomes slow and reactive.
That is exactly where the Ophthalmology Services Dashboard in Excel becomes a powerful solution. 🚀
The Ophthalmology Services Dashboard in Excel is a ready-to-use, interactive analytics dashboard designed specifically for eye hospitals, ophthalmology clinics, diagnostic centers, and multi-specialty healthcare facilities. It converts raw clinical and billing data into clear KPIs, structured analysis pages, and visual insights—all inside Excel.
Instead of spending hours preparing manual MIS reports, clinic administrators and finance teams can instantly analyze OPD visits, surgeries, gross charges, net revenue, insurance impact, discounts, departments, doctors, and services with just a few clicks. Because it is built in Excel, the dashboard is cost-effective, flexible, and easy to use, without Power BI or complex software.
✅ Key Features of Ophthalmology Services Dashboard in Excel
👁️ Clinic Performance Overview – Instantly track visits, revenue, and charges
🏥 Department-Wise Analysis – Compare utilization, surgeries, and insurance cases
👨⚕️ Doctor Performance Tracking – Evaluate revenue, surgeries, and productivity
🧾 Service-Level Insights – Identify high-value and surgery-driven services
📅 Monthly Trend Analysis – Monitor revenue, insurance, and performance over time
🧭 Page Navigator – Easy left-side navigation across all pages
🎛️ Dynamic Slicers – Filter data by month, doctor, department, service, or region
This dashboard turns Excel into a complete healthcare performance monitoring tool.
📦 What’s Inside the Ophthalmology Services Dashboard in Excel
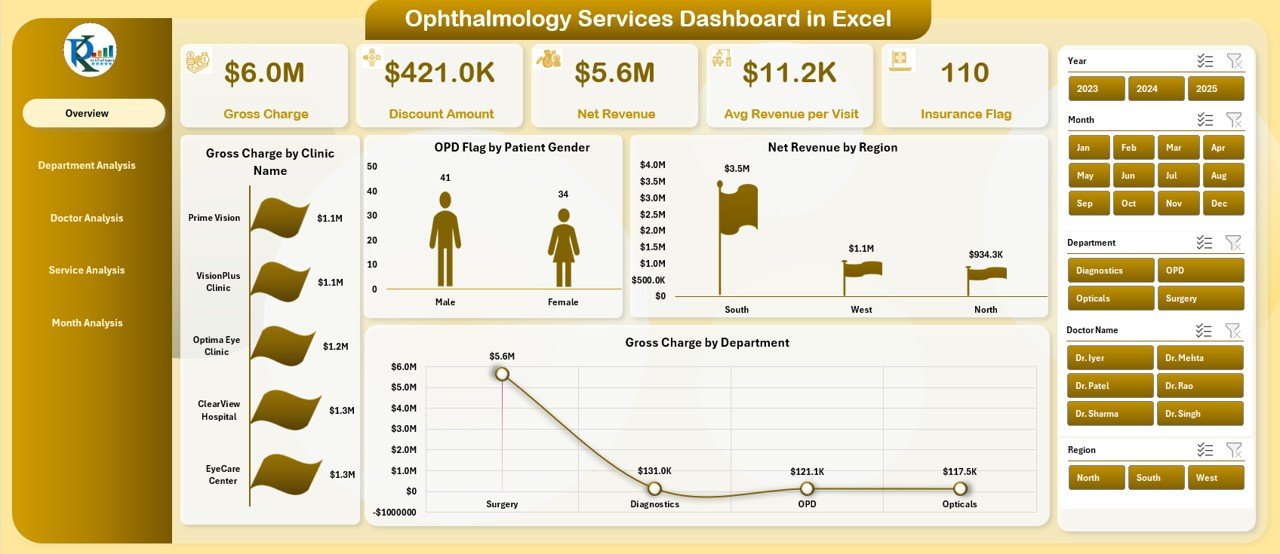
✅ Overview Page
-
Five KPI Cards showing high-level clinic metrics
-
Four summary charts:
-
Gross Charge by Clinic Name
-
OPD Flag by Patient Gender
-
Net Revenue by Region
-
Gross Charge by Department
-
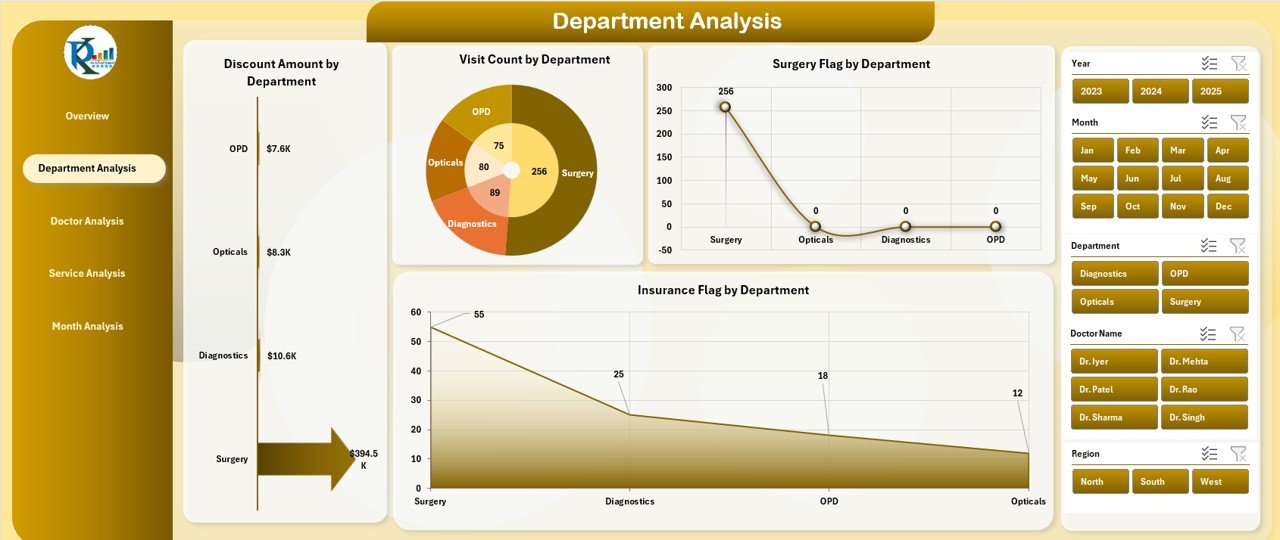
✅ Department Analysis Page
-
Discount Amount by Department
-
Visit Count by Department
-
Surgery Flag by Department
-
Insurance Flag by Department
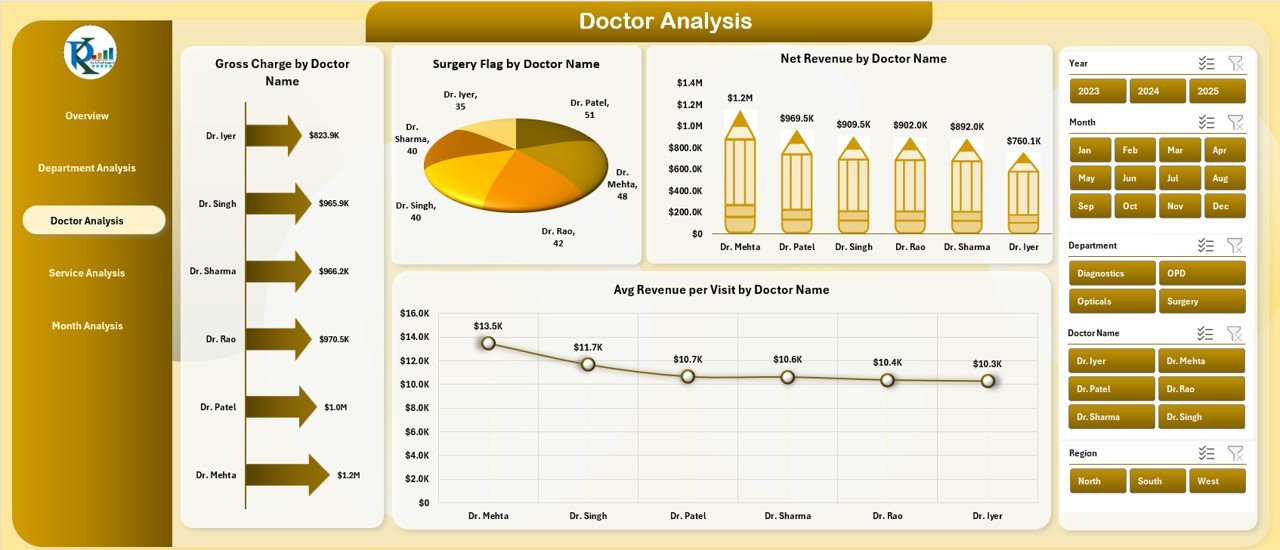
✅ Doctor Analysis Page
-
Gross Charge by Doctor Name
-
Surgery Flag by Doctor Name
-
Net Revenue by Doctor Name
-
Average Revenue per Visit by Doctor
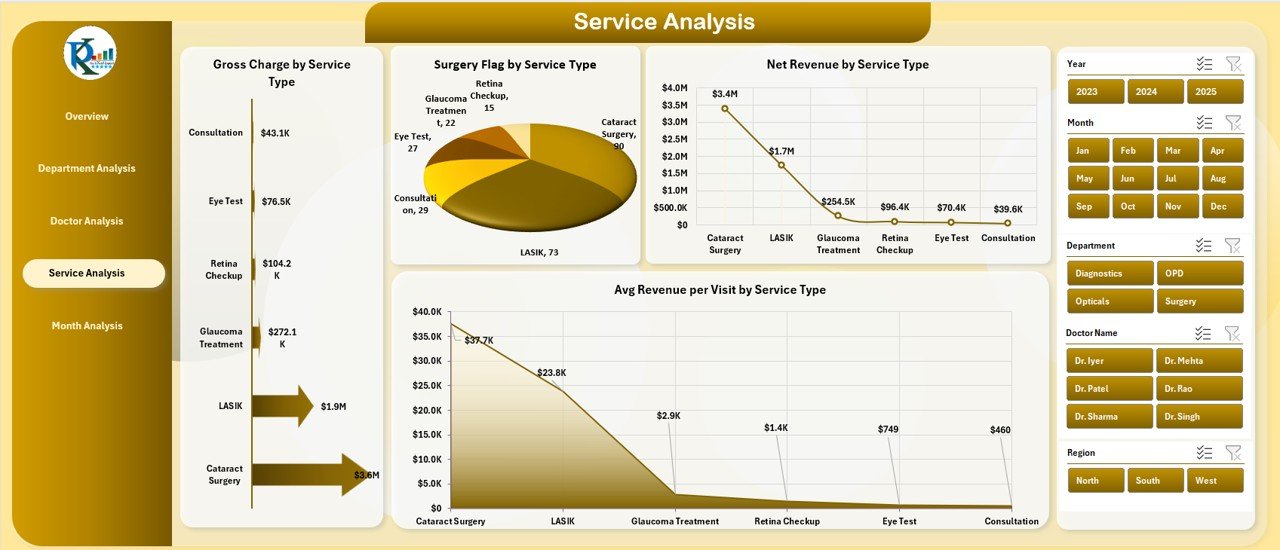
✅ Service Analysis Page
-
Gross Charge by Service Type
-
Surgery Flag by Service Type
-
Net Revenue by Service Type
-
Average Revenue per Visit by Service
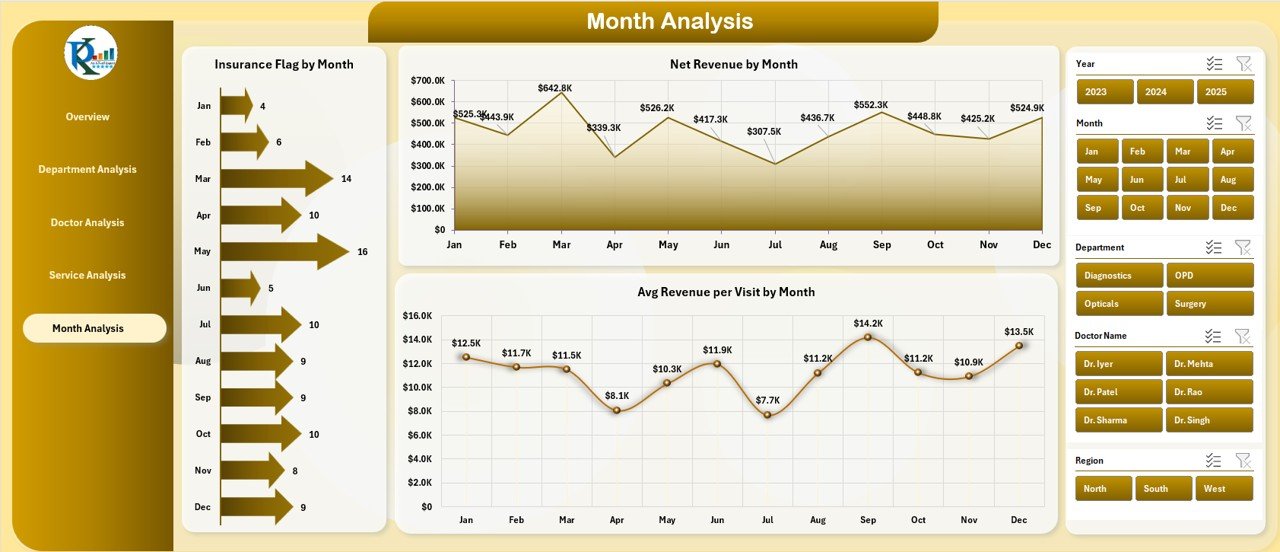
✅ Month Analysis Page
-
Insurance Flag by Month
-
Net Revenue by Month
-
Average Revenue per Visit by Month
✅ Backend Sheets
-
Structured Data Sheet for raw records
-
Support Sheet for mappings and calculations
-
Pivot-ready architecture for instant refresh
🛠️ How to Use the Ophthalmology Services Dashboard in Excel
1️⃣ Enter or import clinic data into the Data Sheet
2️⃣ Refresh pivot tables (if needed)
3️⃣ Use slicers to filter by department, doctor, service, region, or month
4️⃣ Instantly analyze revenue, visits, surgeries, and insurance trends
5️⃣ Use insights for pricing, staffing, operational planning, and reviews
No VBA. No advanced Excel skills required ✅
👥 Who Can Benefit from This Dashboard
🏥 Ophthalmology Clinic Owners
👁️ Eye Hospitals & Diagnostic Centers
📊 Healthcare Administrators
💰 Medical Billing & Finance Teams
👨⚕️ Doctors & Department Heads
📈 Healthcare Analysts & Consultants
If you manage eye-care operations or revenue, this dashboard is built for you.
🚀 Why This Dashboard Creates Real Business Impact
✅ Eliminates manual MIS reporting
✅ Improves clinical and financial visibility
✅ Identifies high-performing doctors and services
✅ Tracks insurance dependency and revenue leakage
✅ Supports smarter pricing and resource allocation
✅ Works 100% inside Excel
✅ Easy to customize and scale
This dashboard helps clinics move from guesswork to data-driven healthcare management.
📘 Click here to read the Detailed blog post
🎥 Visit our YouTube channel to learn step-by-step video tutorials
👉 https://youtube.com/@PKAnExcelExpert
Watch the step-by-step video tutorial:


Reviews
There are no reviews yet.