In the fast-growing digital education landscape, success depends on understanding data — enrollments, instructor performance, learner satisfaction, and revenue. The Online Learning Platforms Dashboard in Excel turns this overwhelming data into clear, actionable insights, all within the familiar Microsoft Excel environment. 📊
This ready-to-use dashboard empowers e-learning companies, course creators, and educational institutions to monitor performance, optimize profitability, and improve learner experiences through automated visuals, dynamic slicers, and insightful KPIs.
🌟 Key Features of the Online Learning Platforms Dashboard in Excel
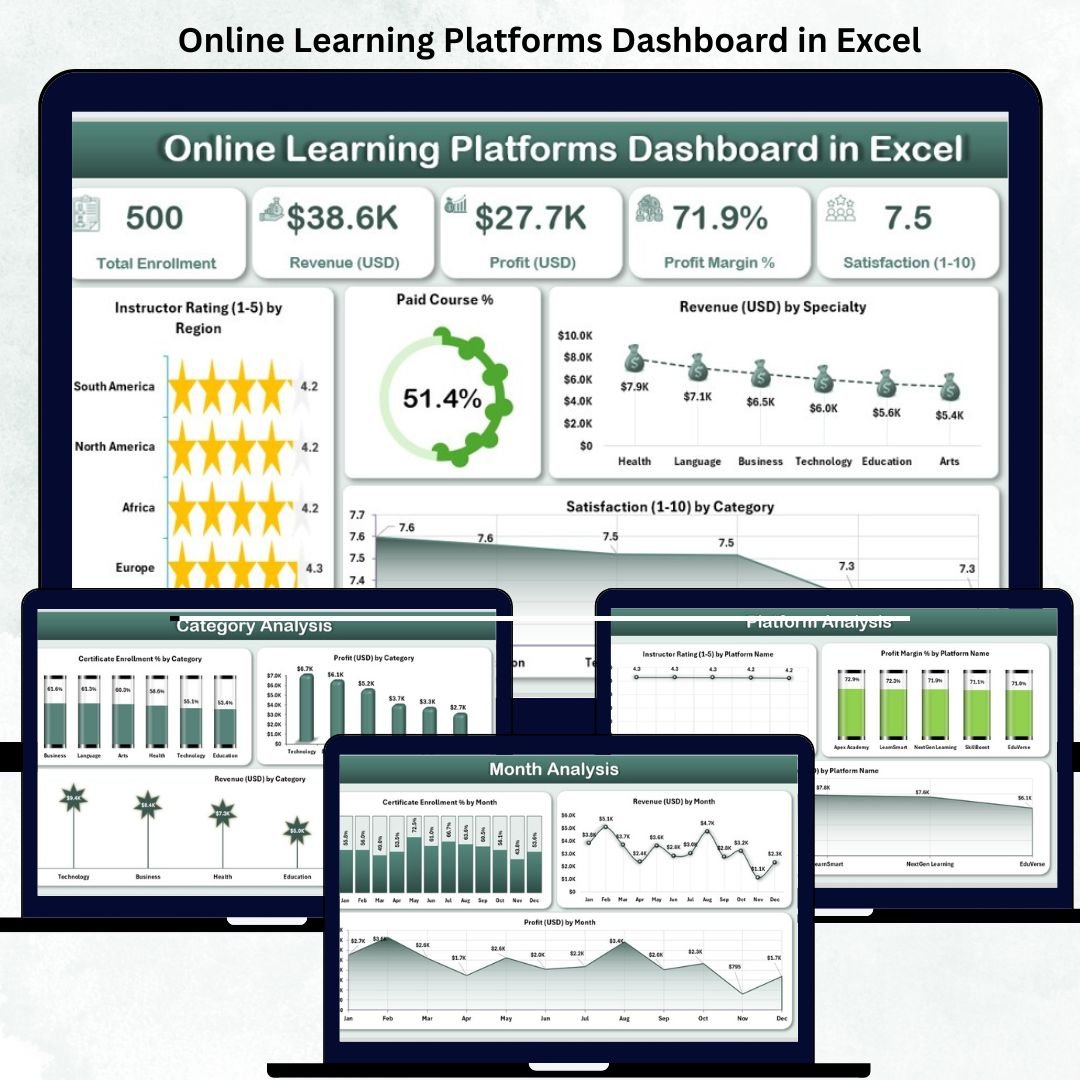
🏠 1️⃣ Overview Page – Central Performance Snapshot
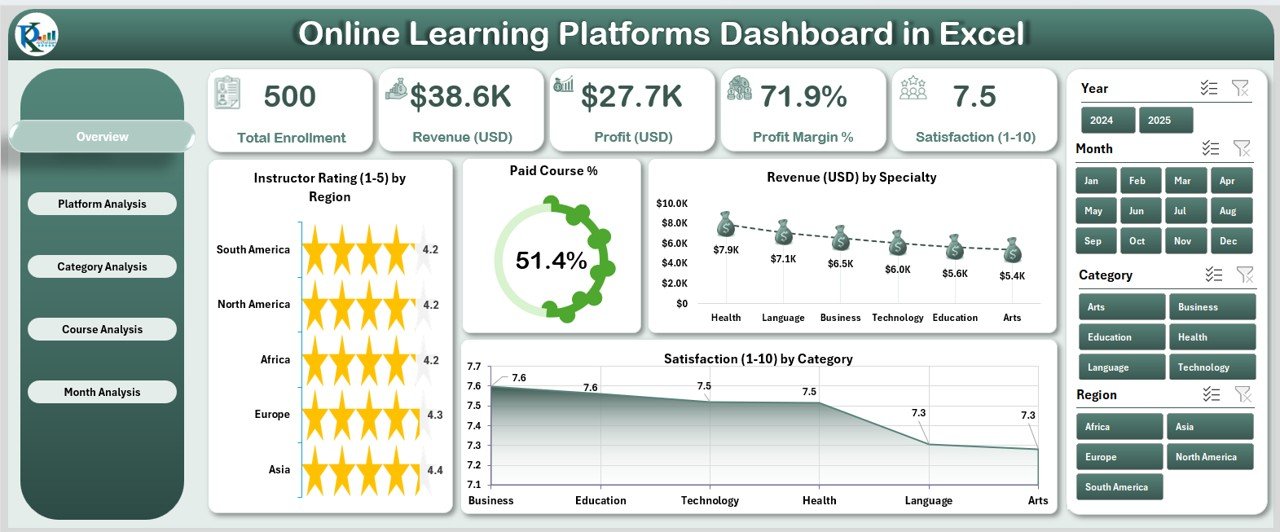
Your main control center for tracking e-learning metrics.
Includes:
-
🎯 Slicers on the right for easy filtering by Time, Platform, or Category.
-
💡 Five KPI Cards:
-
Total Revenue (USD)
-
Paid Course %
-
Instructor Rating
-
Certificate Enrolment Rate
-
Satisfaction Score
-
-
📊 Charts: Instructor Rating by Region, Paid Course %, Revenue by Specialty, and Satisfaction by Category.
💬 Purpose: Quickly identify top-performing courses, regions, and instructors at a glance.
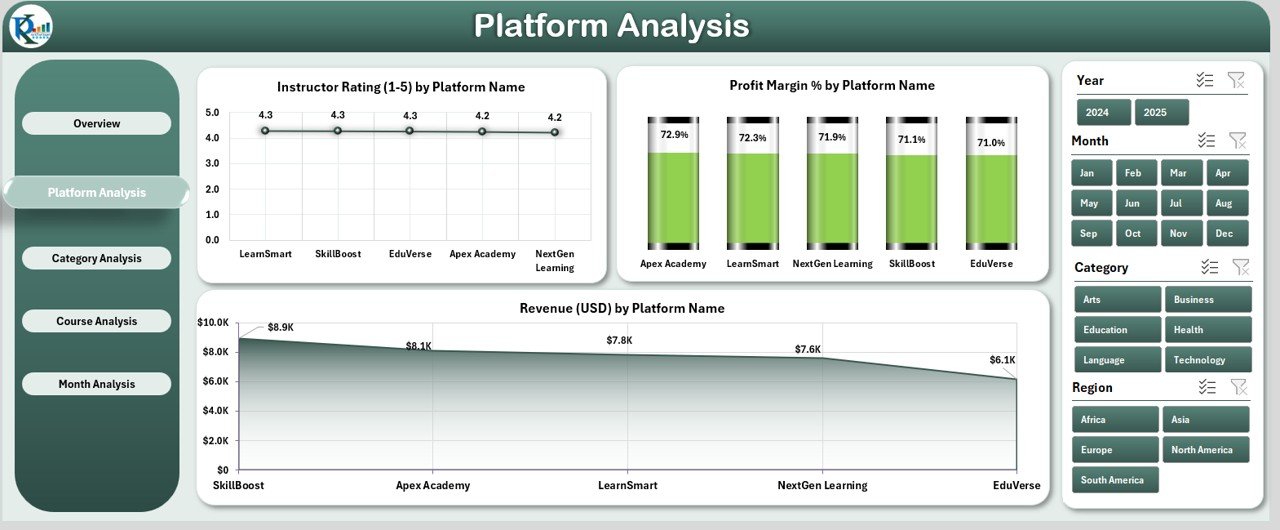
💻 2️⃣ Platform Analysis Page – Platform-Wise Comparison
Analyze how each learning platform contributes to business growth.
Visuals Include:
-
Instructor Rating by Platform
-
Profit Margin % by Platform
-
Revenue (USD) by Platform
📈 Outcome: Discover which platforms deliver the highest ROI and where to improve marketing or content strategies.
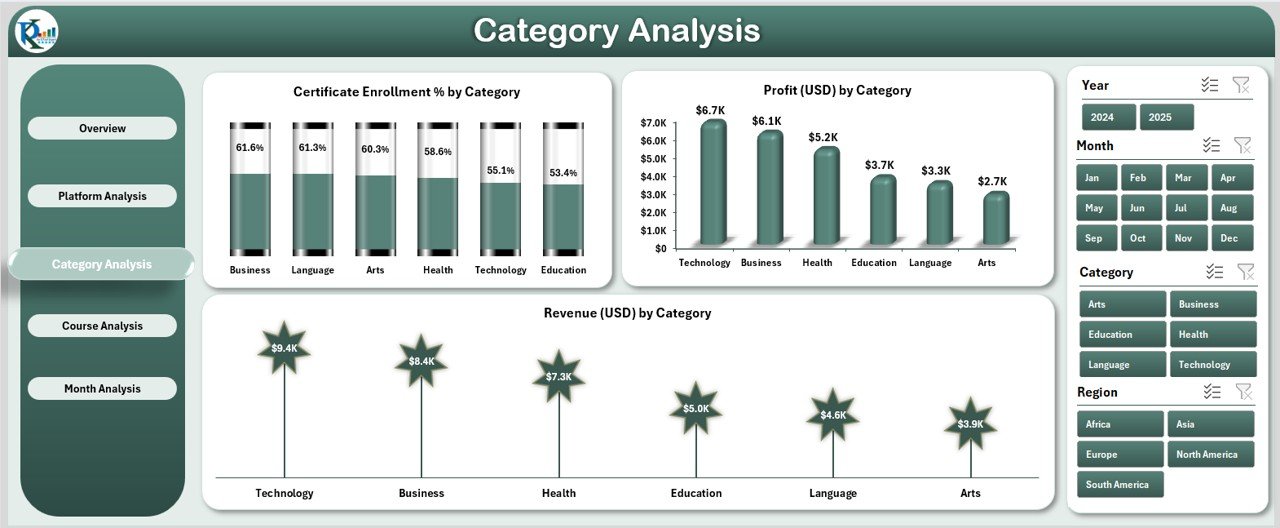
📚 3️⃣ Category Analysis Page – Subject Performance Insights
Evaluate how different learning categories perform in terms of enrolment, profit, and revenue.
Charts Include:
-
Certificate Enrolment % by Category
-
Profit (USD) by Category
-
Revenue (USD) by Category
💡 Purpose: Pinpoint high-demand subjects and allocate resources effectively.
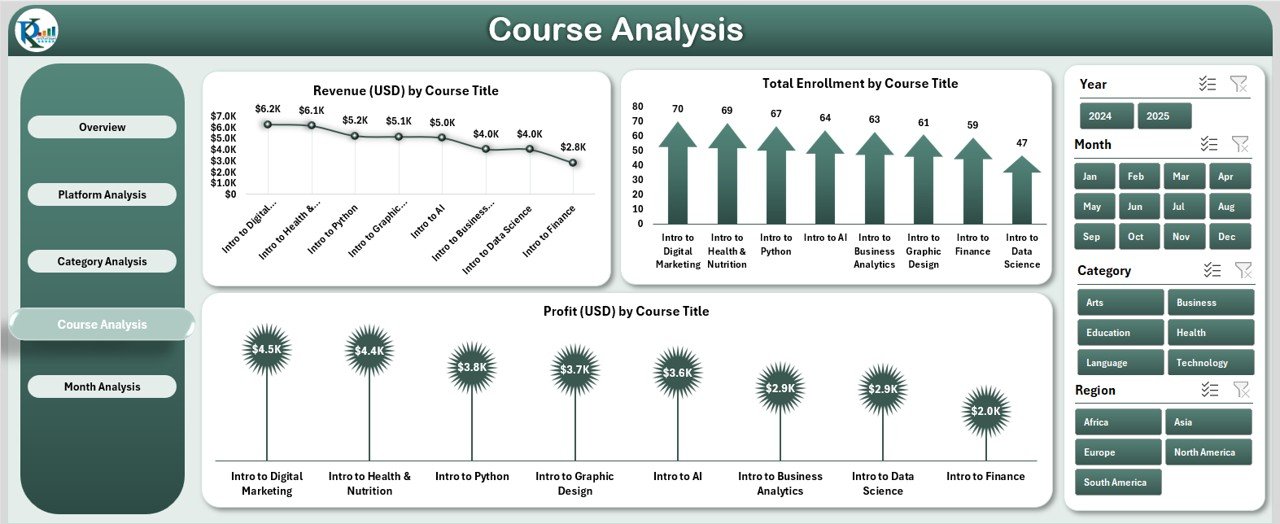
🎓 4️⃣ Course Analysis Page – Individual Course Breakdown
Track performance metrics at the course level.
Charts Displayed:
-
Revenue (USD) by Course Title
-
Total Enrolment by Course Title
-
Profit (USD) by Course Title
📊 Outcome: Identify which courses generate the most income, the highest enrollments, and the best margins.
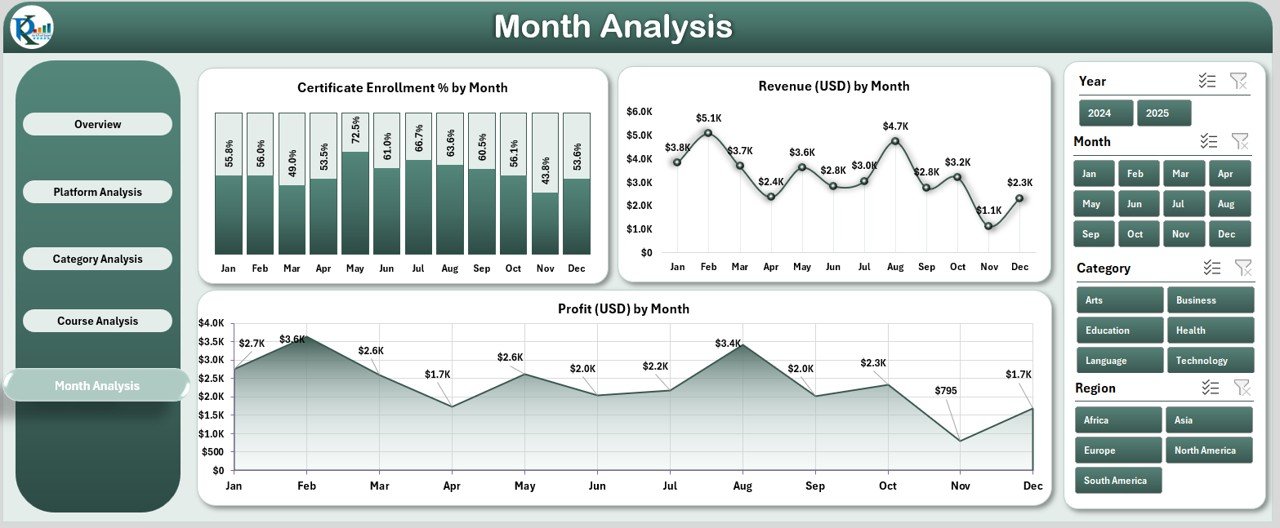
📅 5️⃣ Month Analysis Page – Time-Based Trends
Monitor growth and seasonality over time.
Charts Include:
-
Certificate Enrolment % by Month
-
Revenue (USD) by Month
-
Profit (USD) by Month
🧭 Benefit: Analyze seasonal trends, measure marketing effectiveness, and forecast upcoming performance.
⚙️ Support & Data Sheets
-
📑 Support Sheet: Backend automation logic for slicers, lookups, and chart interactivity.
-
📊 Data Sheet: Stores raw data such as course titles, platform names, ratings, and profits — the foundation of all analytics.
💼 Advantages of the Online Learning Platforms Dashboard
✅ Centralized Data Analysis: All metrics in one file — no more switching between multiple reports.
✅ Real-Time Insights: Charts and KPIs auto-update as data changes.
✅ Fully Customizable: Add KPIs like Completion Rate or Refund Rate.
✅ Cost-Effective: Excel-based analytics—no complex software required.
✅ Enhanced Decision-Making: Identify top courses and optimize content strategy.
✅ Instructor Evaluation: Compare ratings and feedback across instructors.
✅ Learner Satisfaction: Track and improve engagement through data insights.
✅ Scalable Design: Works for startups, institutions, or global e-learning companies.
🧠 Why Every E-Learning Business Needs This Dashboard
In the competitive world of online education, data drives growth. This Excel dashboard empowers you to:
-
Visualize profitability and growth patterns.
-
Compare platform and course performance.
-
Improve learner experience through data-backed insights.
-
Align goals with real-time KPIs.
-
Make smarter, faster strategic decisions.
In short — it turns Excel into your analytics powerhouse.
💡 How to Use the Dashboard
1️⃣ Input Data: Enter course, revenue, and enrolment info in the Data Sheet.
2️⃣ Refresh Pivots: Update pivot tables for live visuals.
3️⃣ Use Slicers: Filter results by platform, category, or time.
4️⃣ Analyze: Review trends and insights across pages.
5️⃣ Act: Identify underperformers, refine marketing, and boost revenue.
🧩 Customization Options
-
Add KPIs like Completion Rate or Learner Growth %.
-
Change slicers to show Instructor, Region, or Platform.
-
Modify color schemes to match your branding.
-
Expand to multi-year reporting for deeper trend analysis.
🧭 Best Practices
✅ Keep data clean and consistent.
✅ Refresh weekly or monthly.
✅ Focus visuals on key KPIs.
✅ Protect sensitive information.
✅ Maintain a backup file.
🏁 Conclusion
The Online Learning Platforms Dashboard in Excel is more than a spreadsheet — it’s a strategic analytics hub for your e-learning business.
Whether you’re an instructor, EdTech founder, or training manager, this dashboard delivers real-time insights that help you grow revenue, improve satisfaction, and scale operations confidently.
📈 Turn your data into decisions. Empower your online learning journey with Excel.


Reviews
There are no reviews yet.