Want to maximize your office space efficiency? The Office Utilization Dashboard in Excel is your all-in-one solution to track bookings, monitor occupancy, and analyze space usage trends—right from a beautifully designed Excel template. Whether you’re managing a single location or multiple office floors, this dashboard helps you make smart, data-driven decisions about space allocation.
From visual charts to automated KPIs, this dashboard empowers your workplace strategy with clarity, accountability, and productivity insights.
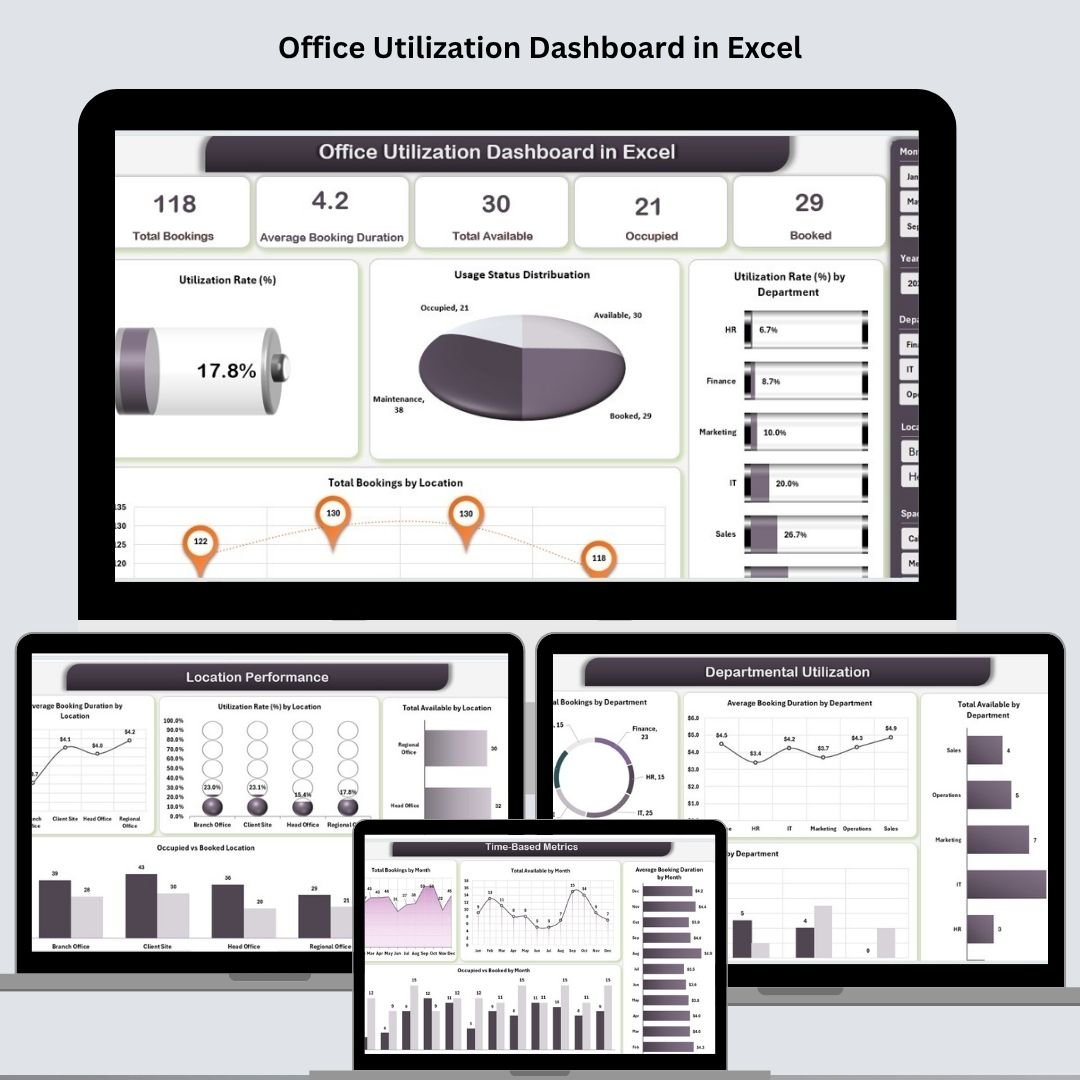
⚙️ Key Features of the Office Utilization Dashboard in Excel
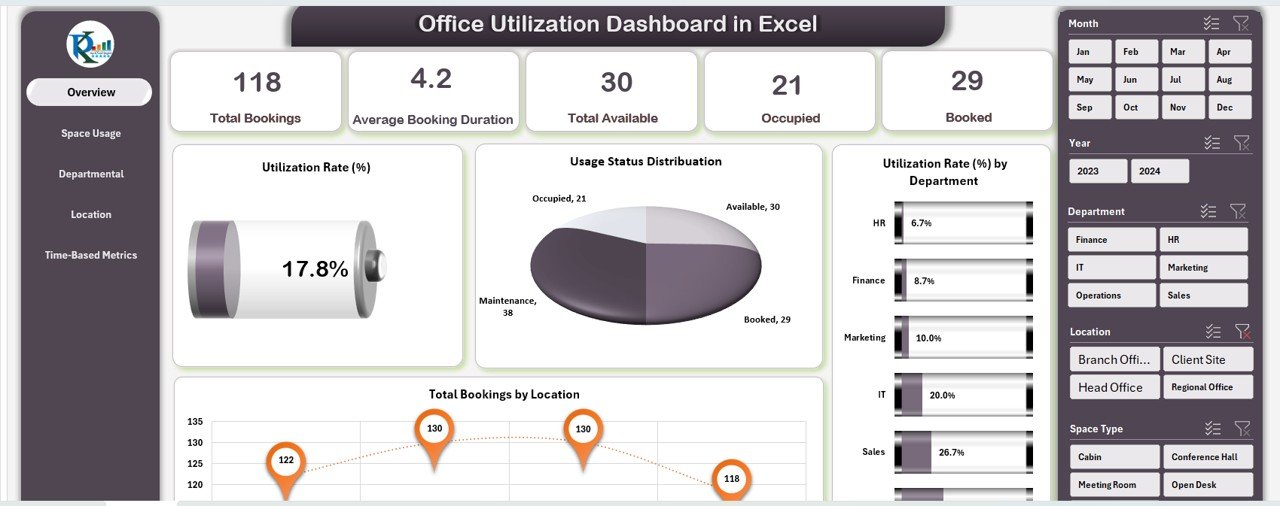
📋 Overview Sheet Tab – Your Command Center
Get a quick summary of your space usage metrics in one glance:
-
📅 Total Bookings – Count of all bookings made
-
⏱️ Average Booking Duration – Time slots typically booked
-
🟢 Total Available – Number of bookable spaces
-
🔴 Occupied Spaces – Currently in-use rooms
-
📘 Booked Spaces – Reservations in the pipeline
Visual Charts Included:
-
📈 Utilization Rate (%)
-
📊 Usage Status Distribution
-
🏢 Utilization Rate by Department
-
🌍 Total Bookings by Location
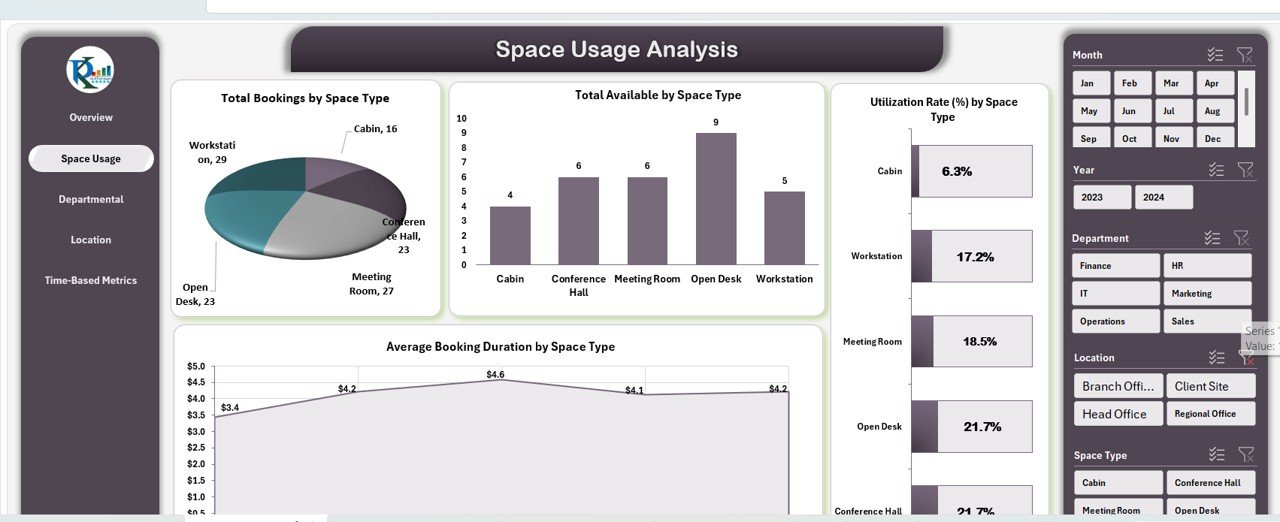
📊 Space Usage Analysis Sheet Tab
Explore how various space types are performing:
-
📦 Bookings by Space Type (e.g., Conference Room, Cubicle)
-
📋 Total Availability by Type
-
📈 Utilization Rate by Type
-
⏱️ Average Duration by Space Type
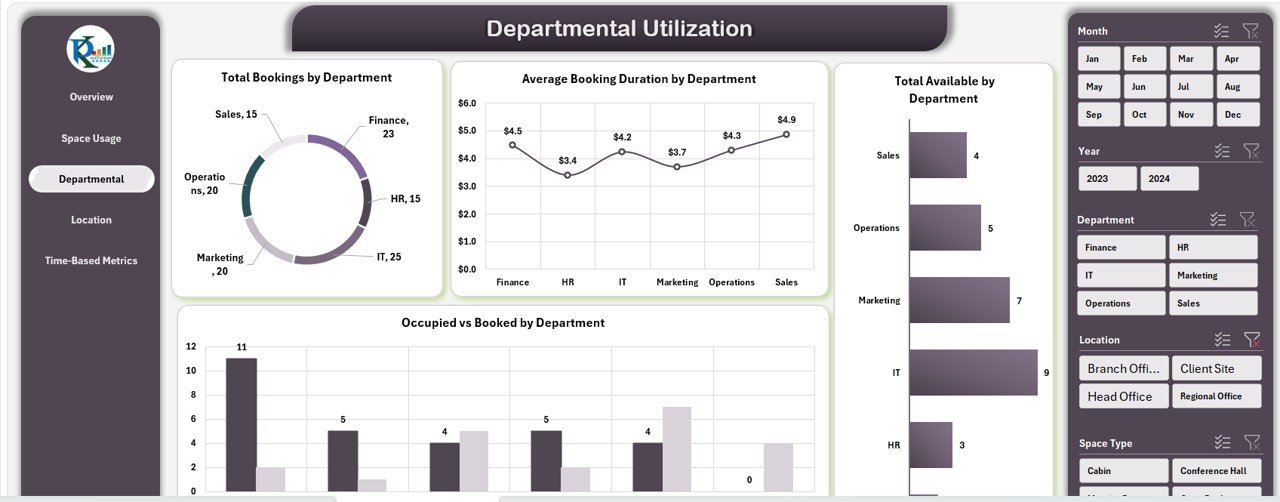
🏢 Departmental Utilization Sheet Tab
Analyze space usage at the departmental level:
-
🧑💼 Bookings by Department
-
🕒 Average Booking Duration by Department
-
📘 Total Availability by Department
-
⚖️ Occupied vs Booked Comparison
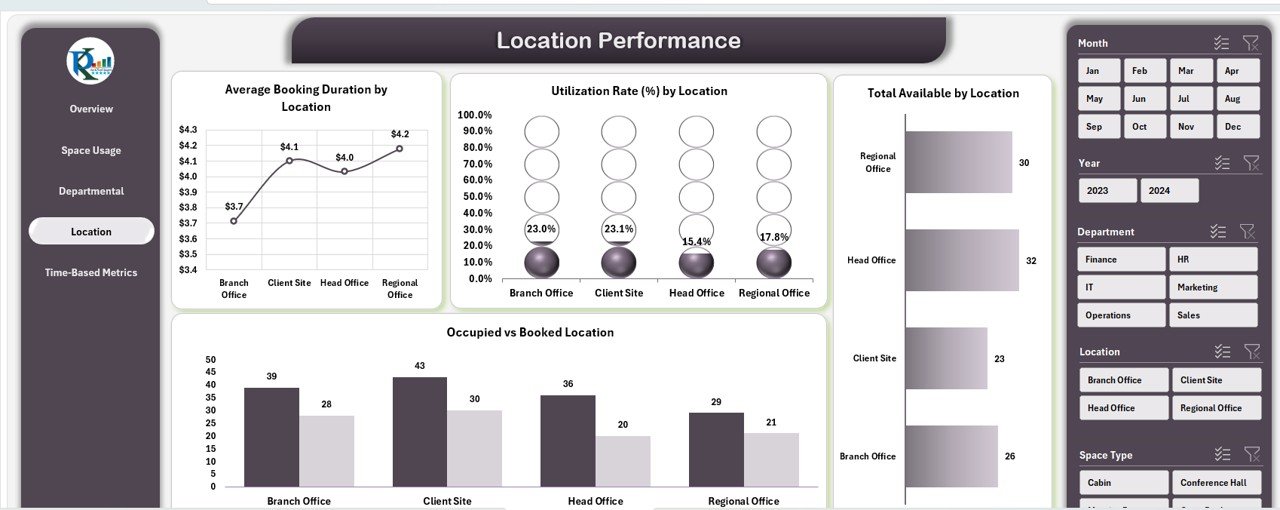
📍 Location Performance Sheet Tab
Track how each office location is performing:
-
📅 Booking Duration by Location
-
📊 Utilization Rate by Location
-
🟩 Occupied vs Booked by Location
-
📘 Availability by Office
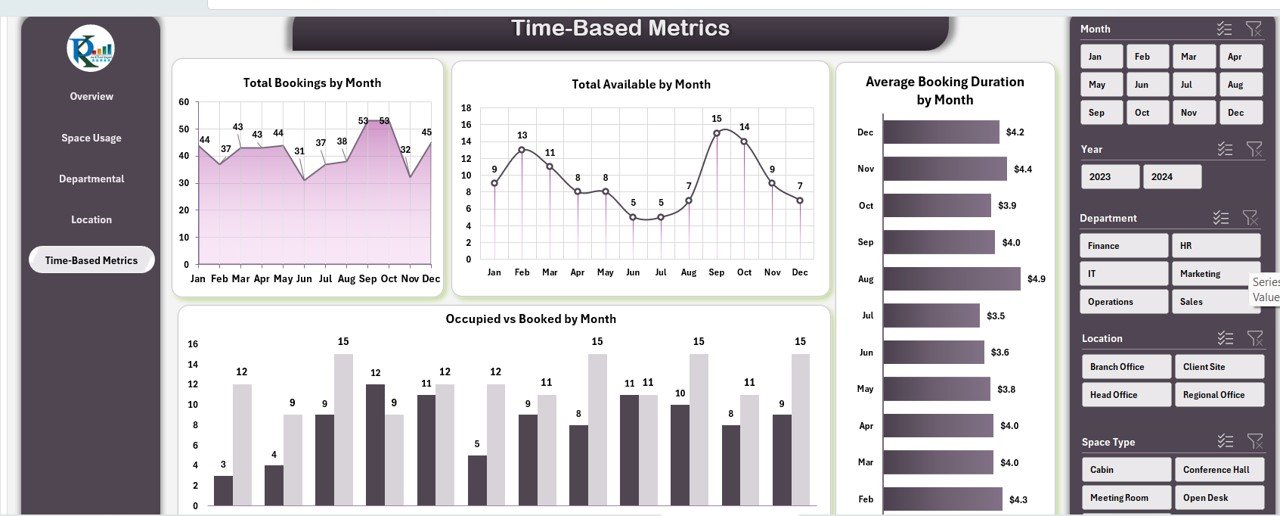
📆 Time-Based Metrics Sheet Tab
View usage trends over time to identify seasonal patterns:
-
📈 Bookings by Month
-
📘 Availability by Month
-
⏱️ Average Duration by Month
-
🔁 Occupied vs Booked per Month
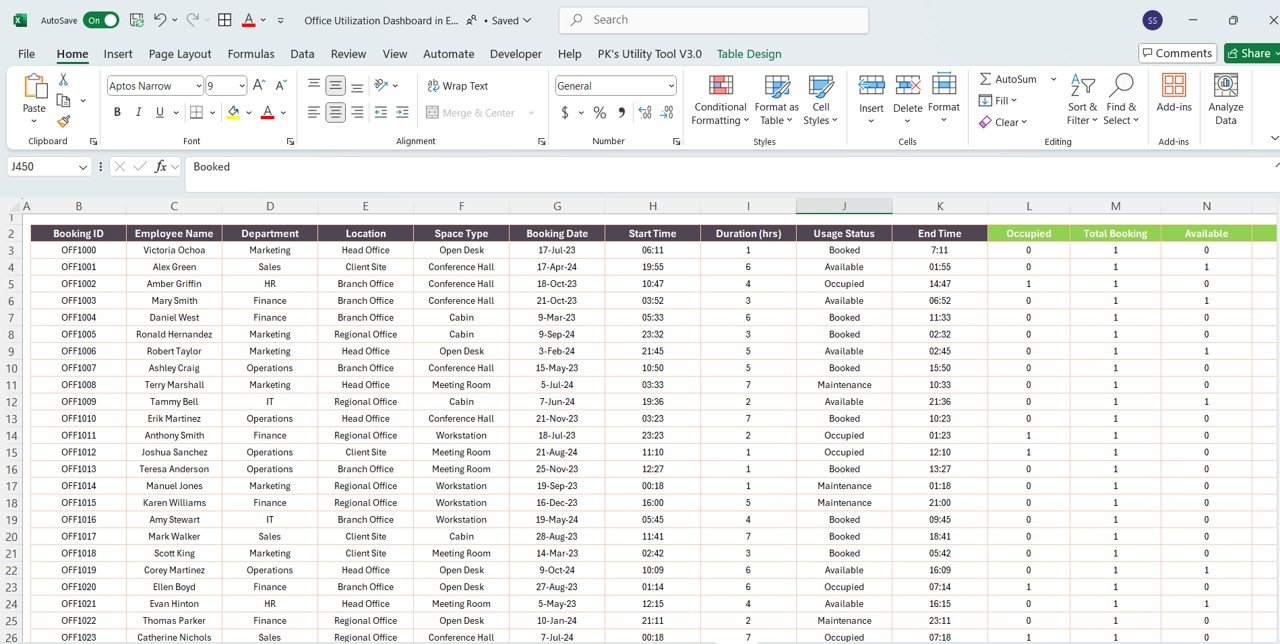
📥 Data Sheet Tab – Backend Input
Easily manage all dashboard content by updating this sheet:
-
📝 Booking Records
-
📍 Location Details
-
🏢 Department Names
-
📋 Space Types
-
📅 Dates & Duration
Just update your entries and the dashboard auto-updates!
📌 How to Use the Office Utilization Dashboard
1️⃣ Open the Template in Excel
No add-ons or installations needed.
2️⃣ Input Your Data
Use the Data Sheet to enter bookings, occupancy, and availability details.
3️⃣ Explore the Dashboard Tabs
Navigate across Overview, Department, Space Type, Time Trends, and more.
4️⃣ Analyze Key Metrics
Utilize built-in charts and KPIs to identify bottlenecks and optimize space usage.
5️⃣ Update Weekly or Monthly
Keep your data current to generate meaningful trends and analytics.
🎯 Who Can Benefit from This Dashboard?
🏢 Office Managers – Maximize workspace productivity
📊 Operations Teams – Monitor usage and allocate space wisely
📍 Real Estate Analysts – Optimize cost per sq. ft.
🧑💼 HR & Admin Staff – Track department-level usage
🧑💻 Facility Coordinators – Reduce underutilized spaces
Whether you’re managing 10 or 1,000 desks—this dashboard scales to fit.
💡 Why Choose This Excel Office Utilization Dashboard?
✅ All-in-one workplace analytics tool
✅ Visual and interactive dashboards
✅ No coding or software required—just Excel
✅ Fully editable to match your workflow
✅ Designed for real-time analysis & updates
✅ Helps reduce space waste and improve ROI
🔗 Click here to read the Detailed blog post
Click here to read the Detailed blog post


Reviews
There are no reviews yet.