Controlling office utility expenses should not feel complicated. Yet rising electricity rates, unpredictable water tariffs, demand charges, and late fees make cost management difficult. If you rely on scattered Excel sheets, you are already losing visibility.
The Office Utility Cost Dashboard in Power BI gives you complete financial control in one powerful, interactive solution. It converts raw invoice data into clear visuals, meaningful KPIs, and department-wise insights. Instead of guessing where money goes, you see everything instantly.
Whether you manage one office or multiple buildings, this dashboard helps you reduce waste, improve budgeting accuracy, and strengthen profitability.
🚀 Key Features of Office Utility Cost Dashboard in Power BI
This ready-to-use Power BI solution includes 5 fully interactive pages designed for deep utility cost analysis:
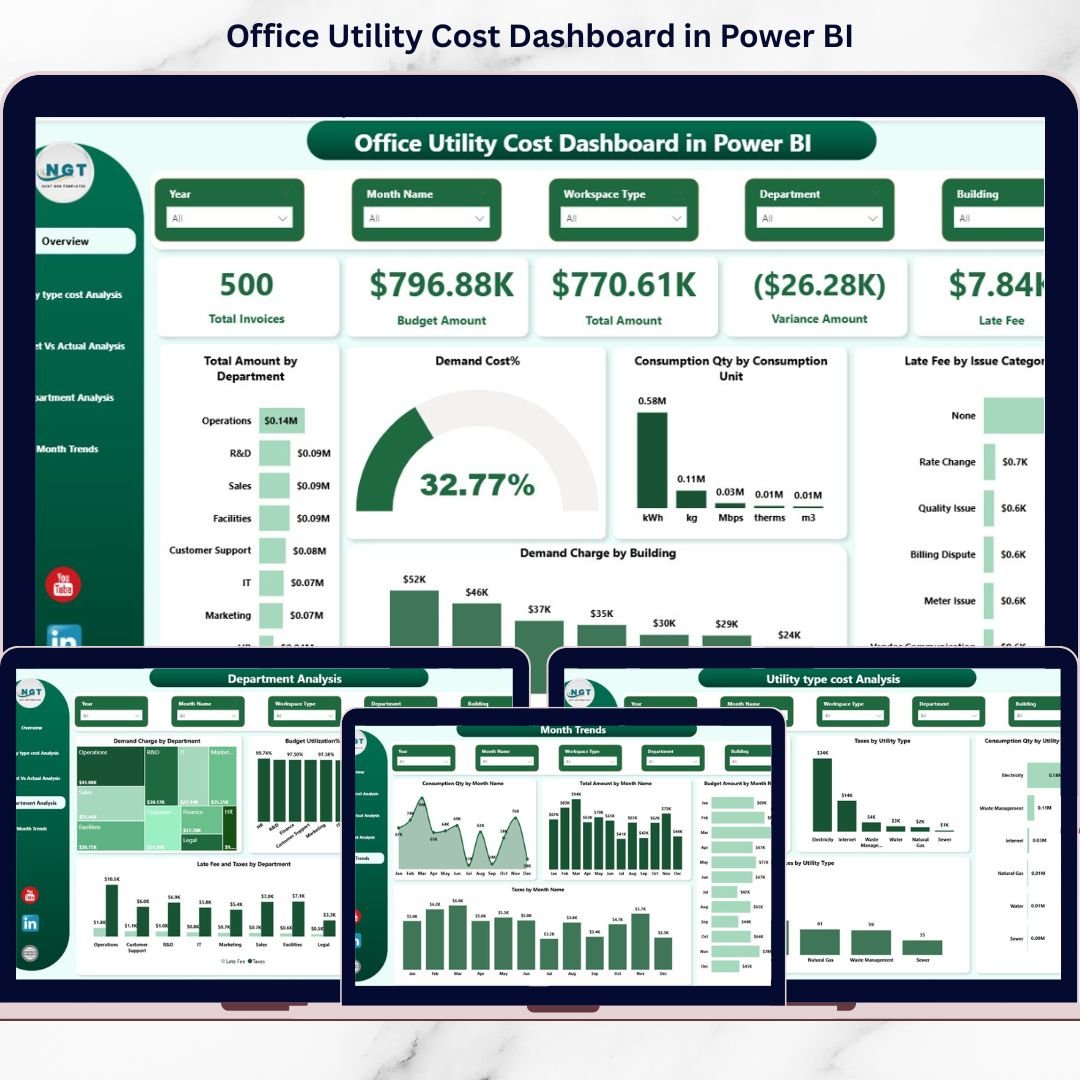
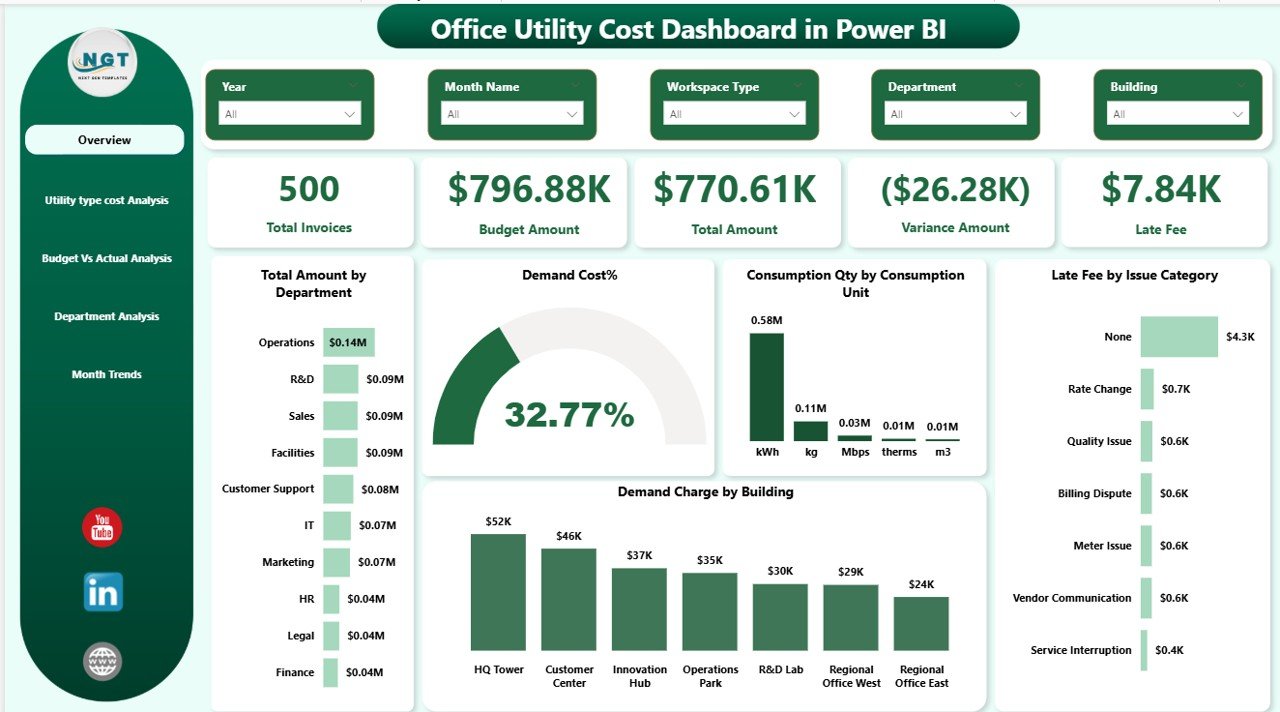
✔️ Overview Page
Monitor Total Invoices, Budget Amount, Total Amount, Variance, and Late Fees in one snapshot. Instantly filter by Month, Department, Building, or Utility Type.
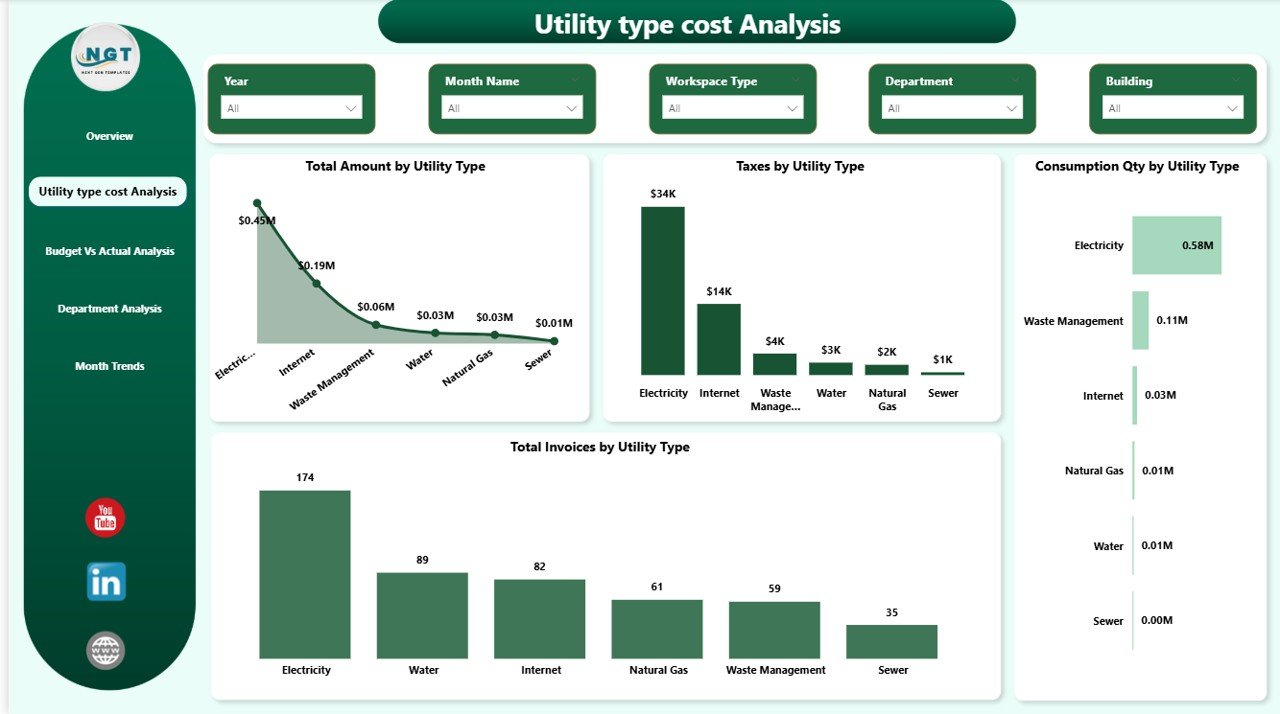
✔️ Utility Type Cost Analysis
Analyze Electricity, Water, Gas, Demand Charges, Taxes, and Consumption Quantity by category.
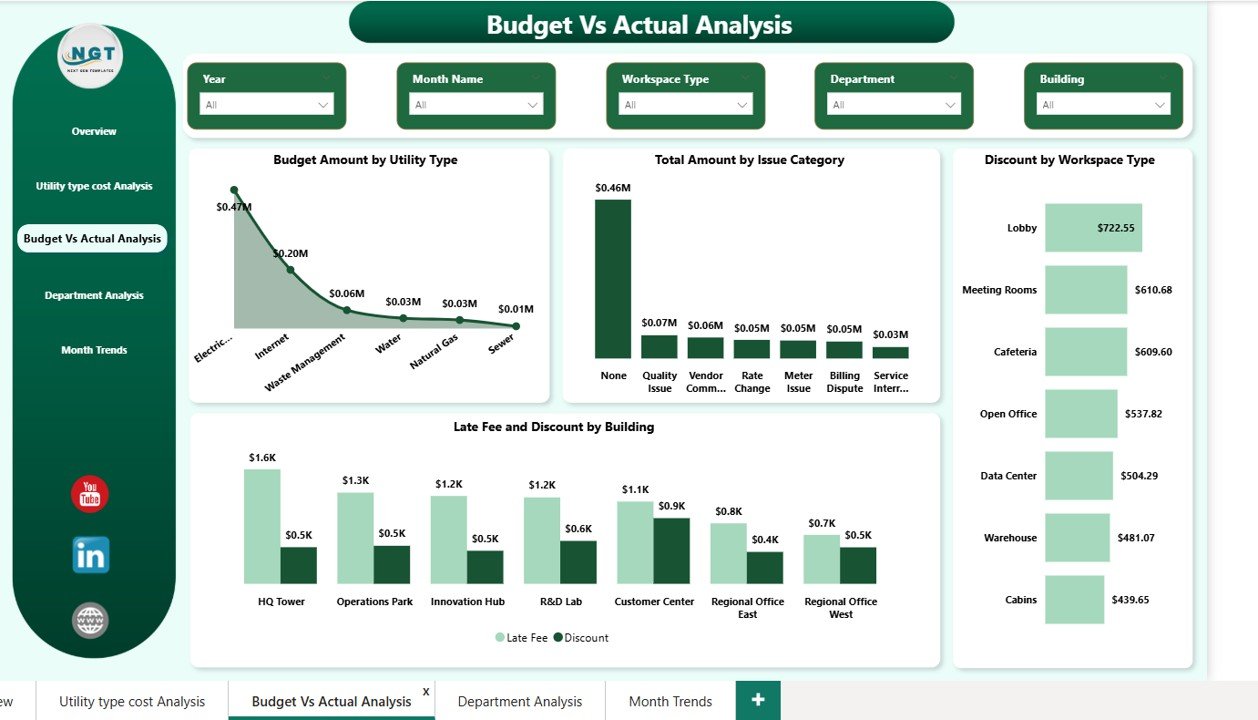
✔️ Budget vs Actual Analysis
Compare planned budgets with actual spending. Identify overspending quickly and take corrective action.
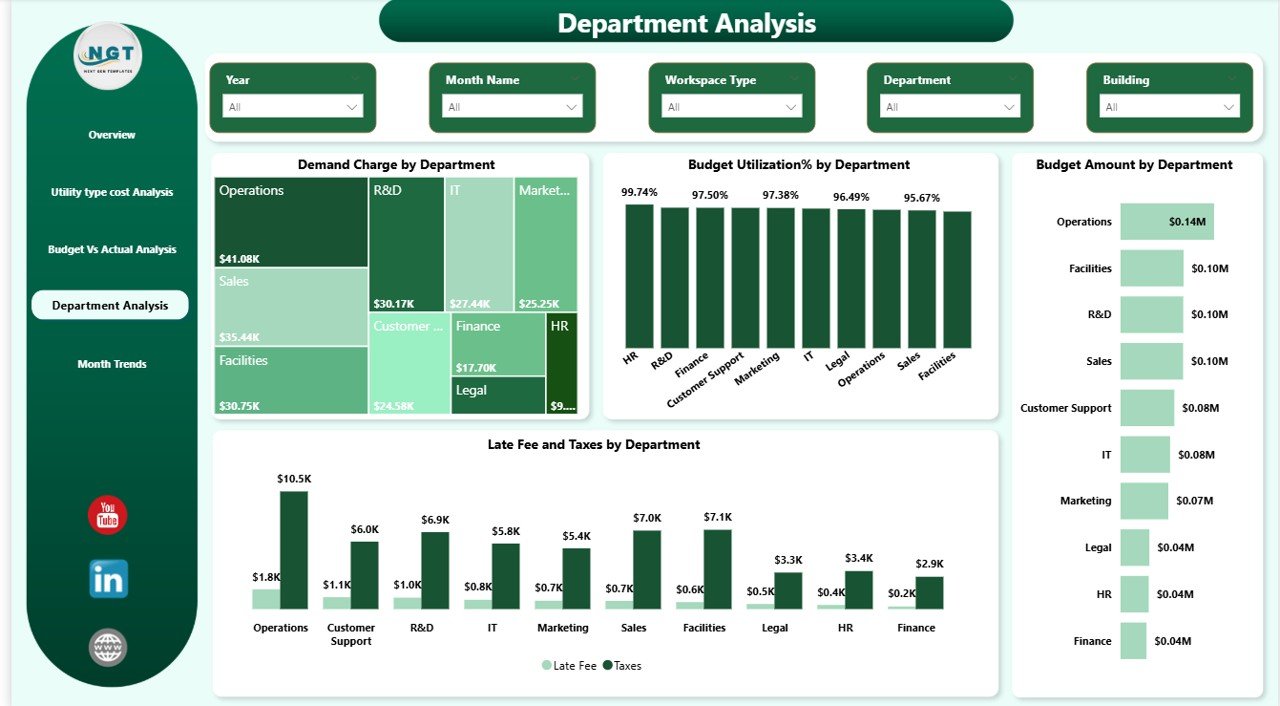
✔️ Department Analysis
Track Demand Charges, Budget Utilization %, Late Fees, and Taxes department-wise for better accountability.
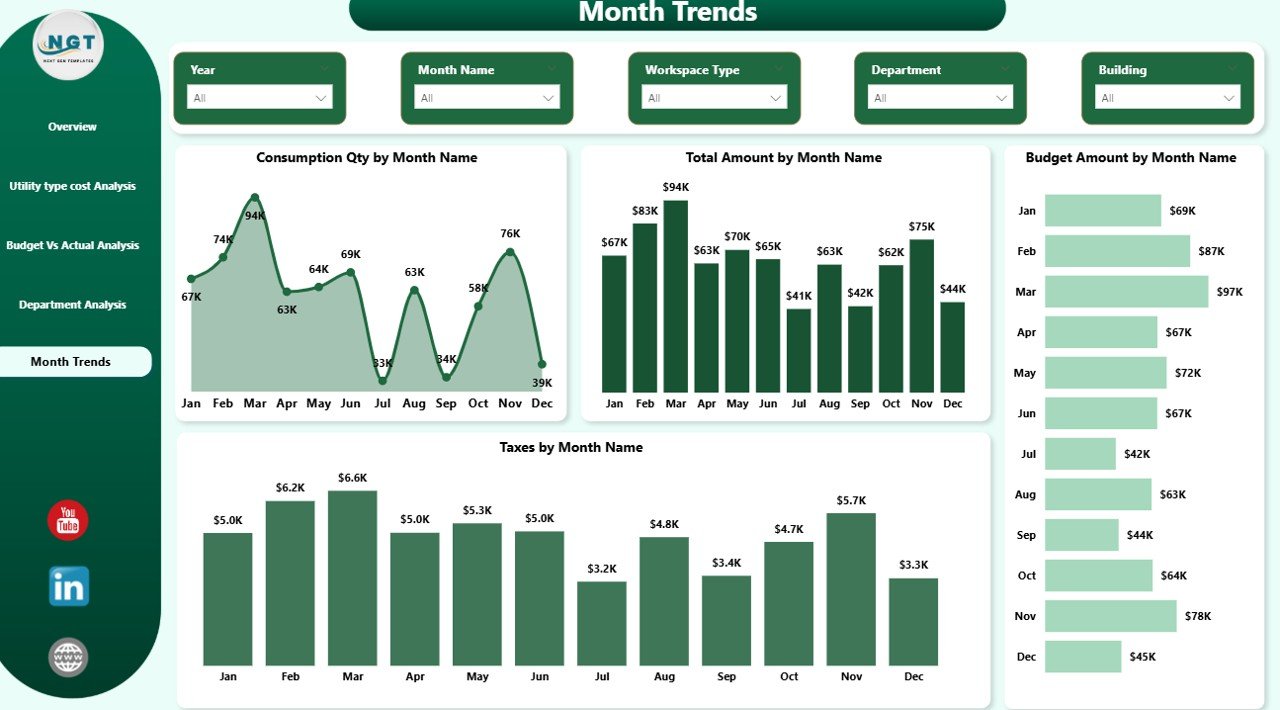
✔️ Monthly Trends Page
Monitor Consumption, Total Amount, Budget Amount, and Taxes month-by-month to detect seasonal spikes.
Because of interactive slicers and drill-down features, you can analyze data within seconds without complex formulas.
📦 What’s Inside the Office Utility Cost Dashboard in Power BI
When you download this product, you receive:
📊 A professionally designed 5-page Power BI dashboard file
📈 Pre-built KPI cards and interactive charts
📂 Structured data model for utility invoice tracking
⚙️ Ready-to-use slicers for filtering by Month, Department, Building & Utility Type
📉 Budget vs Actual comparison visuals
🏢 Department and building-wise accountability reports
📅 Monthly trend analysis dashboard
📘 Easy-to-follow instructions for setup and data updates
Everything is designed for immediate use. Just connect your invoice data and start analyzing.
🛠️ How to Use the Office Utility Cost Dashboard in Power BI
Using this dashboard is simple and user-friendly:
1️⃣ Import your utility invoice data into the provided structure.
2️⃣ Update budget allocation by department and utility type.
3️⃣ Refresh the Power BI dashboard.
4️⃣ Use slicers to filter data by month, building, or department.
5️⃣ Monitor KPI cards for variance and late fees.
6️⃣ Analyze trends and take corrective financial actions.
Within minutes, you gain complete visibility over your office utility expenses.
Because Power BI supports dynamic filtering and drill-through, deeper analysis becomes effortless.
🎯 Who Can Benefit from This Office Utility Cost Dashboard in Power BI
This dashboard is ideal for:
💼 Finance Teams managing budgets
🏢 Facility Managers controlling energy usage
⚙️ Operations Managers tracking building performance
🌱 Energy Management Teams optimizing consumption
👔 Corporate Leadership monitoring financial health
🏗️ Real Estate & Infrastructure Managers handling multiple properties
If your organization manages multiple buildings, departments, or high energy consumption operations, this dashboard becomes even more powerful.
Why This Dashboard Is a Smart Investment
✔️ Reduce overspending by identifying variance instantly
✔️ Detect unusual consumption spikes early
✔️ Minimize late fees with visibility
✔️ Improve department accountability
✔️ Strengthen budget forecasting
✔️ Centralize all utility data in one place
Even a 5–10% reduction in energy waste can create significant annual savings. This dashboard helps you achieve that.
Conclusion
Utility costs directly impact profitability. Without proper monitoring, small inefficiencies turn into major expenses.
The Office Utility Cost Dashboard in Power BI transforms scattered invoices into strategic insights. It improves transparency, speeds up decisions, and strengthens financial discipline.
If you want smarter energy control, stronger budgeting, and better operational efficiency, this ready-to-use dashboard is your complete solution.
Click here to read the Detailed blog post
Watch the step-by-step video tutorial: