


Office emergencies never give advance notice. However, organizations that prepare early always respond better, protect employees, and control losses effectively. That is exactly where the Office Emergency Preparedness Dashboard in Excel becomes a powerful decision-making tool.
This ready-to-use Excel dashboard transforms scattered emergency records into a clear, visual, and actionable reporting system. Instead of juggling multiple spreadsheets, emails, and reports, you get a single, structured dashboard that shows budgets, attendance, risks, injuries, vendor performance, and monthly trends at a glance.
Built completely in Microsoft Excel, this dashboard requires no advanced technical skills. As a result, HR teams, safety officers, finance teams, and leadership can collaborate smoothly while staying fully informed about workplace emergency readiness.
🚀 Key Features of Office Emergency Preparedness Dashboard in Excel
✅ Centralized emergency data tracking to eliminate fragmented records
📊 Interactive KPIs and charts for instant decision-making
💰 Budget tracking with variance analysis to control emergency spending
👥 Participation and attendance monitoring across departments
⚠️ Risk-level and injury analysis to identify vulnerable areas
🏢 Workspace-wise and department-wise insights for targeted actions
📈 Monthly trend analysis to support proactive planning
🔧 Fully customizable Excel structure without external tools
Each feature focuses on clarity, speed, and accuracy, ensuring emergency preparedness never becomes an afterthought.

📂 What’s Inside the Office Emergency Preparedness Dashboard in Excel
This digital product includes multiple well-structured Excel sheets, each designed for a specific analytical purpose:
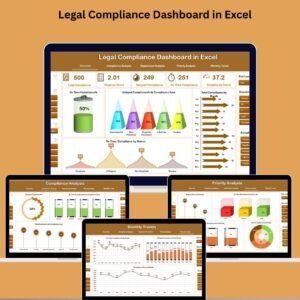
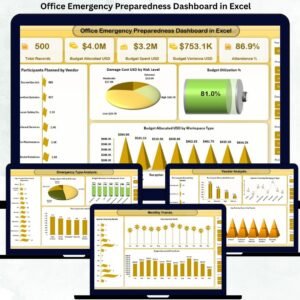
📌 Overview Sheet
Shows Total Records, Budget Allocated, Budget Spent, Budget Variance, Attendance %, Budget Utilization %, Damage Cost by Risk Level, and workspace-wise budget allocation.
📌 Emergency Type Analysis Sheet
Analyzes Budget Spent by Risk Level, Participants Attended by Emergency Type, and Budget Utilization by Responder Teams.
📌 Department Analysis Sheet
Tracks Participants Planned by Department, Budget Spent by Vendor, Attendance % by Risk Level, and Average Risk Score by Department.
📌 Vendor Analysis Sheet
Evaluates Participants Attended by Vendor, Injuries by Workspace Type, and Average Training Score % by Vendor.
📌 Monthly Trends Sheet
Displays Injuries Count by Month, Budget Allocation by Month, and Average Impact over time.
Together, these sheets provide a 360-degree view of emergency preparedness.
🛠️ How to Use the Office Emergency Preparedness Dashboard in Excel
Using this dashboard is simple and fast:
1️⃣ Enter emergency preparedness data into the structured tables
2️⃣ Refresh pivot tables if needed
3️⃣ Apply filters by department, emergency type, risk level, or vendor
4️⃣ Review KPIs, charts, and trends instantly
5️⃣ Identify gaps and take corrective actions
Because everything runs inside Excel, users stay in a familiar environment without extra learning curves.
👥 Who Can Benefit from This Office Emergency Preparedness Dashboard in Excel
This dashboard is ideal for:
🏢 Corporate offices and business parks
💻 IT companies and shared workspaces
🏭 Manufacturing and industrial offices
🏥 Healthcare administrative teams
🎓 Educational institutions
🏛️ Government and public sector offices
In short, any organization serious about employee safety and emergency readiness will benefit from this dashboard.
Click here to read the Detailed blog post
Watch the step-by-step video tutorial:


Reviews
There are no reviews yet.