


🔑 Key Features of Nonprofit Fundraising Dashboard in Excel
Nonprofit Fundraising Dashboard in Excel is a powerful, ready-to-use analytics template built for nonprofit organizations, charity managers, and fundraising coordinators who need to track donations, monitor campaign performance, and analyze donor behavior — all in one place. This comprehensive Excel dashboard template includes 5 interactive analysis pages, a structured data sheet, and a support sheet with pivot tables that auto-refresh your entire dashboard with a single click.
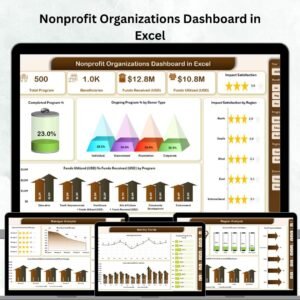
Whether you manage a small community nonprofit or a large fundraising operation, this template gives you instant visibility into Total Donations, Fulfillment Rates, Campaign ROI, Donor Segmentation, and Regional Performance. The dashboard tracks key fundraising metrics including Total Donations, Total Fulfilled, Total Pledged, Total Records, and Fulfillment Percentage — giving you a complete picture of your fundraising health at a glance.
📦 What’s Inside the Nonprofit Fundraising Dashboard in Excel
This Excel dashboard template features 7 professionally designed worksheets covering every aspect of nonprofit fundraising analytics:
📊 Overview Page: Your high-level command center displaying 5 key metric cards — Total Donations, Total Fulfilled, Total Pledged, Total Records, and Fulfillment %. Interactive slicers let you filter the entire dashboard instantly. Visual charts show Total Donations by Campaign and Total Donations by Region for quick strategic insights.
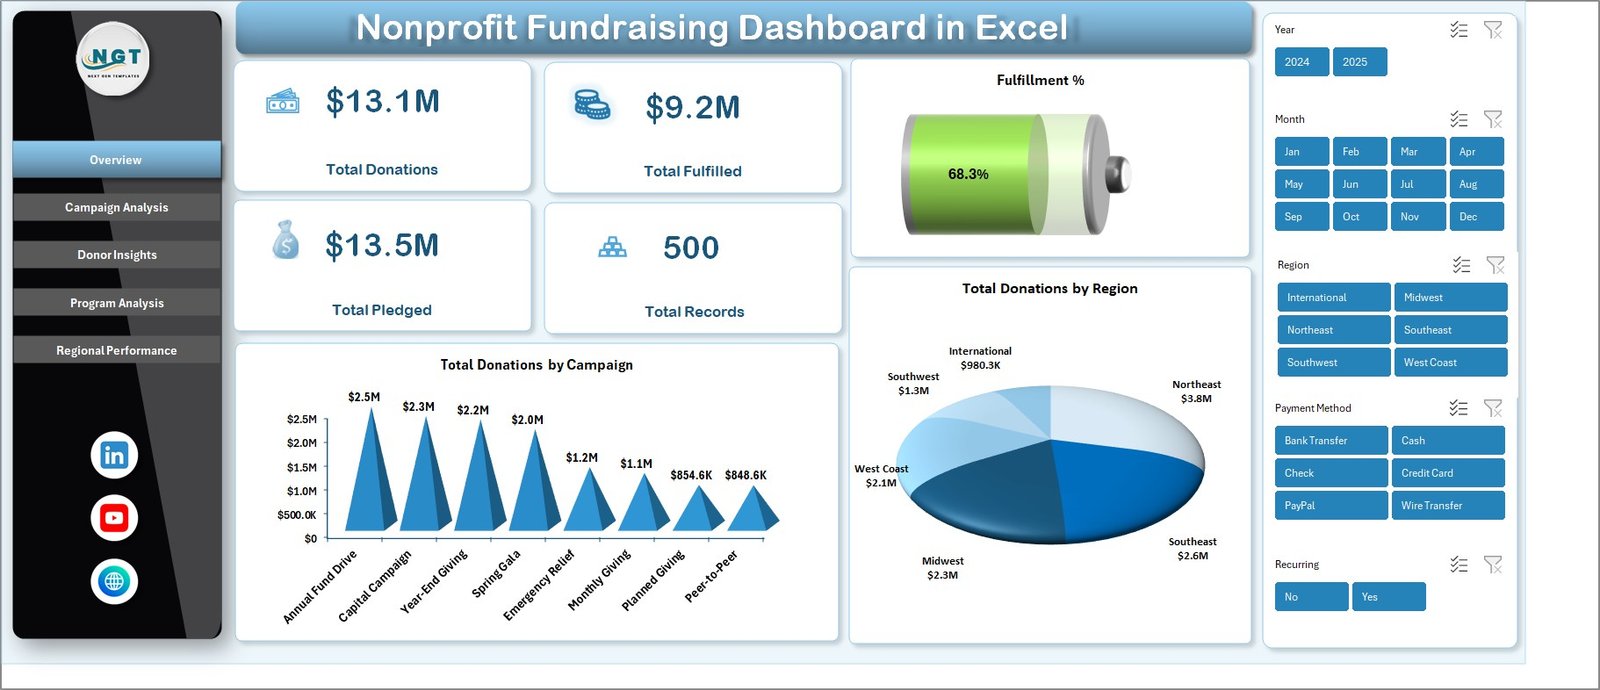 Nonprofit Fundraising Dashboard in Excel
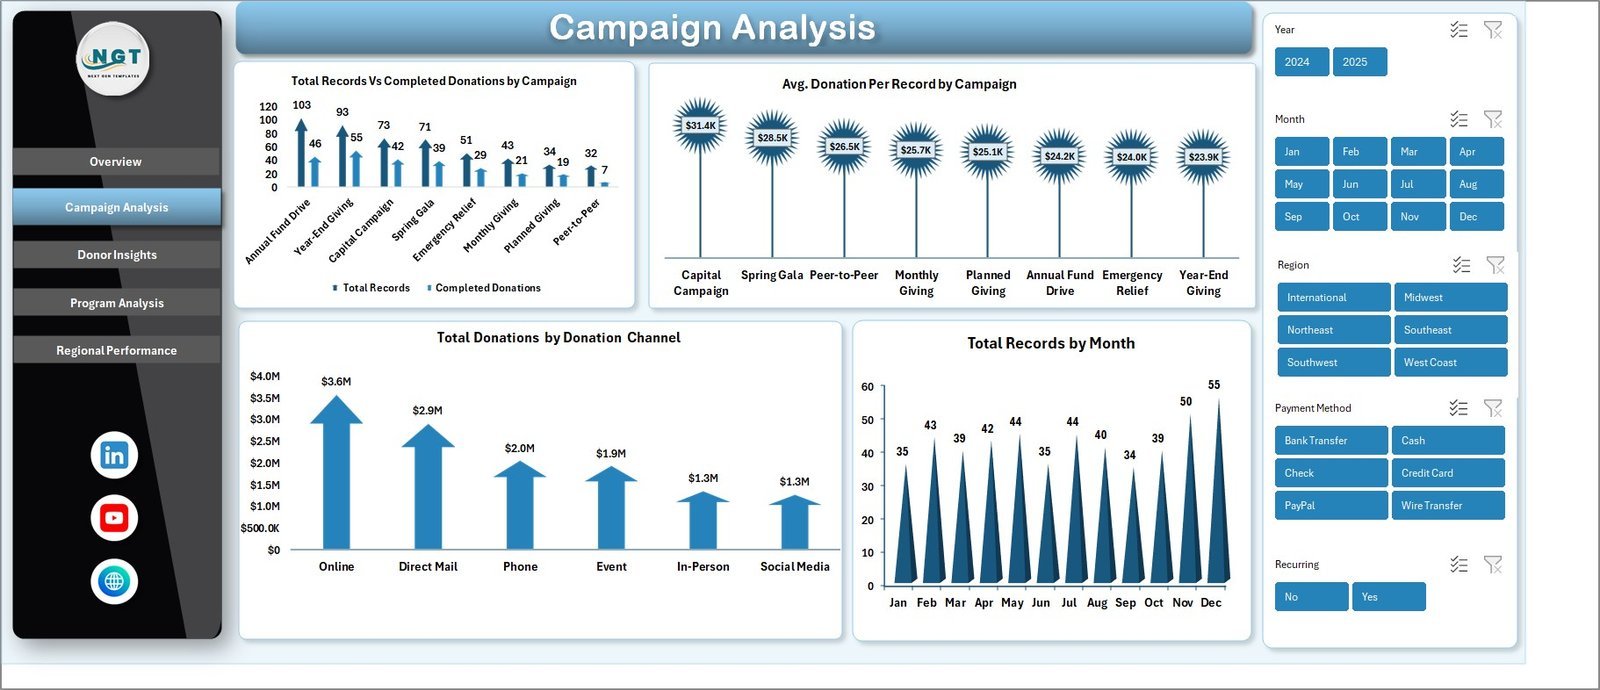
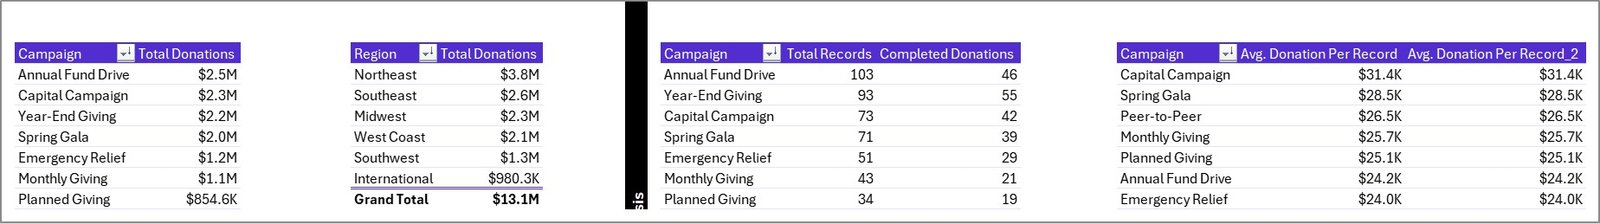
📈 Campaign Analysis Page: Dive deep into campaign-level performance with charts showing Total Records Vs Completed Donations by Campaign, Average Donation Per Record by Campaign, Total Donations by Donation Channel, and Total Records by Month. Identify which campaigns deliver the best results and optimize your fundraising strategy accordingly.
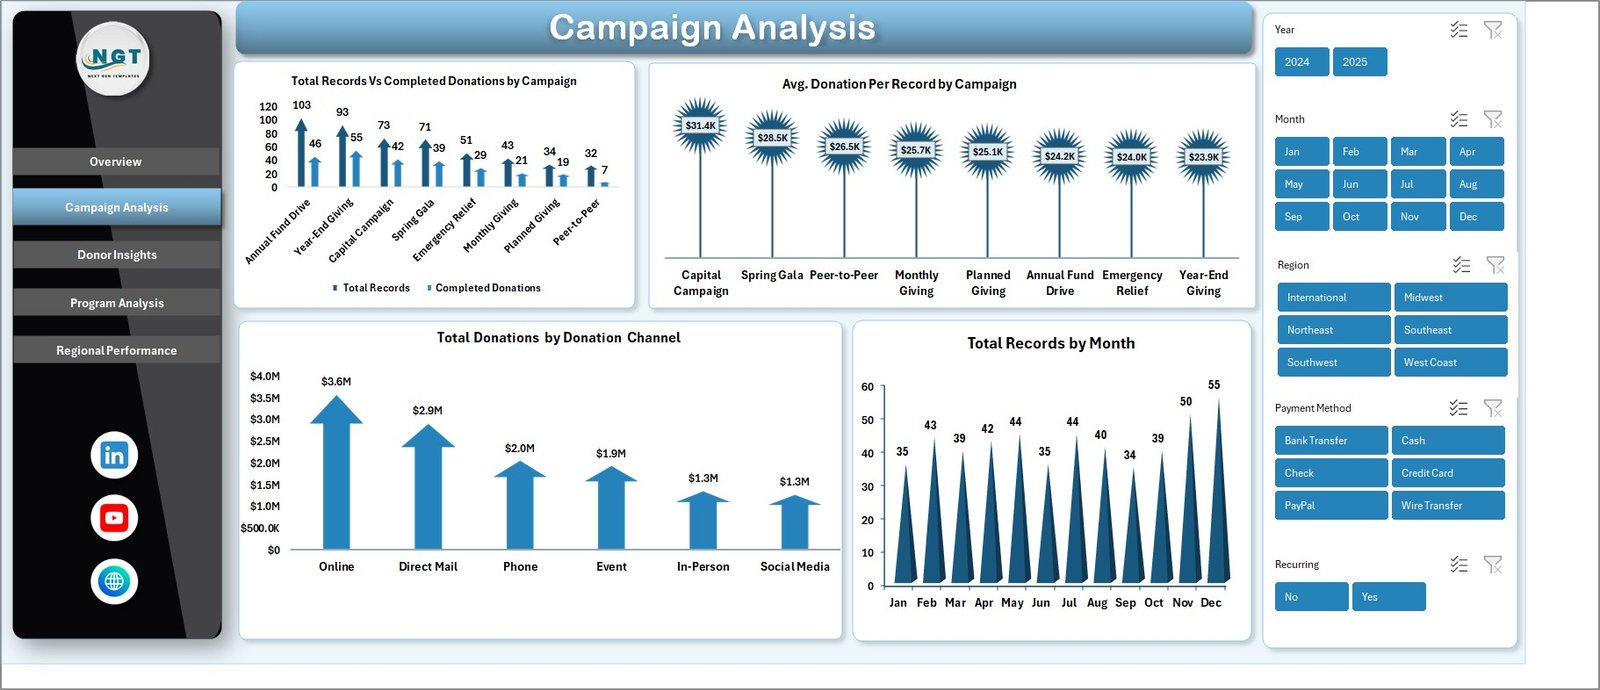 Campaign Analysis
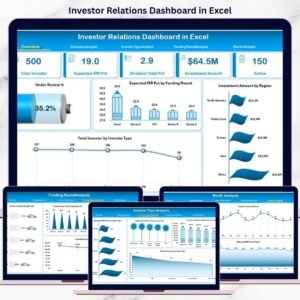
👥 Donor Insights Page: Understand your donor base with visualizations for Total Donations Vs Total Acquisition Cost by Donor Type, Total Records Vs Recurring Donors by Donor Type, Total Donations by Payment Method, and Total Records by Region. This page helps you identify your most valuable donor segments and optimize acquisition spending.
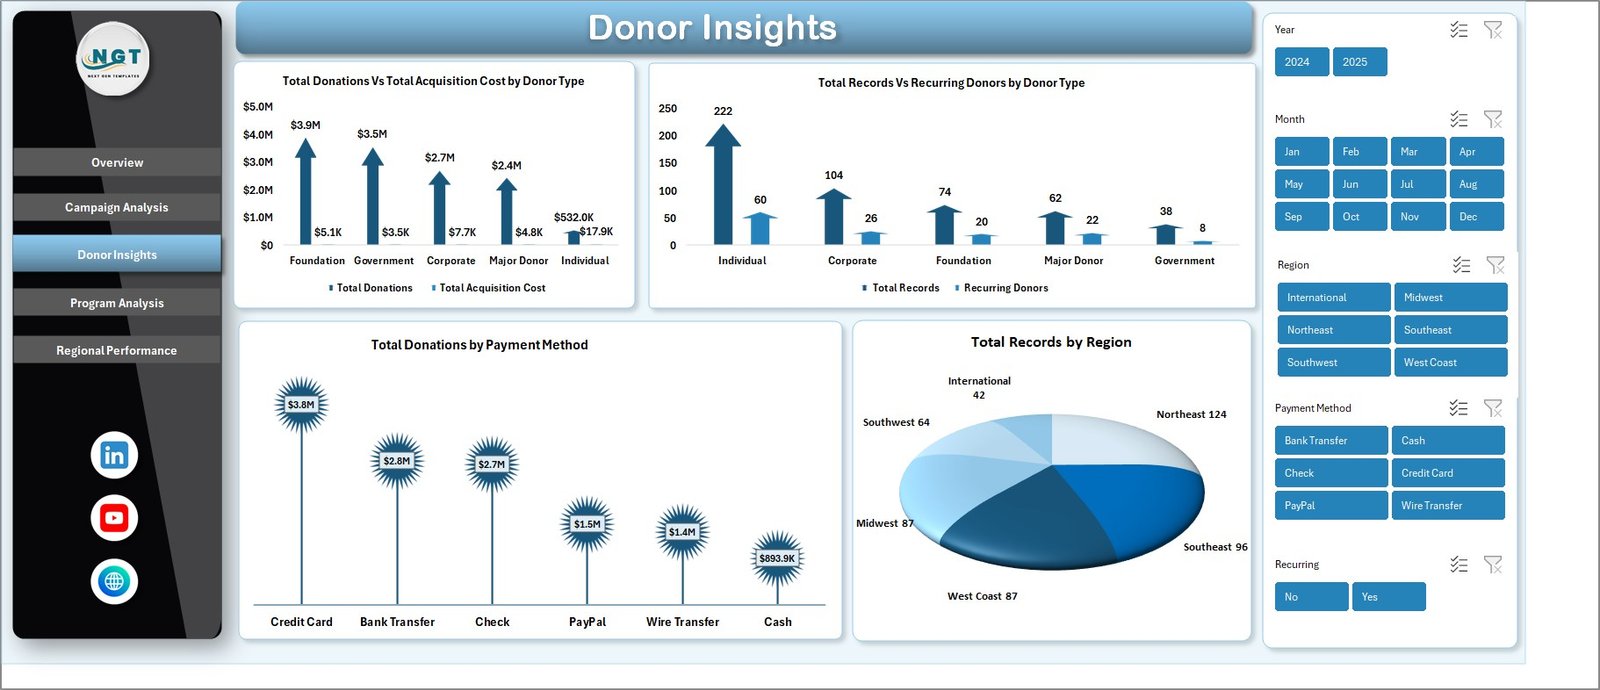 Donor Insights
🏢 Program Analysis Page: Evaluate program effectiveness through Total Donations Vs Total Fulfilled by Program Area, Total Records by Program Area, Total Donations by Status, and Total Donations Vs Total Records by Recurring. See which programs attract the most donations and where fulfillment gaps exist.
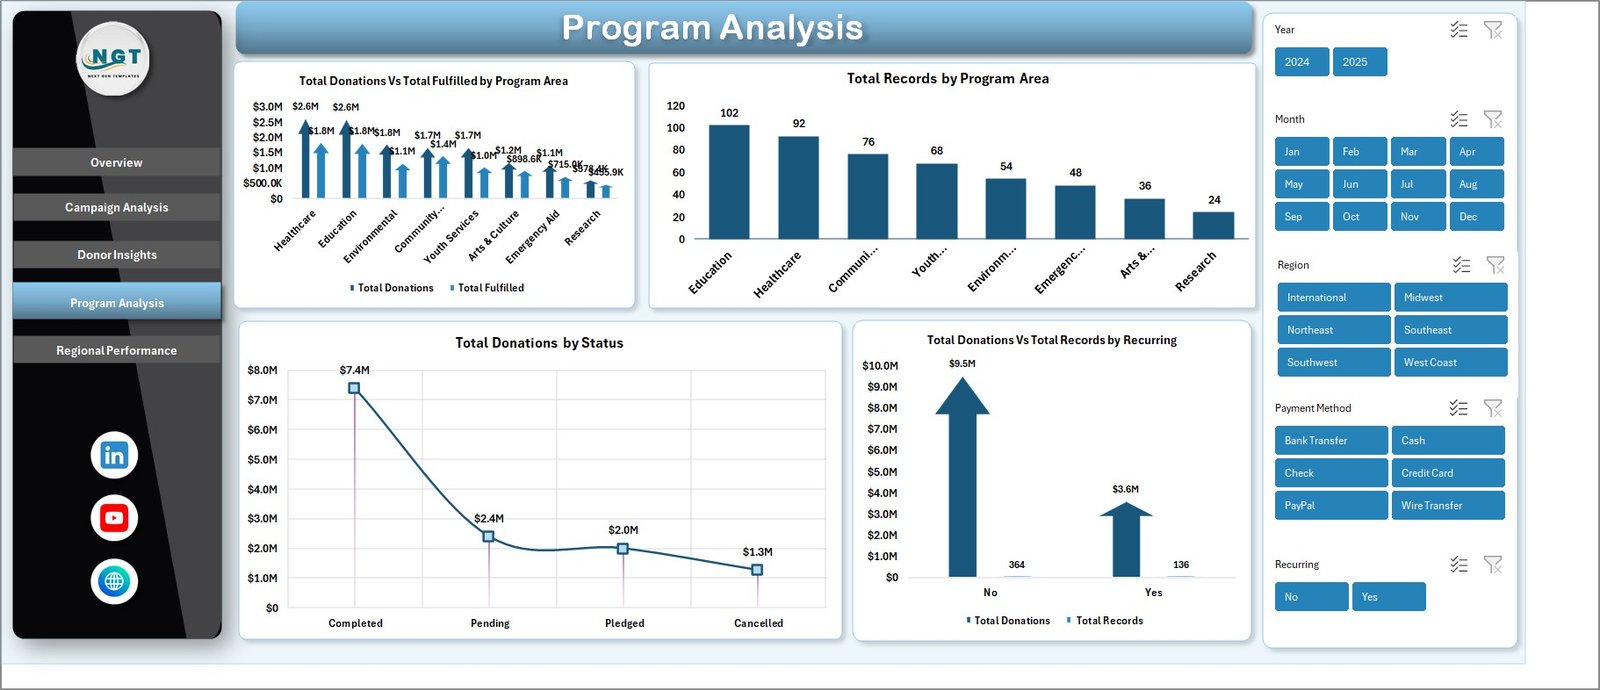 Program Analysis
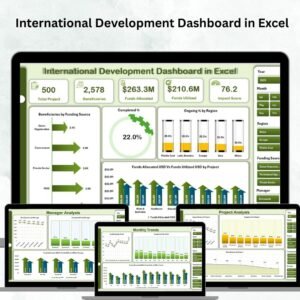
🌍 Regional Performance Page: Compare geographic performance with Total Fulfilled Vs Total Pledged by Region, Average Donor Rating by Region, and Total Donations by Year. Discover which regions outperform targets and where to focus future fundraising efforts.
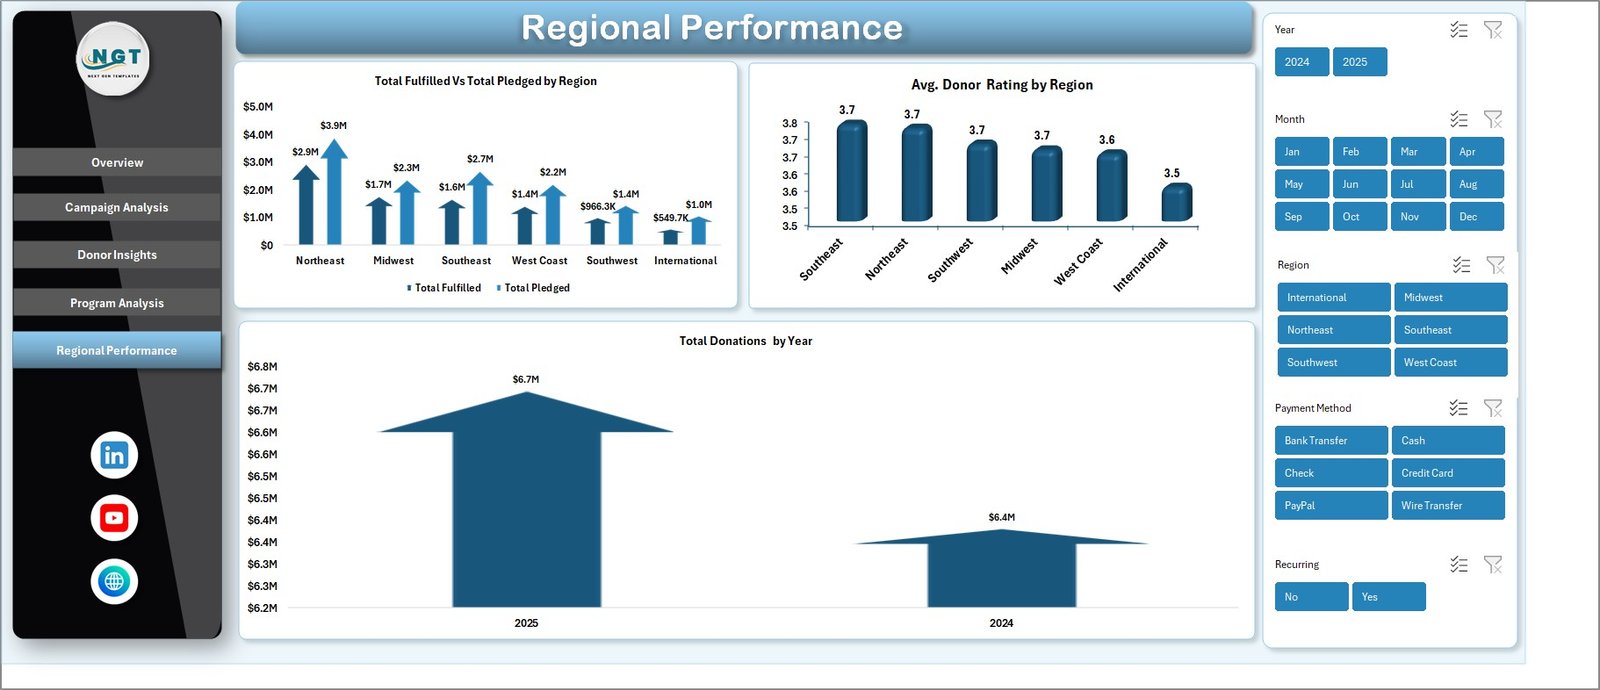 Regional Performance
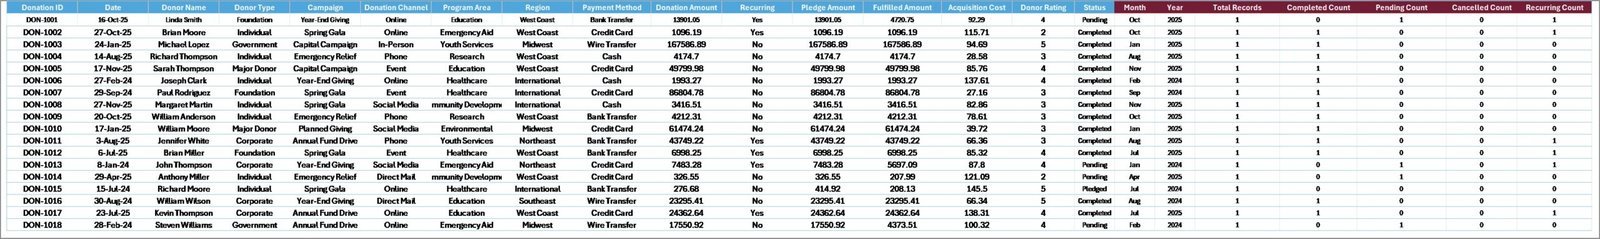
📋 Data Sheet: A structured data entry sheet where you input your fundraising records. Simply add your data in the same format and refresh the dashboard — all charts and KPIs update automatically.
 Data Sheet Tab
⚙️ Support Sheet: Contains multiple pivot tables that power the entire dashboard dynamically. After updating your data, go to the Data tab in the Excel Ribbon and click Refresh All — every pivot and chart refreshes automatically. You can keep this sheet hidden for a clean user experience.
 Support Sheet Tab
⚙️ How to Use the Nonprofit Fundraising Dashboard in Excel
1️⃣ Download the file and open it in Microsoft Excel (2016 or later recommended).
2️⃣ Navigate to the Data Sheet and replace the sample data with your actual fundraising records — donations, campaigns, donors, regions, and program areas.
3️⃣ Go to the Data tab in the Excel Ribbon and click “Refresh All” to update every pivot table and chart across all 5 dashboard pages.
4️⃣ Use the slicers on the Overview page to filter by campaign, region, donor type, or time period for targeted analysis.
5️⃣ Share insights with your board, donors, or team by printing or exporting individual dashboard pages.
👥 Who Can Benefit from This Nonprofit Fundraising Dashboard in Excel
🔹 Nonprofit Executive Directors — Monitor overall fundraising health and present data-backed reports to the board of directors.
🔹 Fundraising Managers — Track campaign performance, optimize donation channels, and identify top-performing regions.
🔹 Development Officers — Analyze donor behavior, acquisition costs, and recurring donation patterns.
🔹 Program Coordinators — Evaluate which programs attract the most funding and where fulfillment gaps exist.
🔹 NGO Data Analysts — Build comprehensive fundraising reports without needing complex BI tools.
🔹 Grant Writers — Use data visualizations to support grant applications with real performance evidence.
❓ Frequently Asked Questions
What KPIs does the Nonprofit Fundraising Dashboard in Excel track?
The Nonprofit Fundraising Dashboard in Excel tracks 5 key performance indicators on the Overview page: Total Donations, Total Fulfilled, Total Pledged, Total Records, and Fulfillment Percentage. Additional metrics across the 5 analysis pages include Average Donation Per Record, Total Acquisition Cost by Donor Type, Recurring Donor counts, and Average Donor Rating by Region.
Do I need advanced Excel skills to use this dashboard?
No. Simply replace the sample data in the Data Sheet with your own records and click Refresh All in the Data tab. All charts, KPI cards, and pivot tables update automatically. No formulas or VBA knowledge required.
Can I customize the campaigns and regions in this template?
Yes. The dashboard is fully dynamic and driven by pivot tables. When you enter your own campaign names, regions, donor types, and program areas in the Data Sheet, the charts and analysis pages automatically reflect your unique data after refreshing.
How many dashboard pages does this template include?
The template includes 7 worksheets: 5 interactive dashboard pages (Overview, Campaign Analysis, Donor Insights, Program Analysis, Regional Performance), 1 Data Sheet for data entry, and 1 Support Sheet with pivot tables that power the entire dashboard.
What is the best Excel template for tracking nonprofit fundraising?
The Nonprofit Fundraising Dashboard in Excel from NextGenTemplates is one of the best options available. It offers 5 analysis pages covering campaigns, donors, programs, and regions — with automated pivot tables and interactive slicers for instant filtering. It is ready to use with no setup or coding required.
Can I use this dashboard to present to my board of directors?
Absolutely. Each dashboard page is professionally designed with clean visuals that are ideal for board presentations. You can print individual pages or export them as PDFs to share with stakeholders and donors.
🔗 Explore Related Templates
If you found this template useful, check out these related nonprofit and fundraising templates on NextGenTemplates:
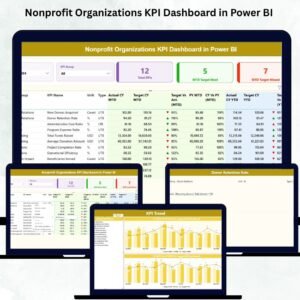
🔹 Nonprofit Organizations KPI Dashboard in Power BI — Advanced KPI tracking with Power BI interactive visuals for nonprofit organizations.
🔹 Charity Fundraising KPI Scorecard in Excel — A structured KPI scorecard with MTD/YTD comparisons for charity fundraising campaigns.
🔹 Donation Management Tracker in Google Sheets — A cloud-based tracker for managing donations, pledges, and donor communications in Google Sheets.
🔹 Corporate Donation Request Tracker in Google Sheets — Track and manage corporate donation requests and fulfillment status.
📖 Click here to read the Detailed Blog Post about Nonprofit Fundraising Dashboard in Excel
Watch the step-by-step video tutorial:


Reviews
There are no reviews yet.