Managing museums and cultural centers today is far more complex than preserving collections and hosting exhibitions. Leaders must continuously balance visitor satisfaction, operational efficiency, staffing costs, event performance, and revenue generation—all while working within tight budgets and public expectations.
That is exactly why the Museums & Cultural Centers Dashboard in Power BI becomes a must-have decision-support tool.
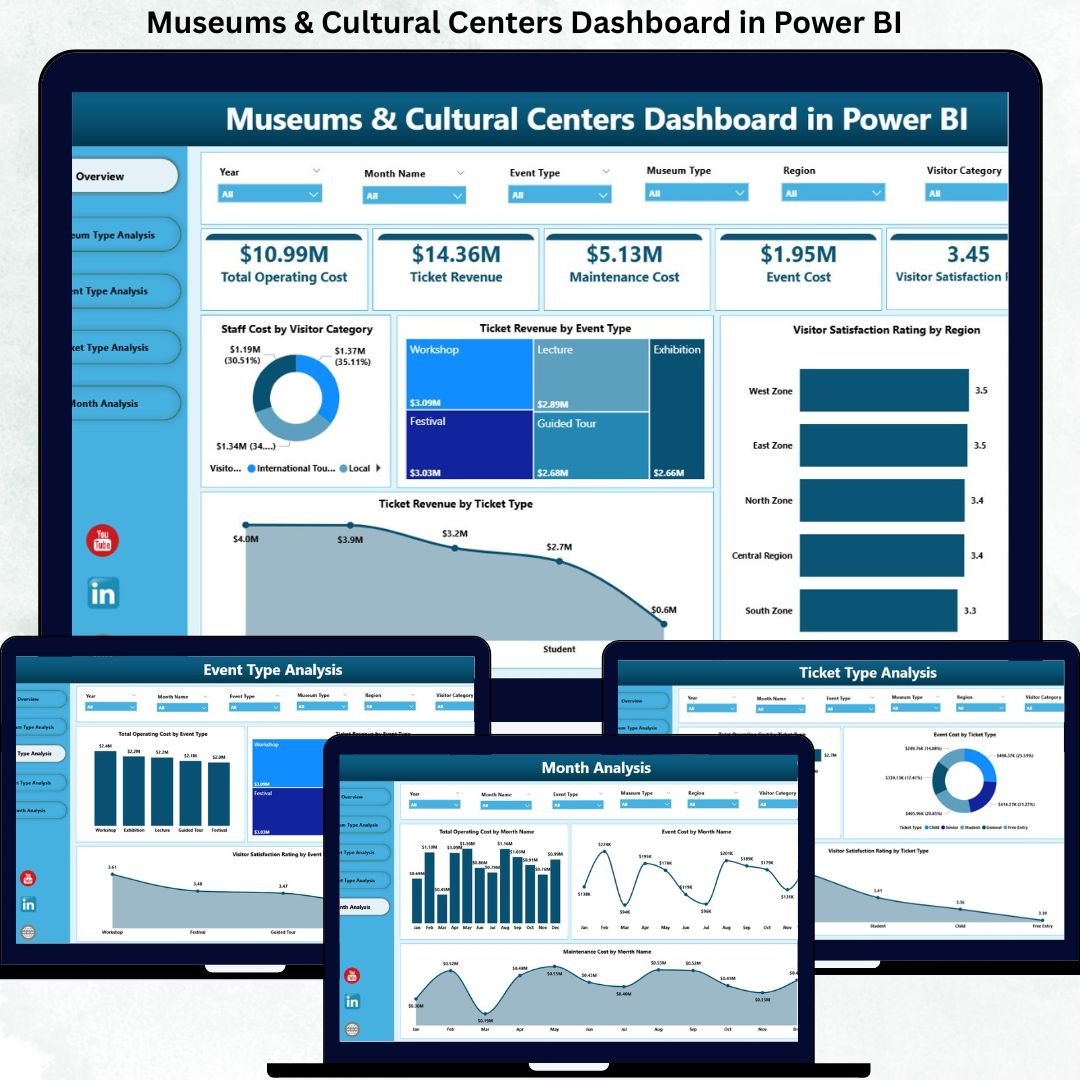
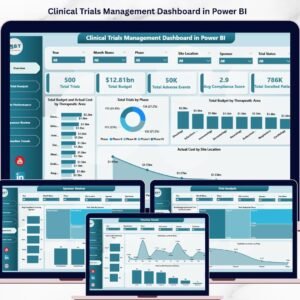
This ready-to-use, interactive Power BI dashboard transforms scattered operational, financial, and visitor data into clear KPIs, dynamic visuals, and actionable insights. Instead of relying on delayed reports or disconnected spreadsheets, museum directors and managers gain a real-time, centralized view of performance.
Built with simplicity and scalability in mind, this dashboard connects seamlessly with Excel data sources and presents insights through well-structured analytical pages. As a result, cultural institutions can make faster decisions, improve cost control, optimize events, and enhance visitor experiences—without technical complexity.
🔑 Key Features of Museums & Cultural Centers Dashboard in Power BI
📊 Centralized Performance Overview
Track operational costs, ticket revenue, staffing expenses, and visitor satisfaction from one unified dashboard.
🎯 Multi-Dimensional Analysis
Analyze performance by museum type, event type, ticket category, region, and time period using interactive slicers.
📈 Five Insight-Driven Pages
Each page is designed to answer specific operational and strategic questions clearly.
💰 Cost & Revenue Visibility
Understand where money is spent and which activities generate the highest value.
😊 Visitor Satisfaction Tracking
Monitor satisfaction ratings across regions, ticket types, and events to improve experience quality.
⚡ Fast, Interactive Insights
Replace static reports with real-time visuals and trend analysis.
🔄 Easy Data Updates
Use Excel as the backend for quick, non-technical data refreshes.
📈 Scalable & Flexible Design
Adapt the dashboard easily for small museums or large cultural networks.
📂 What’s Inside the Museums & Cultural Centers Dashboard in Power BI
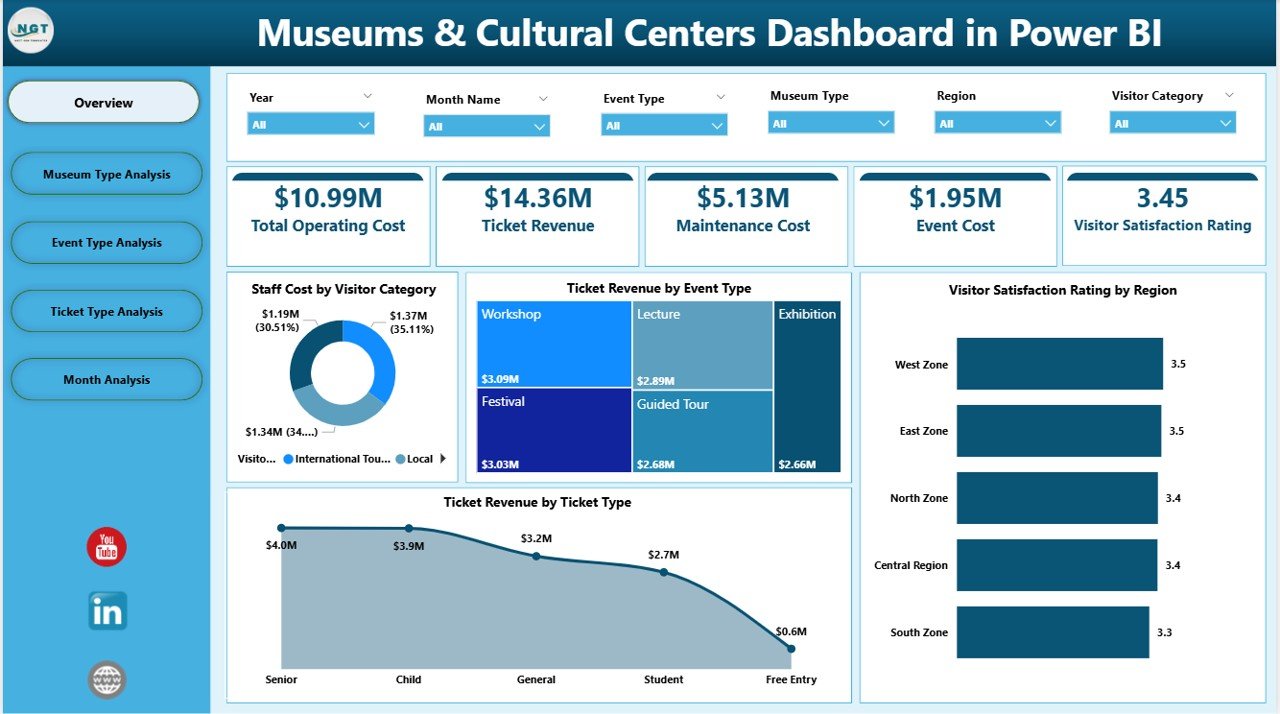
📁 Overview Page – High-level snapshot with KPI cards and analytical charts
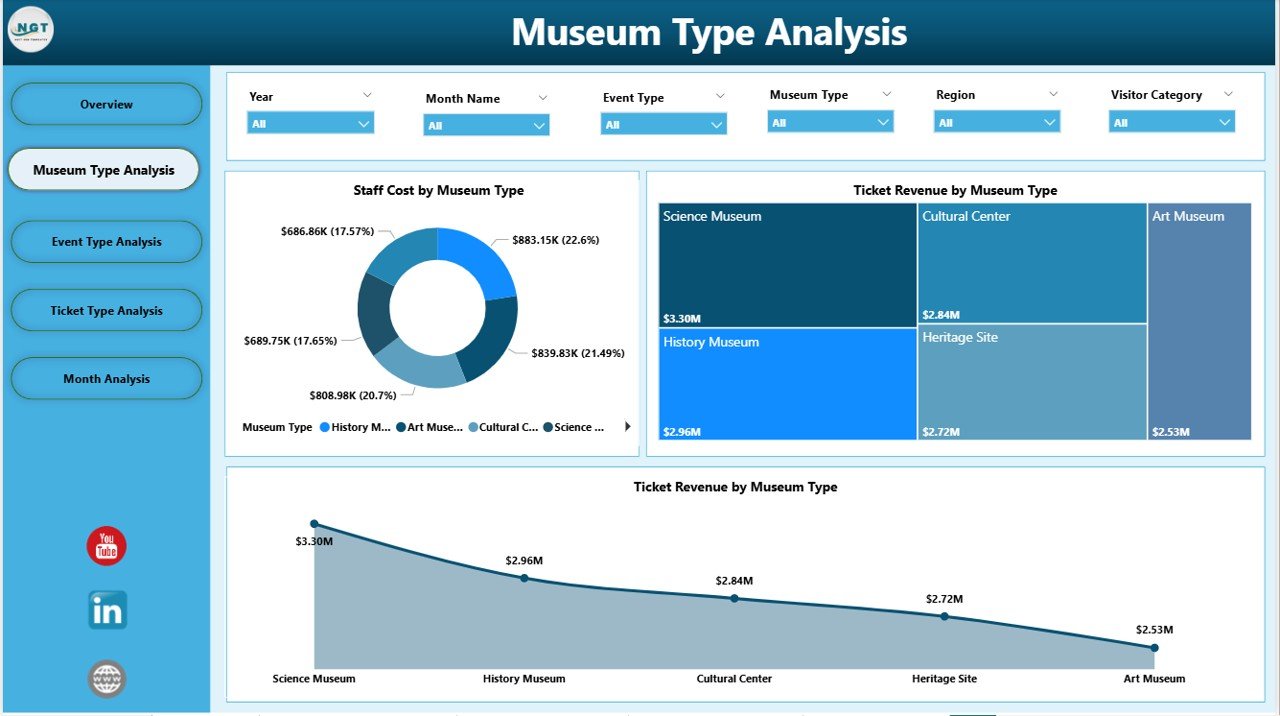
📁 Museum Type Analysis Page – Compare performance across different museum categories
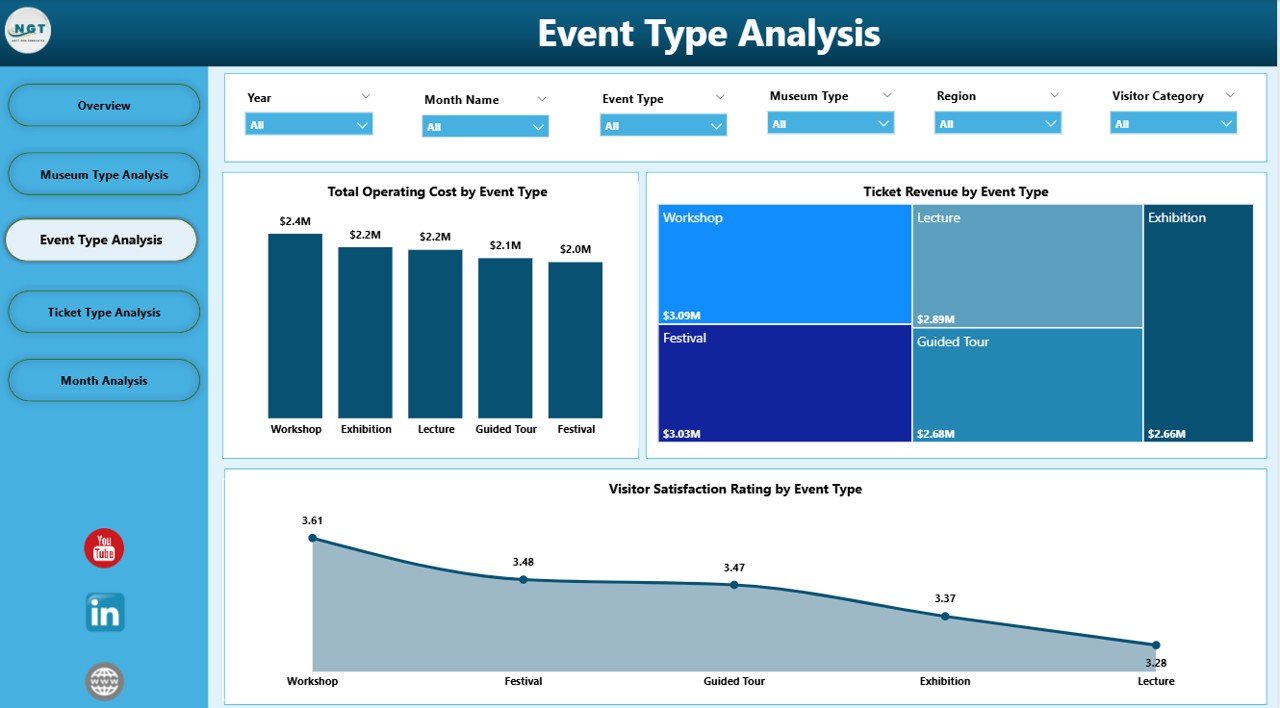
📁 Event Type Analysis Page – Evaluate cost, revenue, and satisfaction by event type
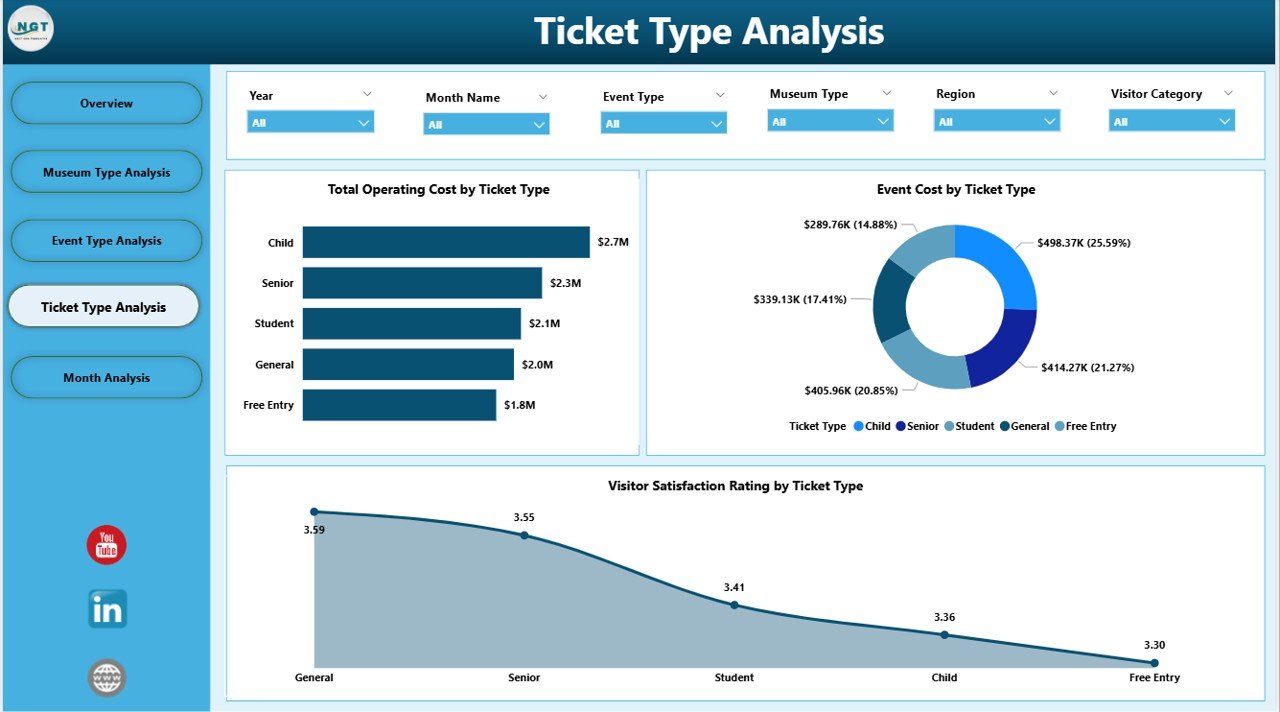
📁 Ticket Type Analysis Page – Analyze pricing and ticket performance impact
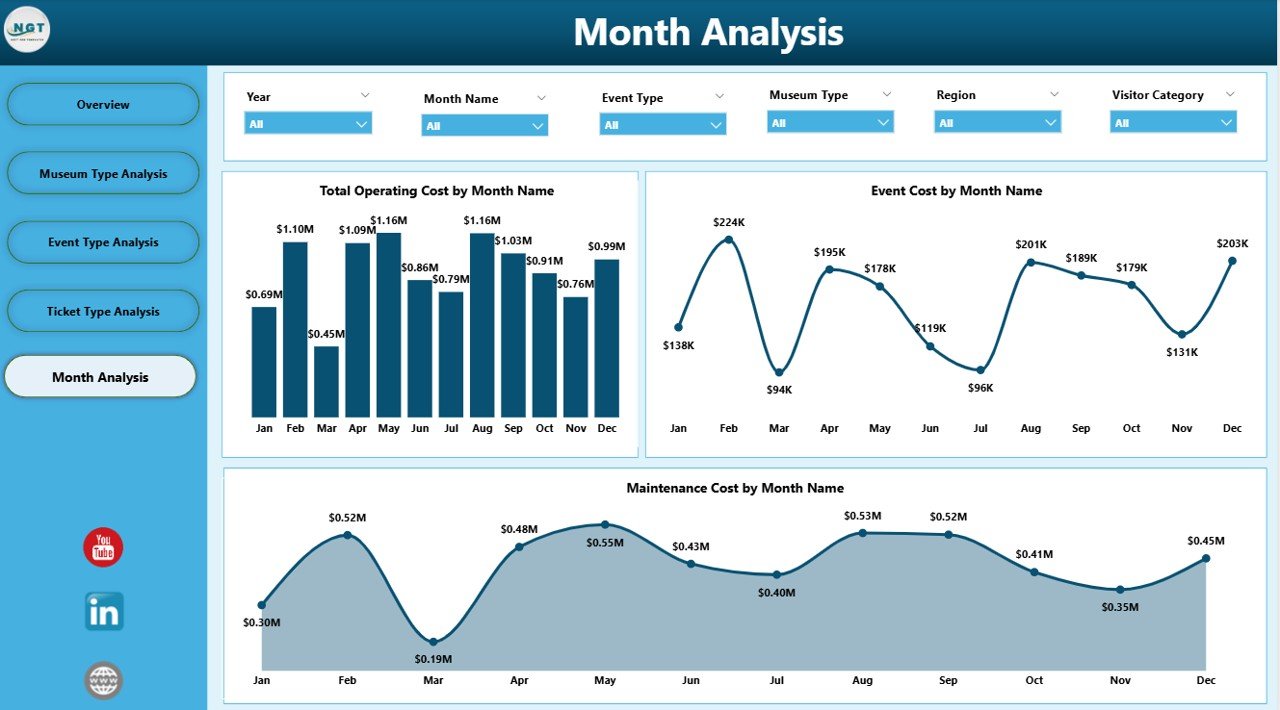
📁 Monthly Trends Page – Track cost and activity trends over time
Each page works together to provide both operational clarity and strategic direction.
🛠️ How to Use the Museums & Cultural Centers Dashboard in Power BI
1️⃣ Prepare and structure your data in Excel
2️⃣ Load or refresh the data inside Power BI
3️⃣ Use slicers to filter by museum type, event type, ticket type, or month
4️⃣ Review KPI cards for quick performance checks
5️⃣ Analyze charts to identify cost drivers and revenue opportunities
6️⃣ Use trend pages to plan staffing, maintenance, and budgets
No advanced Power BI skills are required. The dashboard is designed for intuitive navigation and immediate adoption.
👥 Who Can Benefit from This Museums & Cultural Centers Dashboard in Power BI
🏛️ Museum directors and trustees
📊 Operations and facility managers
💰 Finance and budgeting teams
🎟️ Event and exhibition coordinators
📣 Marketing and visitor engagement teams
🏢 Government and cultural authorities
If your organization manages visitor flow, events, costs, and public experience, this dashboard delivers immediate value.
📘 Click here to read the Detailed blog post
🎥 Visit our YouTube channel to learn step-by-step video tutorials
👉 YouTube Channel


Reviews
There are no reviews yet.