Managing a mortgage lending business is complex. You must balance loan origination targets, processing efficiency, compliance requirements, portfolio performance, and profitability—all at the same time. Mortgage Lenders KPI Dashboard in Power BI When performance data sits in multiple spreadsheets or static reports, leaders struggle to see the real picture. Decisions get delayed, risks increase, and opportunities are missed.
The Mortgage Lenders KPI Dashboard in Power BI is built to eliminate these challenges.
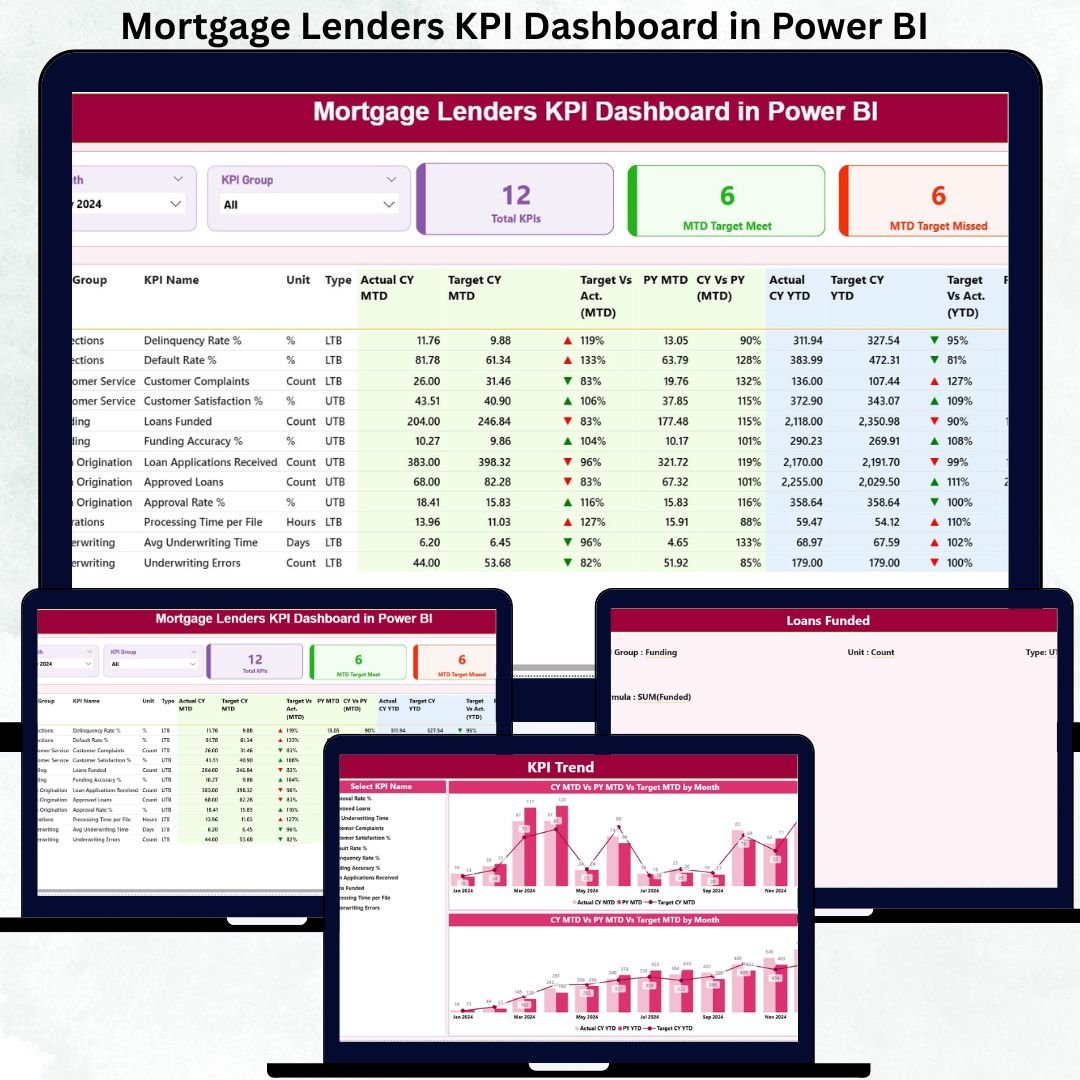
This ready-to-use Power BI dashboard converts structured Excel data into clear, interactive, and executive-ready visuals. It helps mortgage lenders track MTD and YTD performance, compare targets vs actuals, analyze year-over-year trends, and quickly identify underperforming KPIs. With visual indicators, trend charts, and drill-through definitions, this dashboard turns raw numbers into confident, data-driven decisions. 🚀
Whether you manage a small lending firm or a large mortgage institution, this dashboard becomes your single source of truth for performance monitoring.
Key Features of the Mortgage Lenders KPI Dashboard in Power BI 🔑
This dashboard is designed for clarity, speed, and control:
📊 Centralized KPI Monitoring – Track all mortgage KPIs in one place
🎯 MTD & YTD Performance Tracking – Short-term and long-term visibility
📉 Target vs Actual Comparison – Instantly spot performance gaps
📈 Previous Year Comparison – Measure real growth and improvement
🚦 Visual Performance Indicators – Green/red arrows for quick insights
🔍 Interactive Slicers – Filter by Month and KPI Group
📌 Drill-Through KPI Definitions – No confusion, complete transparency
⚡ Excel-Driven Data Source – Simple updates, powerful visuals
This dashboard is not just a report—it is a performance management system.
What’s Inside the Mortgage Lenders KPI Dashboard in Power BI 📂
The Power BI file includes three powerful analytical pages, each serving a specific purpose.
📌 1. Summary Page – Executive Performance Overview
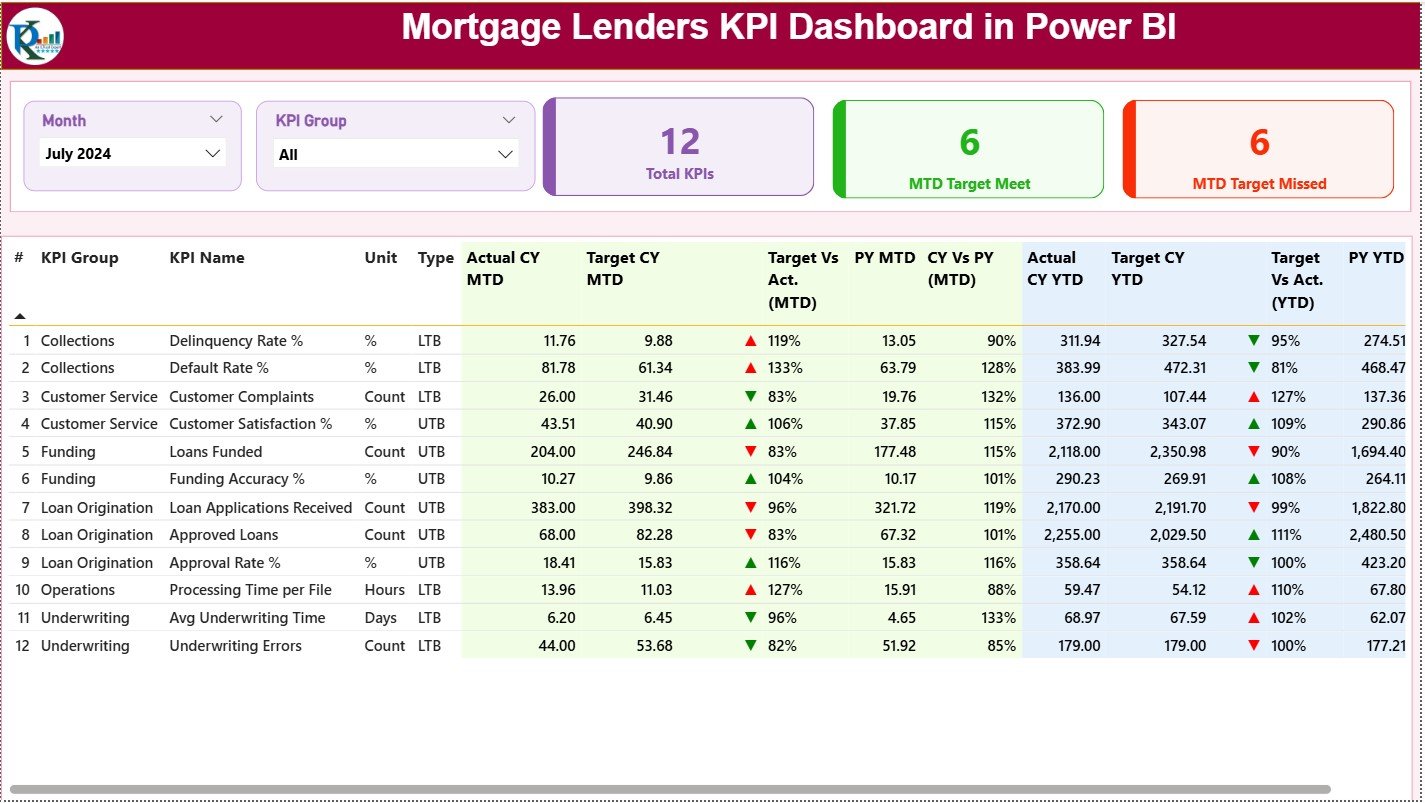
This is the main control panel of the dashboard.
It includes:
🔹 Month slicer and KPI Group slicer
🔹 KPI Cards showing:
-
Total KPIs Count
-
MTD Target Met Count
-
MTD Target Missed Count
🔹 A detailed KPI performance table with:
-
KPI Number, Group, Name, Unit, Type (UTB / LTB)
-
Actual CY MTD & Target CY MTD
-
Target vs Actual % (MTD)
-
Previous Year MTD & CY vs PY comparison
-
Actual CY YTD & Target CY YTD
-
Target vs Actual % (YTD)
-
Previous Year YTD & CY vs PY comparison
-
Visual up/down performance icons
This page helps leadership instantly understand where performance stands.
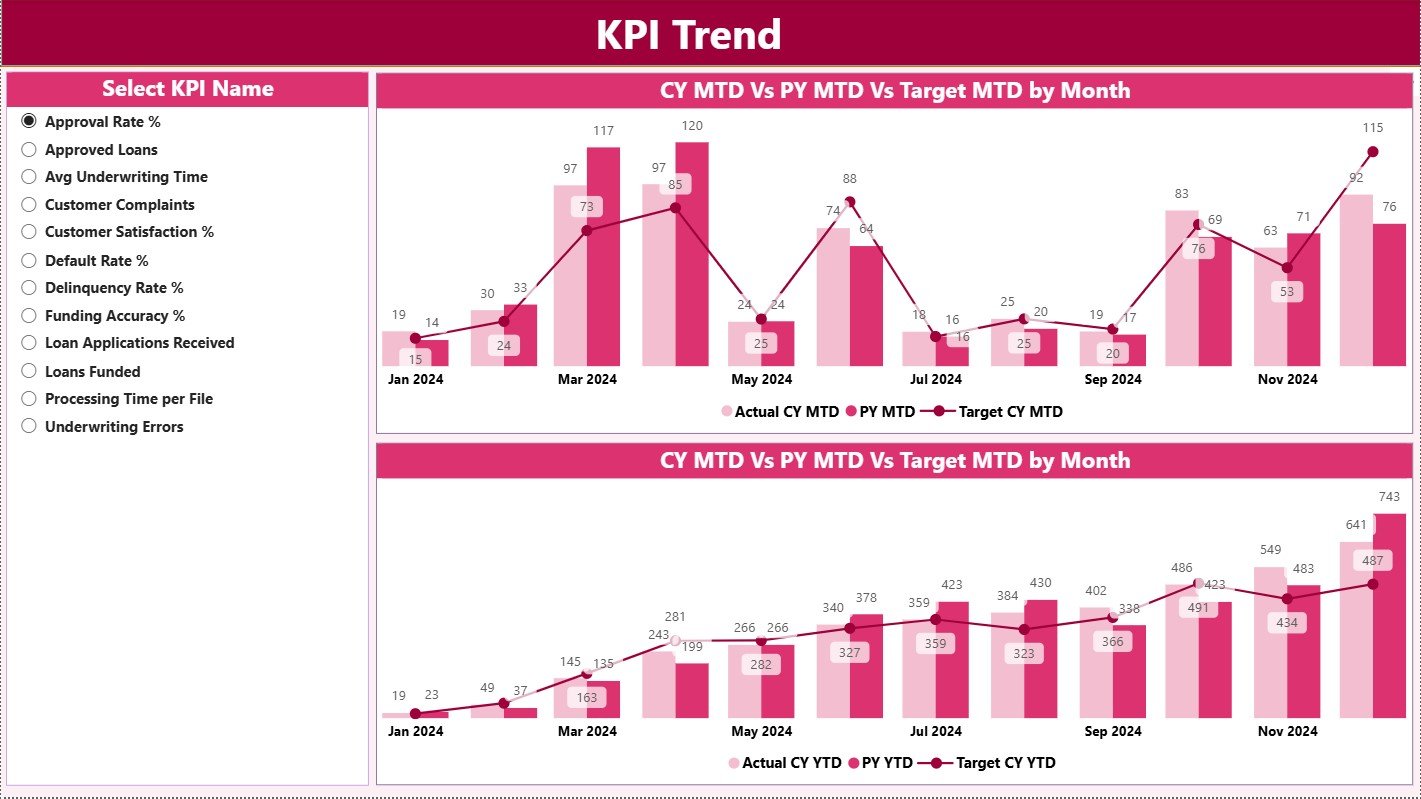
📌 2. KPI Trend Page – Performance Movement Over Time
This page focuses on trends rather than static numbers.
It includes:
📈 MTD Trend Combo Chart – Actual CY vs PY vs Target
📉 YTD Trend Combo Chart – Actual CY vs PY vs Target
🎯 KPI Name slicer for focused analysis
Trend analysis helps mortgage lenders:
✔ Detect early performance issues
✔ Understand seasonal patterns
✔ Improve forecasting and planning
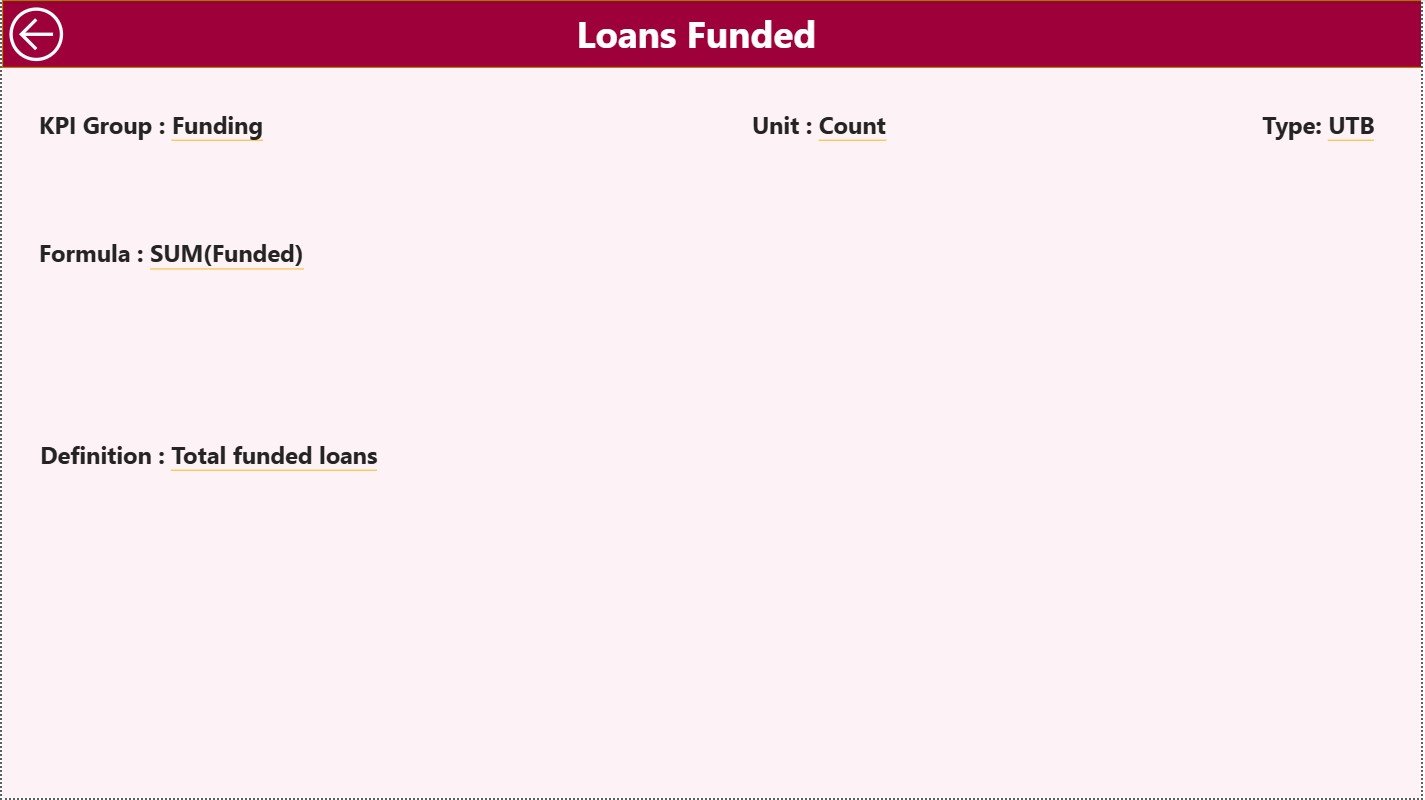
📌 3. KPI Definition Page – Complete KPI Transparency
This hidden drill-through page explains every KPI clearly.
It displays:
📘 KPI Formula
📘 KPI Definition
📘 KPI Unit
📘 KPI Type (LTB / UTB)
This page ensures consistent interpretation across teams and builds trust in reporting.
How to Use the Mortgage Lenders KPI Dashboard in Power BI 🛠️
Using the dashboard is simple:
1️⃣ Enter actual values in the Input Actual Excel sheet
2️⃣ Enter target values in the Input Target Excel sheet
3️⃣ Maintain KPI logic in the KPI Definition sheet
4️⃣ Refresh Power BI
5️⃣ Use slicers to analyze MTD, YTD, and trends
6️⃣ Drill through KPIs for detailed understanding
No advanced Power BI skills required. 💡
Who Can Benefit from This Mortgage Lenders Dashboard? 👥
This dashboard is ideal for:
🏦 Mortgage Company Owners & Directors
📊 Operations & Underwriting Managers
💼 Sales & Origination Heads
⚖️ Compliance & Risk Teams
💰 Finance & Strategy Teams
📈 Business & Performance Analysts
Anyone responsible for mortgage performance will benefit.


Reviews
There are no reviews yet.