Mortgage lending is a numbers-driven business where performance, speed, accuracy, and risk control determine success. Every month, lenders track applications, approvals, disbursements, turnaround time, delinquency rates, and compliance metrics. However, when this information is spread across multiple spreadsheets, analyzing performance becomes slow and unclear.
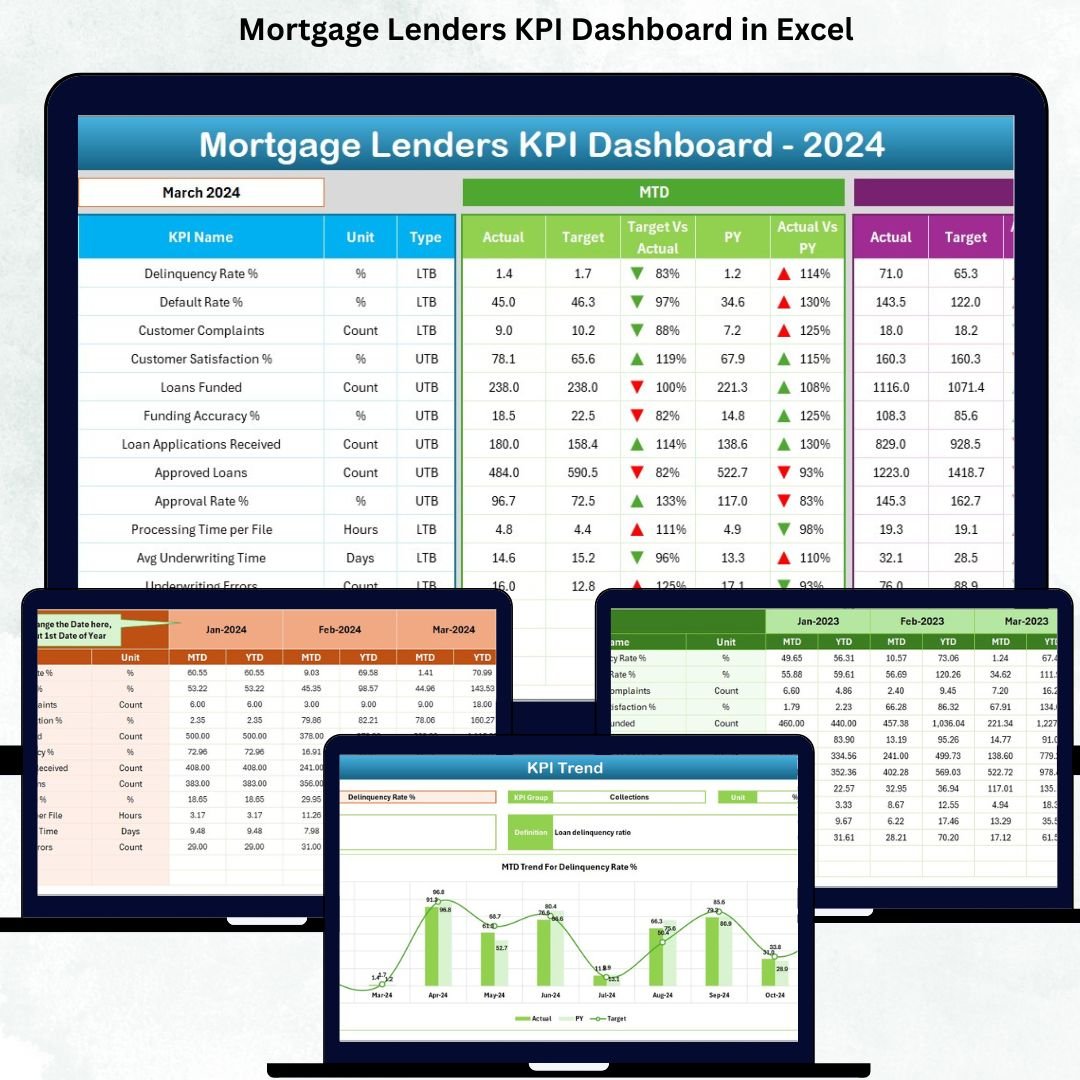
The Mortgage Lenders KPI Dashboard in Excel solves this challenge by bringing all critical mortgage KPIs into one structured, automated, and easy-to-use dashboard. Mortgage Lenders KPI Dashboard in Excel It transforms raw lending data into actionable insights using Excel formulas, charts, trend analysis, and visual indicators. Because the dashboard is built entirely in Excel, lending teams can adopt it instantly without learning new software.
With this dashboard, mortgage lenders move away from manual reporting and gain real-time visibility into performance, targets, and trends—helping leadership make faster and smarter decisions.
🚀 Key Features of the Mortgage Lenders KPI Dashboard in Excel
📊 Centralized KPI Monitoring – Track all mortgage lending KPIs in one place
📅 Month Selector with Auto Update – Analyze performance month by month instantly
✅ MTD & YTD Performance Tracking – Monitor short-term and long-term results
📈 Target vs Actual Comparison – Identify performance gaps with clarity
🔁 Previous Year Comparison – Measure year-over-year growth or decline
📉 Trend Analysis Charts – Visualize KPI trends for deeper insights
🎯 Conditional Formatting Icons – Instantly spot KPI improvement or decline
🧭 Easy Navigation Buttons – Jump between sheets without confusion
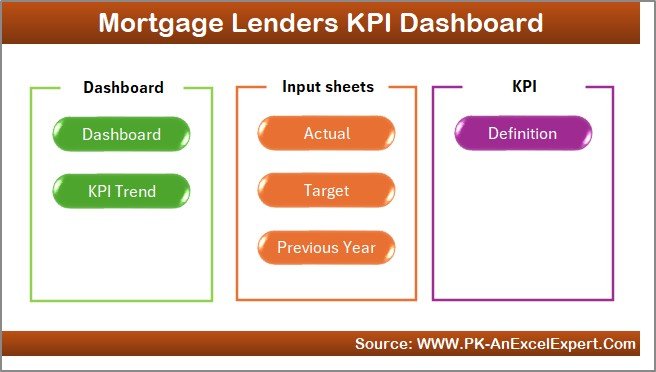
📦 What’s Inside the Mortgage Lenders KPI Dashboard
This Excel dashboard includes seven well-structured worksheets, designed to create a complete mortgage performance tracking system:
🏠 Home Sheet
Acts as the main index page. Navigation buttons allow users to move directly to any sheet without scrolling through tabs.
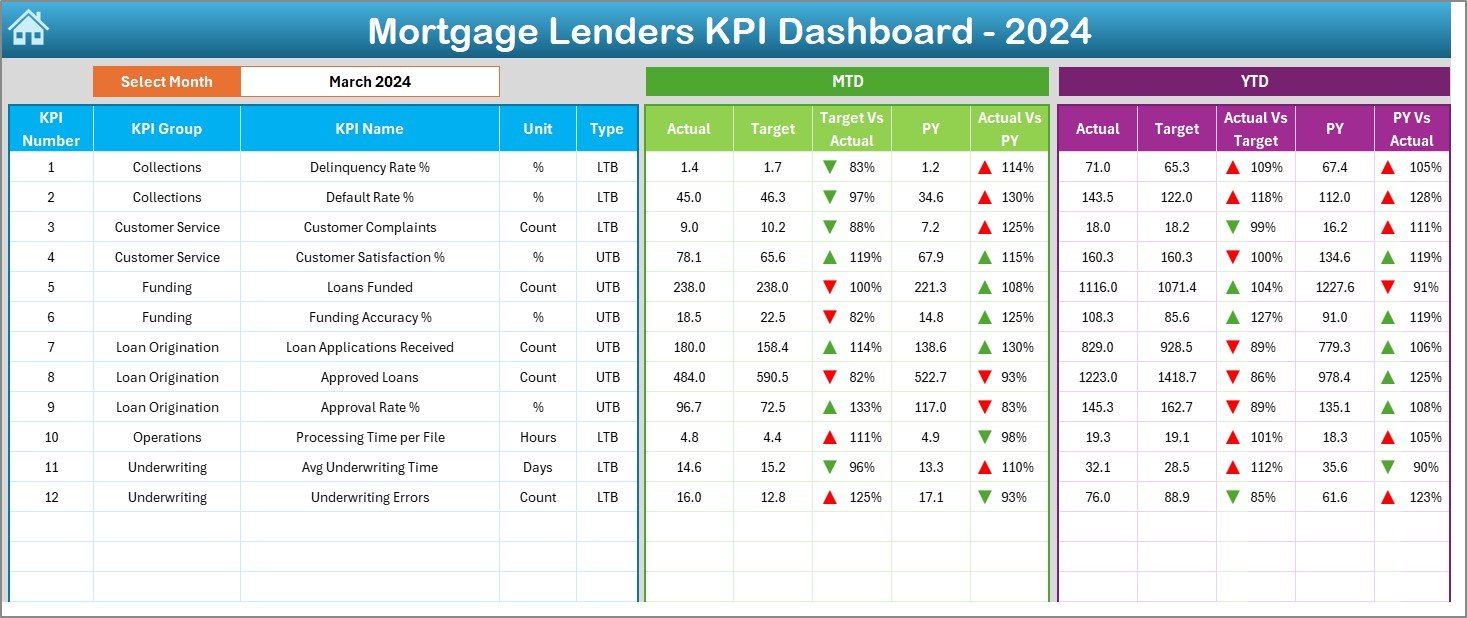
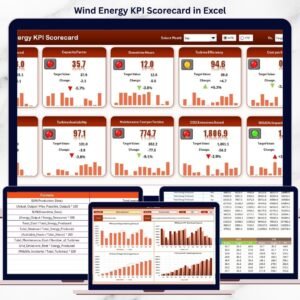
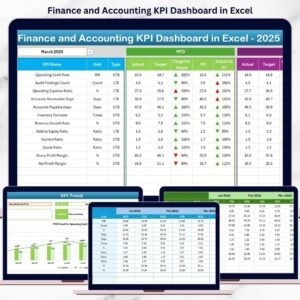
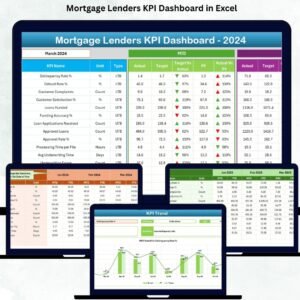
📊 Dashboard Sheet
The main reporting page. Users select a month from a drop-down, and the dashboard instantly updates to show MTD and YTD KPI performance, target comparisons, previous year benchmarks, and visual indicators.
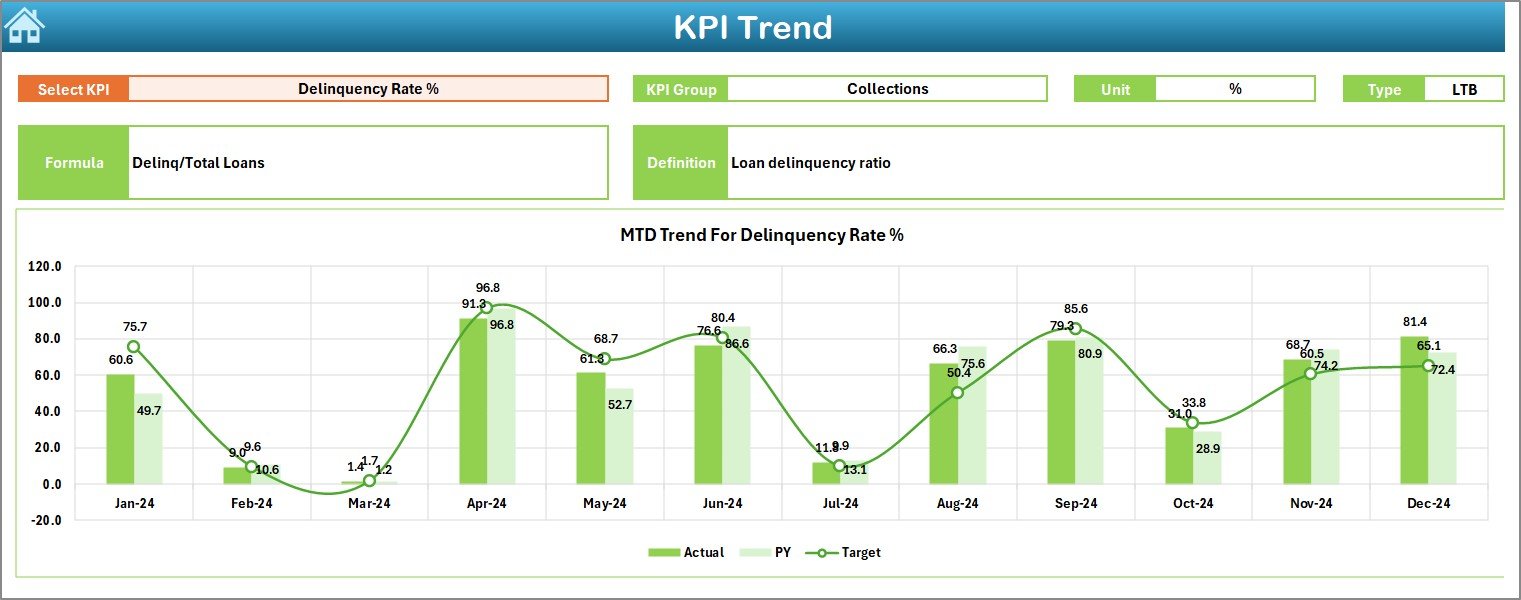
📉 KPI Trend Sheet
Focuses on individual KPI trends. Users select a KPI name, and the sheet displays KPI details along with MTD and YTD trend charts comparing Actual, Target, and Previous Year performance.
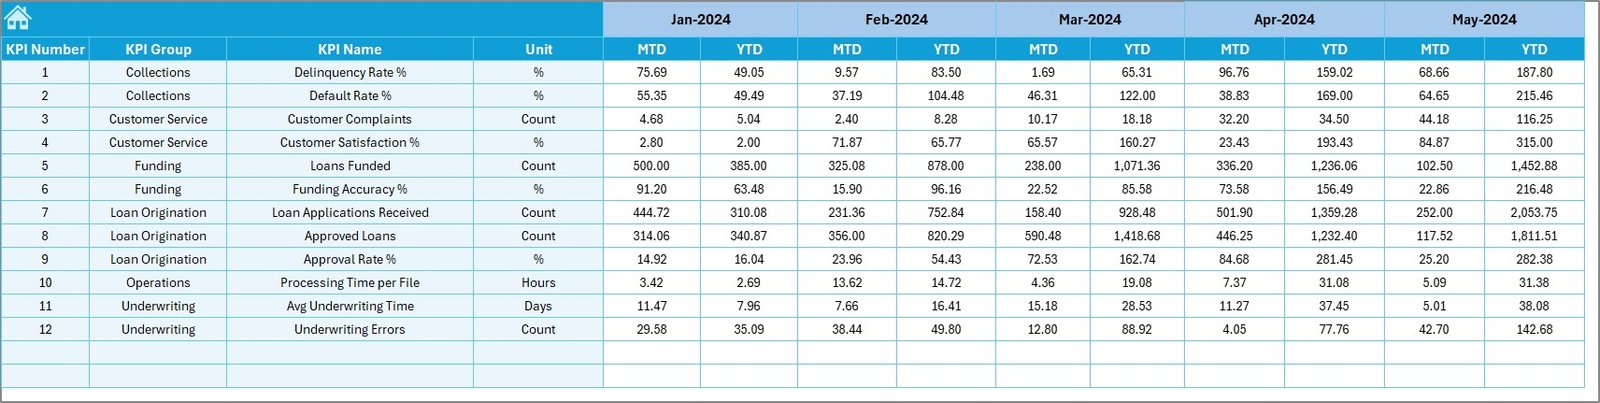
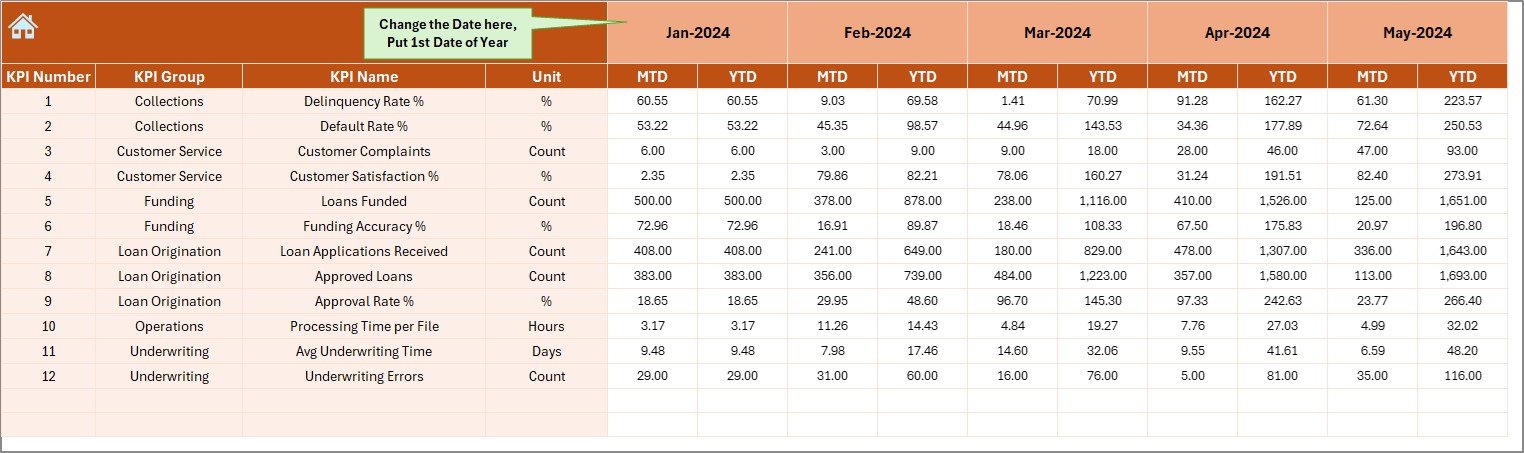
✍ Actual Numbers Input Sheet
Users enter monthly MTD and YTD actual values. All dashboard visuals update automatically from this sheet.
🎯 Target Sheet
Stores KPI-wise MTD and YTD targets. Separating targets from actuals improves clarity and control.
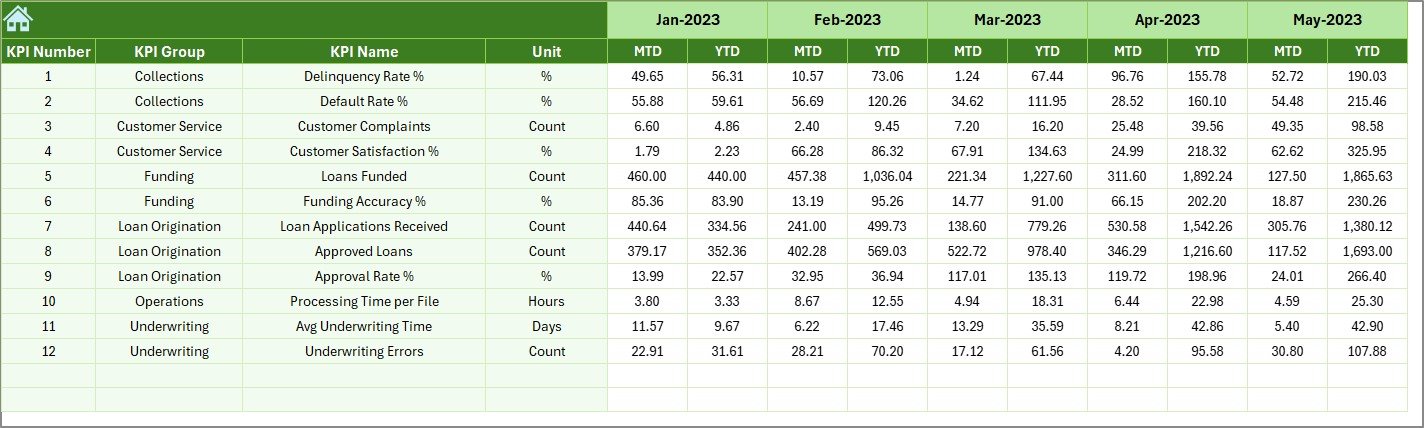
📅 Previous Year Numbers Sheet
Holds historical data for year-over-year comparison, enabling growth analysis and benchmarking.
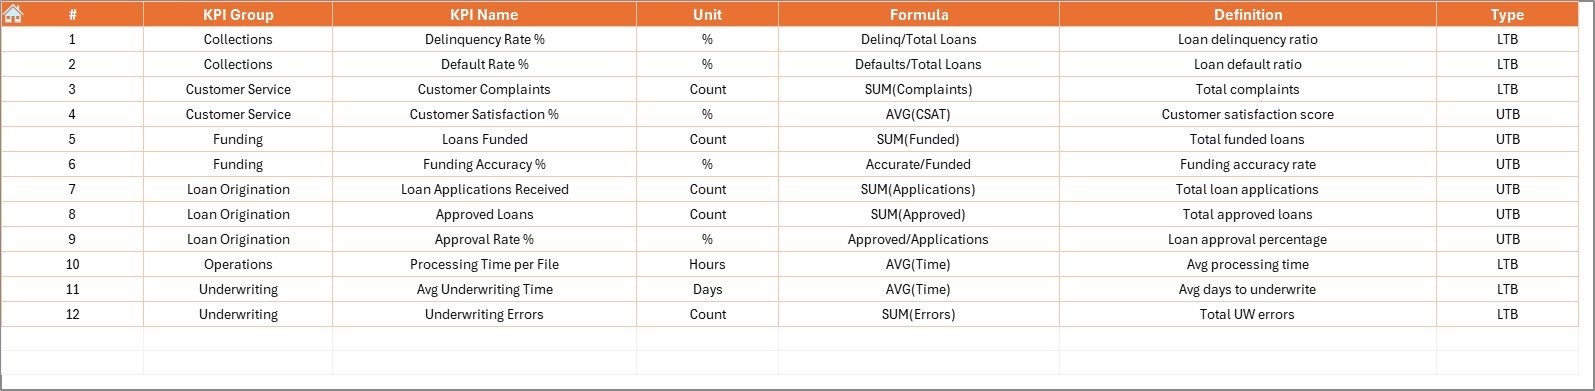
📘 KPI Definition Sheet
Defines KPI group, unit, formula, and definition. This sheet ensures consistency and correct interpretation across the dashboard.
🛠️ How to Use the Mortgage Lenders KPI Dashboard
✅ Step 1: Enter actual mortgage performance data in the Actual Numbers Input sheet
✅ Step 2: Update targets in the Target Sheet
✅ Step 3: Maintain historical data in the Previous Year Numbers sheet
✅ Step 4: Select the reporting month from the Dashboard
✅ Step 5: Review KPIs, trends, and performance indicators
No advanced Excel skills are required. This dashboard works on automation, formulas, and simple inputs.
👥 Who Can Benefit from This Mortgage Dashboard?
🏦 Mortgage Lenders
📄 Loan Processing Teams
📉 Credit Risk Managers
📊 Operations Leaders
💼 Finance & Compliance Teams
📈 Business & Performance Analysts
Any organization aiming to improve mortgage efficiency, risk control, and decision accuracy will benefit from this dashboard.
🔗 Click here to read the Detailed blog post
🎥 Visit our YouTube channel to learn step-by-step video tutorials


Reviews
There are no reviews yet.