


In the era of digital finance, mobile banking has become the cornerstone of customer convenience and financial innovation. With millions of transactions processed daily, banks and financial institutions need precise, real-time insights to maintain efficiency, track KPIs, and ensure customer satisfaction.
That’s where the Mobile Banking Dashboard in Excel from NextGenTemplates.com comes in — a powerful, ready-to-use template that helps banks, analysts, and financial professionals monitor key mobile banking metrics in one centralized, easy-to-use Excel file.
Built with dynamic dropdowns, slicers, and automated charts, this dashboard transforms raw financial and operational data into interactive visual insights. It allows you to analyze Month-to-Date (MTD) and Year-to-Date (YTD) performance without complex tools or coding — empowering smarter, faster, and data-driven decision-making.
⚙️ Key Features of the Mobile Banking Dashboard in Excel
📊 5 Analytical Pages: Overview | Bank Name Analysis | Transaction Type | Channel Analysis | Monthly Trends
📂 Support & Data Sheets: Store background formulas and raw data.
📅 MTD & YTD Tracking: Monitor current month and cumulative yearly performance.
🎯 KPI Cards: Total Transactions, Processed Amount, Satisfaction %, Success Rate, and Service Fee %.
📈 Dynamic Charts: Automated visuals for region, channel, and bank-level insights.
💻 Slicers & Filters: Filter data by month, region, or KPI group instantly.
🔄 Auto-Refresh Data: Update once in the Data Sheet — the entire dashboard updates automatically.
🧩 No Coding Required: 100 % Excel-based, fully customizable, and business-ready.
📊 Dashboard Structure and Pages
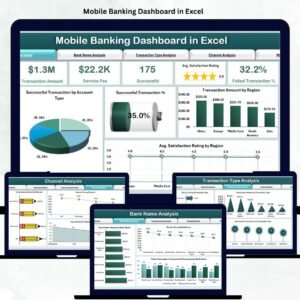
🏦 1️⃣ Overview Page – The Central Performance Hub

The Overview Page gives leadership teams an instant snapshot of performance and customer experience.
Features:
-
Page Navigator: Quick navigation across dashboard pages.
-
Right-Side Slicers: Filter by month, KPI group, or region.
-
Five KPI Cards: Show total transactions, amount processed, satisfaction score, success rate, and service fee %.
-
Charts Included:
-
Success Transactions by Account Type
-
Total Transactions
-
Transaction Amount by Region
-
Average Satisfaction Rating by Region
-
💡 Purpose: Provide a high-level overview of mobile banking operations in a single glance.
🏛️ 2️⃣ Bank Name Analysis – Compare Bank-Wise Performance
Evaluate how each bank or financial entity performs within your mobile ecosystem.
Charts Included:
-
Transaction Amount by Bank Name
-
Service Fee by Bank Name
-
Failed vs Successful Transactions by Bank
💡 Purpose: Identify top-performing banks, detect inefficiencies, and assess fee contribution by institution.
💸 3️⃣ Transaction Type Analysis – Understand User Behavior
Explore which transaction categories drive the most engagement or revenue.
Charts Included:
-
Service Fee by Transaction Type
-
Transaction Amount by Transaction Type
-
Successful Transactions by Transaction Type
💡 Purpose: Track usage trends across transfers, bill payments, recharges, deposits, and more.
📱 4️⃣ Channel Analysis – Evaluate Digital Efficiency
Compare the performance of different digital channels like mobile apps, web portals, SMS, and USSD.
Charts Included:
-
Transaction Amount by Channel
-
Service Fee by Channel
-
Average Satisfaction Rating by Channel
💡 Purpose: Identify the most profitable and user-friendly digital channels.
📅 5️⃣ Monthly Trends – Analyze Performance Over Time
Monitor growth, fluctuations, and seasonality with visual time-series trends.
Charts Included:
-
Transaction Amount by Month
-
Pending Transaction % by Month
-
Average Satisfaction Rating by Month
💡 Purpose: Track long-term performance and forecast future activity accurately.
⚙️ Supporting Sheets
Support Sheet: Handles lookup formulas, calculations, and slicer logic.
Data Sheet: Stores all transactional and KPI data — once updated, all visuals refresh automatically.
🌟 Advantages of the Mobile Banking Dashboard
✅ 360° Visibility: Unified view of financial, operational, and satisfaction metrics.
📈 Real-Time Insights: Track transaction success rates and satisfaction trends live.
💰 Revenue Intelligence: Monitor service fees and regional income contributions.
📊 Historical Comparison: Analyze MTD, YTD, and PY (Previous Year) trends side by side.
⚙️ Automation: Eliminates manual reporting and speeds up monthly reviews.
🔍 Transparency: Clear visibility across teams — from operations to management.
💡 Scalability: Add more KPIs, regions, or banks effortlessly.
💡 Key KPIs to Track
Transaction KPIs
-
Total Transactions (Count)
-
Success Rate (%)
-
Failed Transactions (%)
-
Pending Transactions (%)
Financial KPIs
-
Transaction Amount (USD)
-
Service Fee (USD)
-
Average Transaction Value (USD)
Customer KPIs
-
Average Satisfaction Rating
-
Complaint Rate (%)
-
Response Time (Minutes)
Channel KPIs
-
Transactions by Channel
-
Revenue by Channel
💡 All KPIs are fully automated for accurate, up-to-date analysis.
🧠 Best Practices for Using This Dashboard
📅 Update Data Monthly for accurate trend tracking.
✅ Validate Input Figures before analysis.
📊 Highlight Critical KPIs using conditional formatting.
🔐 Secure Data Access to protect financial information.
📈 Use Monthly Trends to anticipate seasonal patterns.
👥 Review Channel Performance regularly to optimize efficiency.
👩💼 Who Can Use This Dashboard
🏦 Bank Operations Managers
💳 Digital Banking Analysts
📈 Financial Planning Teams
📊 Customer Experience Officers
💼 Senior Management in FinTech
🧩 Conclusion
The Mobile Banking Dashboard in Excel is a complete digital banking performance solution, empowering financial institutions to make informed, data-driven decisions.
It tracks operational efficiency, financial KPIs, and customer experience seamlessly — without requiring BI software or technical skills.
💳 Monitor smarter. Analyze deeper. Serve better — with NextGen Templates’ Mobile Banking Dashboard in Excel.


Reviews
There are no reviews yet.