


The Mobile App Performance KPI Dashboard in Excel is an essential tool for mobile app developers, product managers, and marketers who want to track and optimize the performance of their mobile applications. Whether you’re tracking user engagement, app usage, conversion rates, or retention, this customizable Excel template allows you to monitor key performance indicators (KPIs) and make data-driven decisions to improve your app’s performance.
With this intuitive and easy-to-use dashboard, you can monitor user behavior, track downloads, measure in-app activities, and understand how users interact with your app. This tool provides real-time insights that help you identify areas for improvement, optimize app features, and enhance user experience.
Key Features of the Mobile App Performance KPI Dashboard
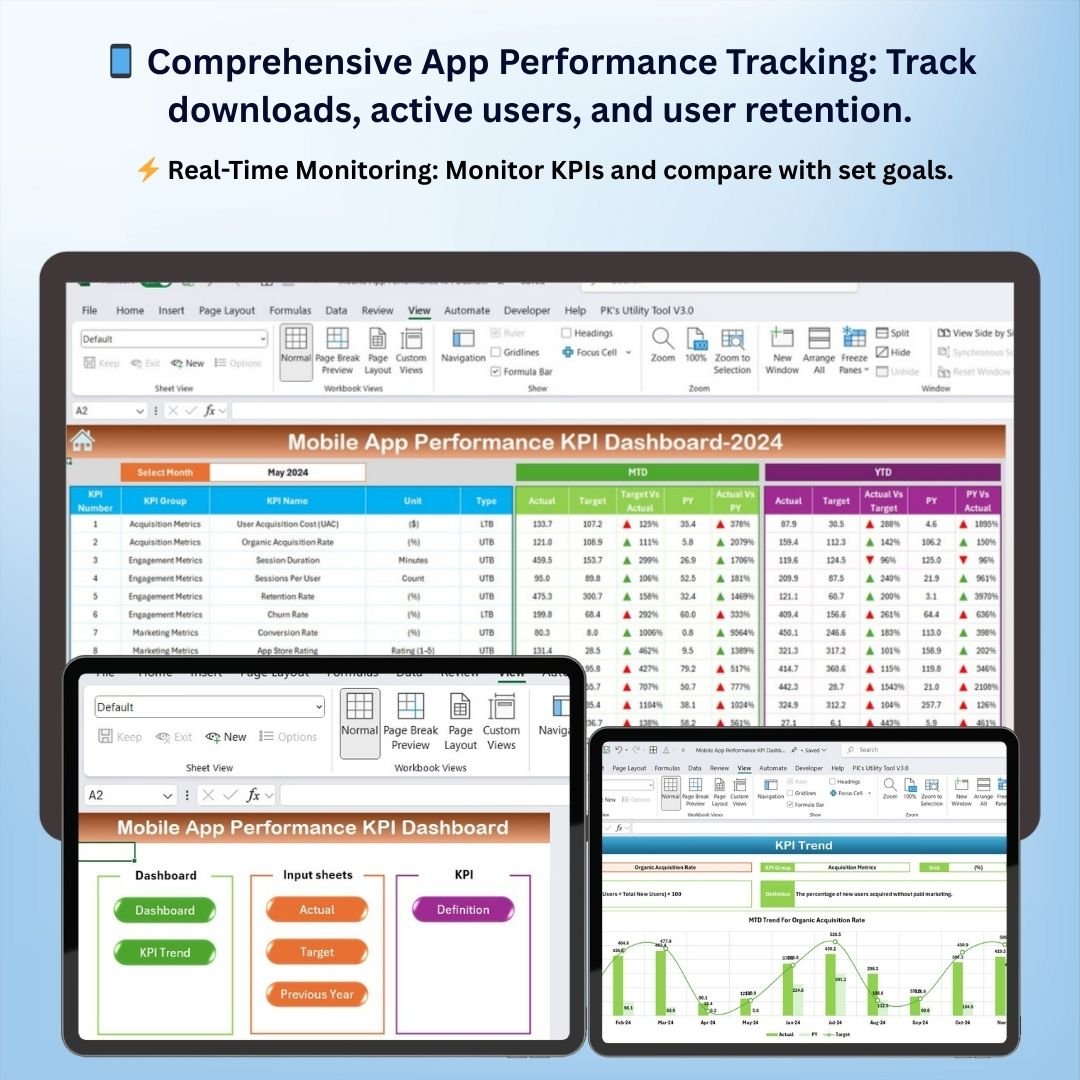
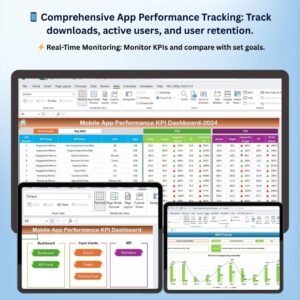
📱 Comprehensive App Performance Tracking
Track key metrics such as app downloads, daily/monthly active users, user retention, session length, and user acquisition cost. Measure the overall performance of your app to assess its success.
⚡ Real-Time Monitoring
Monitor app performance in real-time, comparing actual metrics to set goals. The dashboard enables you to analyze trends and make adjustments to enhance app performance and user satisfaction.
📈 User Engagement Insights
Understand how users are interacting with your app by tracking in-app events, screen views, and feature usage. Use these insights to optimize user engagement and retention strategies.
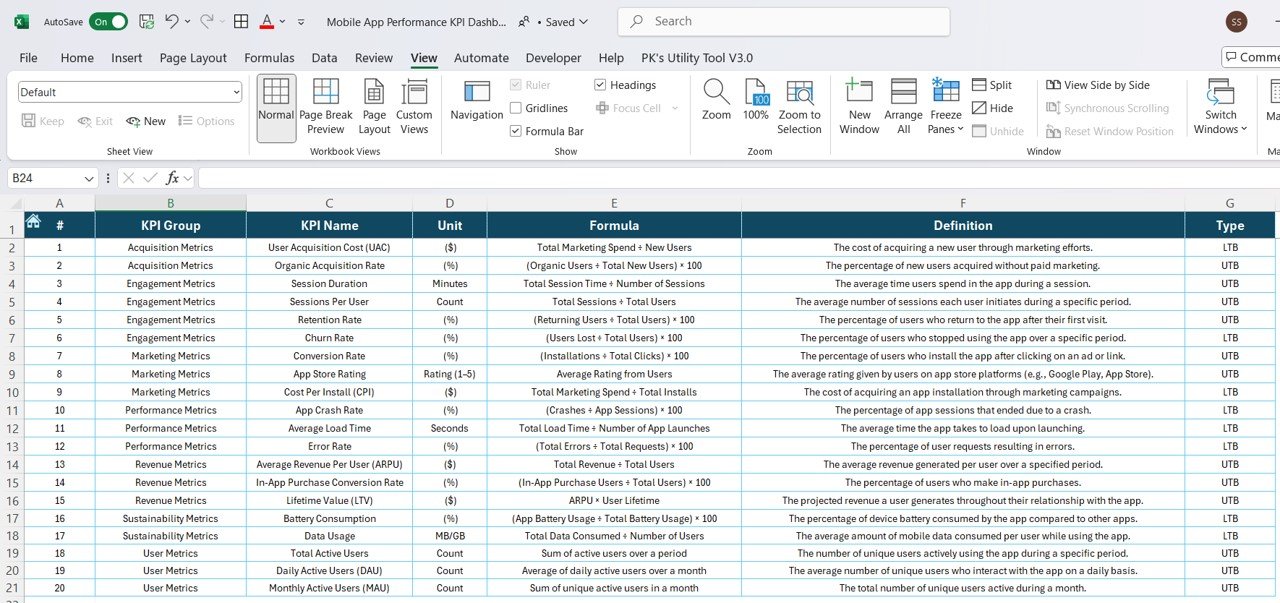
📅 Customizable KPIs for Your App
Easily tailor the dashboard to track KPIs specific to your app, whether it’s tracking app downloads, in-app purchases, session frequency, or other app-related metrics.
🖥️ Interactive & User-Friendly Interface
The Excel-based dashboard is designed with simplicity in mind, offering easy navigation, intuitive data entry, and clear visual representations of your app’s performance through charts and graphs.
Why You’ll Love the Mobile App Performance KPI Dashboard

✅ Track Key Mobile App Metrics
Monitor downloads, user engagement, and retention to understand how your app is performing and where improvements are needed.
✅ Optimize User Acquisition & Retention
Track user acquisition costs (UAC), session frequency, and user retention rates to optimize your marketing strategies and improve user lifetime value (LTV).
✅ Enhance In-App Experience
By tracking in-app activities and user engagement, you can optimize app features and improve the user experience, leading to higher satisfaction and better app reviews.
✅ Data-Driven Decision Making
Use the insights from your app’s performance data to make informed decisions about updates, marketing campaigns, and feature enhancements.
✅ Visualize Key Performance Trends
Easily visualize trends in app usage, user retention, and other key performance metrics with interactive charts and graphs that help you identify patterns and opportunities.
What’s Inside the Mobile App Performance KPI Dashboard Template?
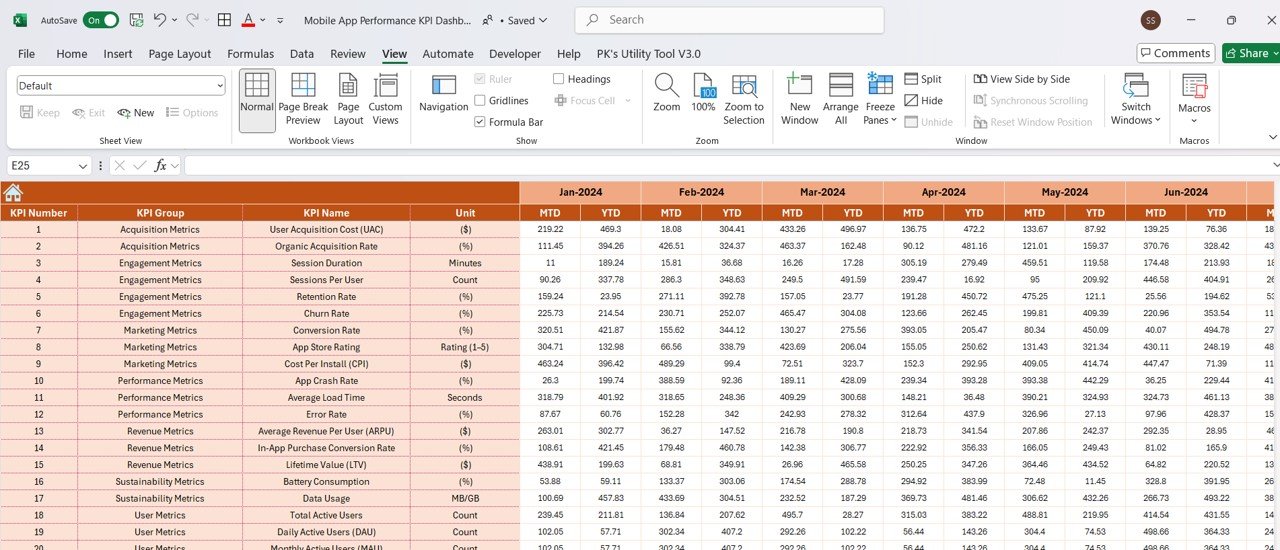
- App Performance Tracking: Track app downloads, daily/monthly active users, user retention, and user acquisition cost.
- User Engagement Insights: Monitor in-app events, feature usage, and session behavior to optimize user experience.
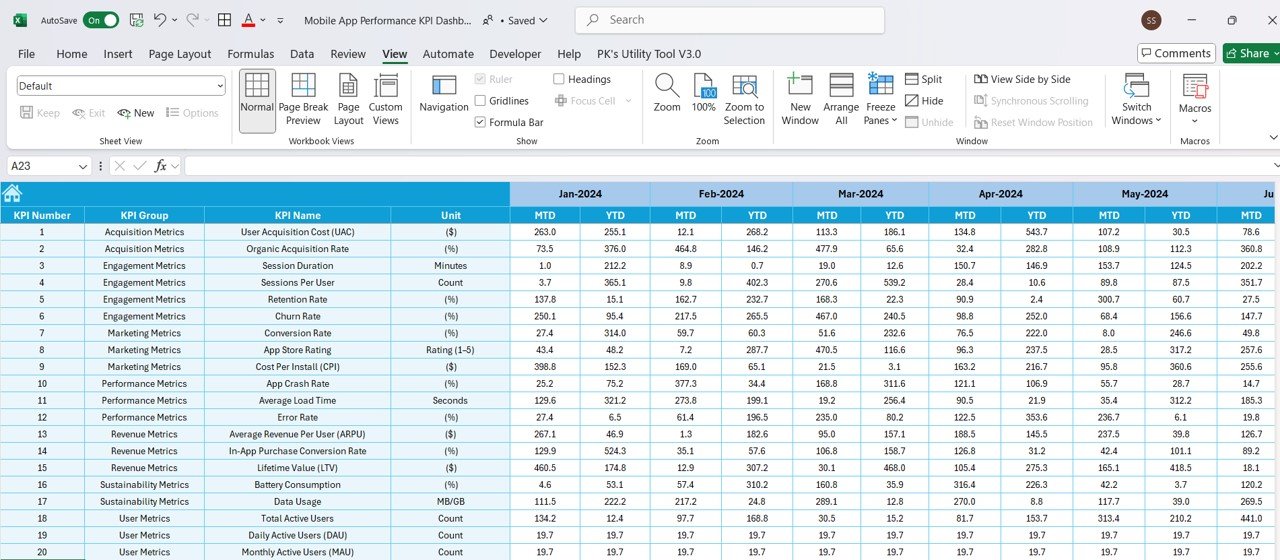
- Retention & Conversion Metrics: Track user retention, churn rate, and conversion rates for in-app purchases or other goals.
- Customizable Dashboard: Tailor the dashboard to track specific KPIs relevant to your mobile app.
- Interactive Reporting: Visualize your data with charts and graphs for easy analysis and reporting.
How to Use the Mobile App Performance KPI Dashboard
1️⃣ Download the Template: Access the Mobile App Performance KPI Dashboard instantly.
2️⃣ Enter Your App Data: Input data such as downloads, user engagement, and retention metrics.
3️⃣ Monitor KPIs: Use the dashboard to track app performance in real-time and compare it against your targets.
4️⃣ Analyze & Optimize: Use the data insights to optimize your app features, improve user retention, and enhance marketing strategies.
Who Can Benefit from the Mobile App Performance KPI Dashboard?
🔹 Mobile App Developers & Product Managers
🔹 Marketing & User Acquisition Teams
🔹 Business Analysts & App Growth Specialists
🔹 Mobile App Startups & Enterprises
🔹 Anyone Looking to Optimize Mobile App Performance
Track, analyze, and improve the performance of your mobile app with the Mobile App Performance KPI Dashboard in Excel. Stay on top of key performance metrics, enhance user engagement, and drive the success of your app.
Click here to read the Detailed blog post
Visit our YouTube channel to learn step-by-step video tutorials
Youtube.com/@PKAnExcelExpert


Reviews
There are no reviews yet.