
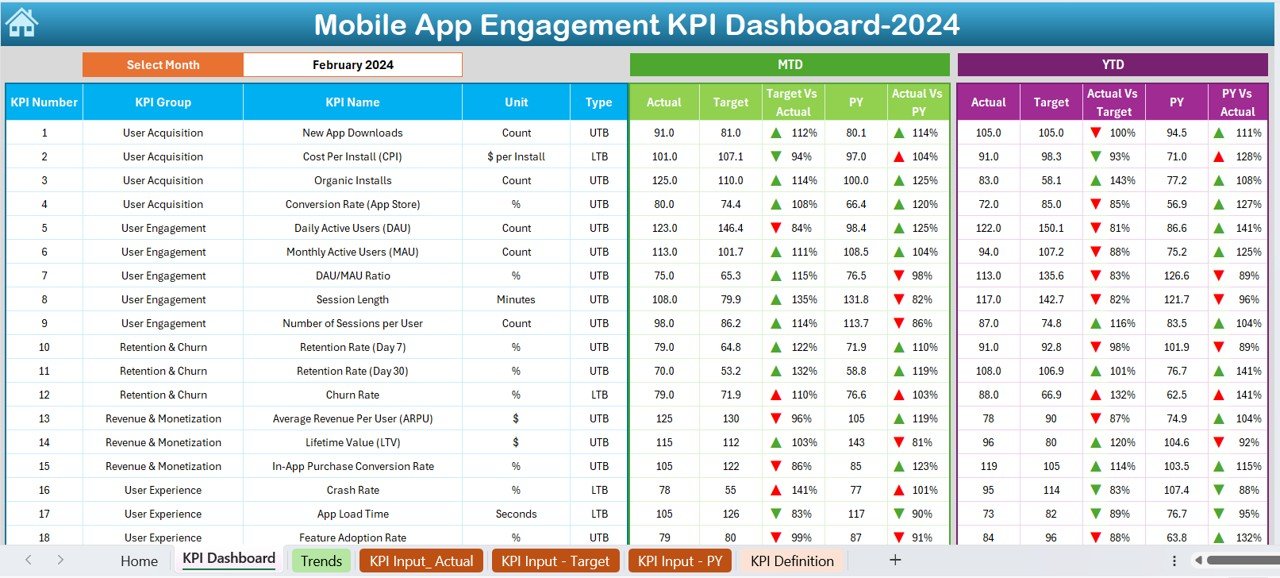
The Mobile App Engagement KPI Dashboard in Excel is an essential tool for app developers, marketers, and product managers looking to track and optimize user engagement. This Excel-based dashboard provides a clear and comprehensive overview of key performance indicators (KPIs) that are crucial for understanding how users interact with your mobile app.
With easy-to-read charts, real-time data updates, and customizable features, this dashboard helps you monitor important metrics such as user retention, session duration, active users, and conversion rates. Whether you’re launching a new app or managing an existing one, this tool provides valuable insights to help improve user experience, optimize app performance, and ultimately boost app success.
Key Features of the Mobile App Engagement KPI Dashboard in Excel
📱 Track User Engagement Metrics
Monitor key engagement metrics such as daily and monthly active users, session duration, screen views, and user interactions to evaluate the overall performance of your app.
📊 Monitor Retention & Churn Rates
Track user retention and churn rates to identify how well your app retains users over time. Understand the factors contributing to user drop-off and take action to improve retention.
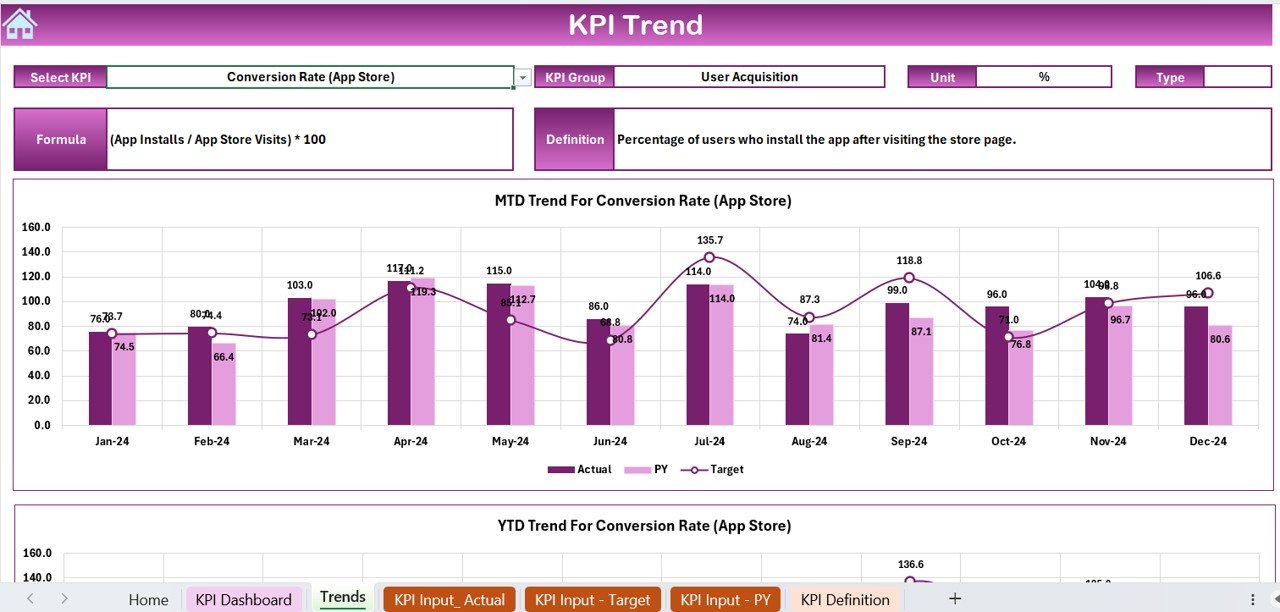
📈 Conversion Rate Tracking
Measure the conversion rate of key app actions, such as purchases, sign-ups, or in-app upgrades. Identify areas where users drop off in the conversion funnel and optimize accordingly.
🧑🤝🧑 User Demographics & Behavior Analysis
Gain insights into your app’s user base by tracking demographics, user acquisition sources, and behavior patterns. Tailor your marketing and development efforts to better suit your target audience.
📅 Campaign & Feature Impact Monitoring
Track the effectiveness of marketing campaigns and new feature releases. Measure user engagement before and after a campaign or feature update to assess its impact on app usage.
🖥️ Customizable & Interactive Layout
This Excel dashboard is fully customizable, allowing you to adjust KPIs, time periods, and data visualization settings to match your app’s specific performance goals.
Why You’ll Love the Mobile App Engagement KPI Dashboard in Excel
✅ Improve User Retention & Engagement
Track engagement metrics and retention rates to identify areas of improvement. Enhance user experience and increase the chances of long-term user retention.
✅ Optimize Conversion Rates
By tracking conversion funnels, you can pinpoint where users drop off and optimize the user journey to increase conversion rates and revenue.
✅ Data-Driven Decision Making
Make informed decisions based on real-time data and insights. Use the dashboard to adjust your app’s features, marketing strategies, and user experience to meet your goals.
✅ Boost Marketing Campaign Performance
Analyze the effectiveness of your marketing campaigns by tracking changes in user engagement, acquisition, and conversion. Adjust strategies to improve ROI.
✅ Fully Customizable & Scalable
Customize the dashboard to your app’s unique metrics, features, and audience. Scale the dashboard as your app grows, ensuring you have continuous access to valuable insights.
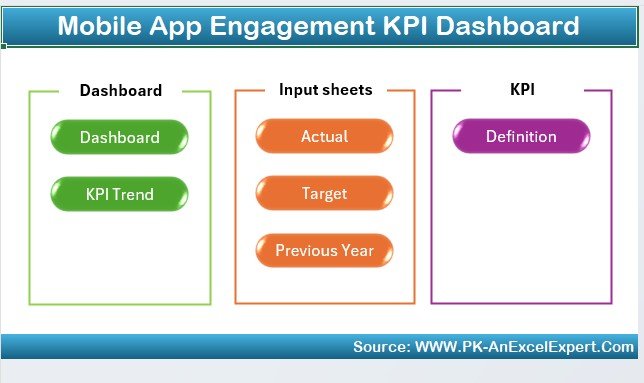
What’s Inside the Mobile App Engagement KPI Dashboard Template in Excel?
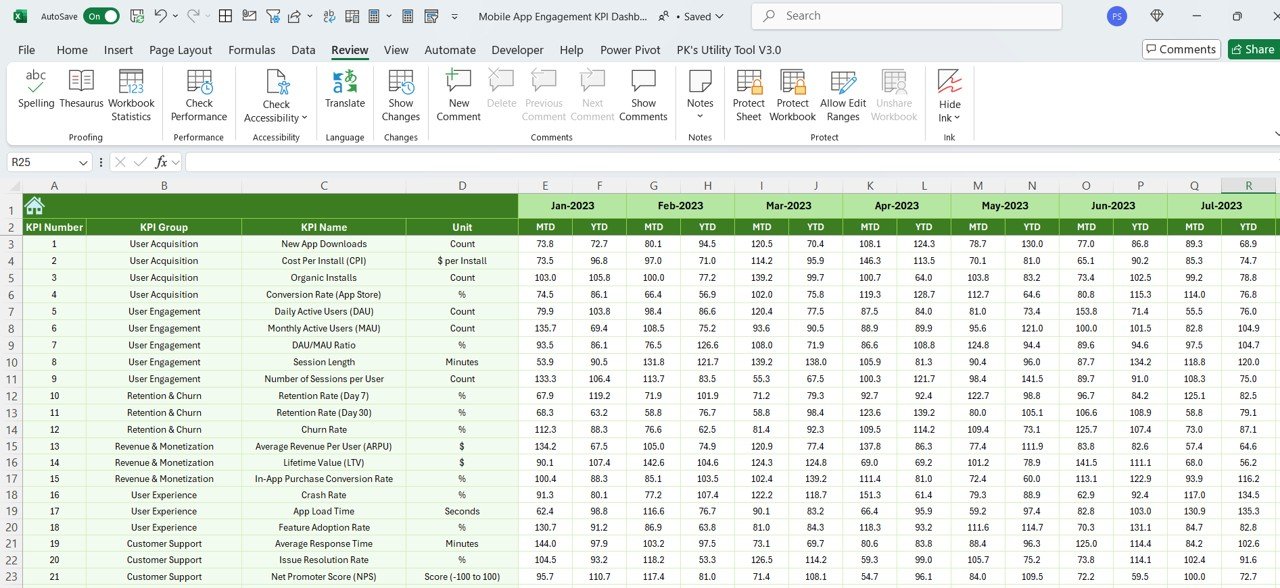
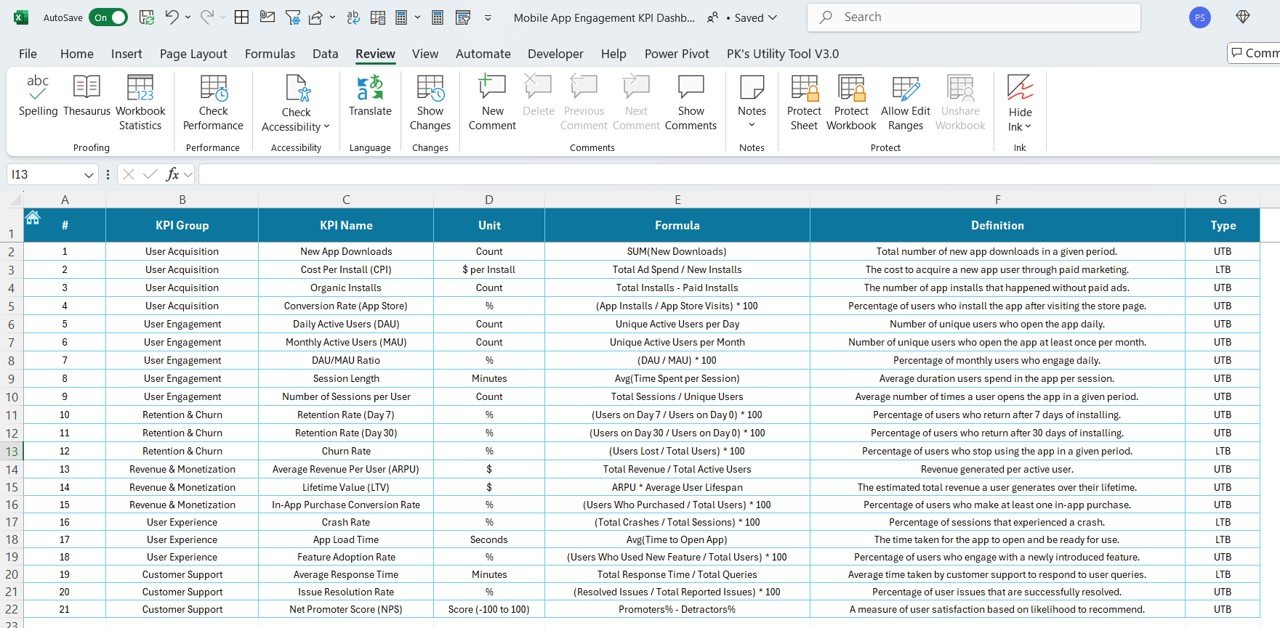
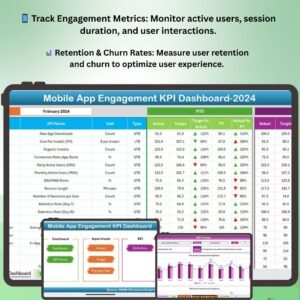
- Engagement Metrics Tracking: Monitor active users, session duration, and user interactions.
- Retention & Churn Analysis: Track user retention, churn rates, and user lifecycle.
- Conversion Funnel Monitoring: Measure key conversion actions such as purchases or sign-ups.
- Demographic Insights: Track user demographics, acquisition sources, and behaviors.
- Campaign Performance Monitoring: Evaluate the impact of marketing campaigns and feature releases.
- Customizable Layout & Reports: Tailor KPIs and visualizations to match your app’s performance needs.
How to Use the Mobile App Engagement KPI Dashboard in Excel
1️⃣ Download the Template: Get immediate access to the Mobile App Engagement KPI Dashboard in Excel.
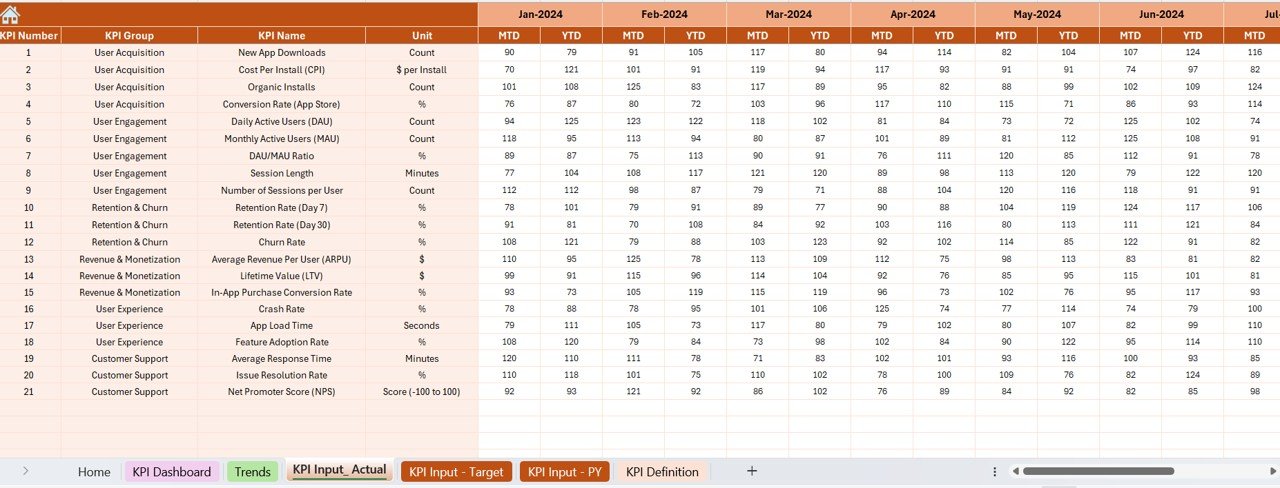
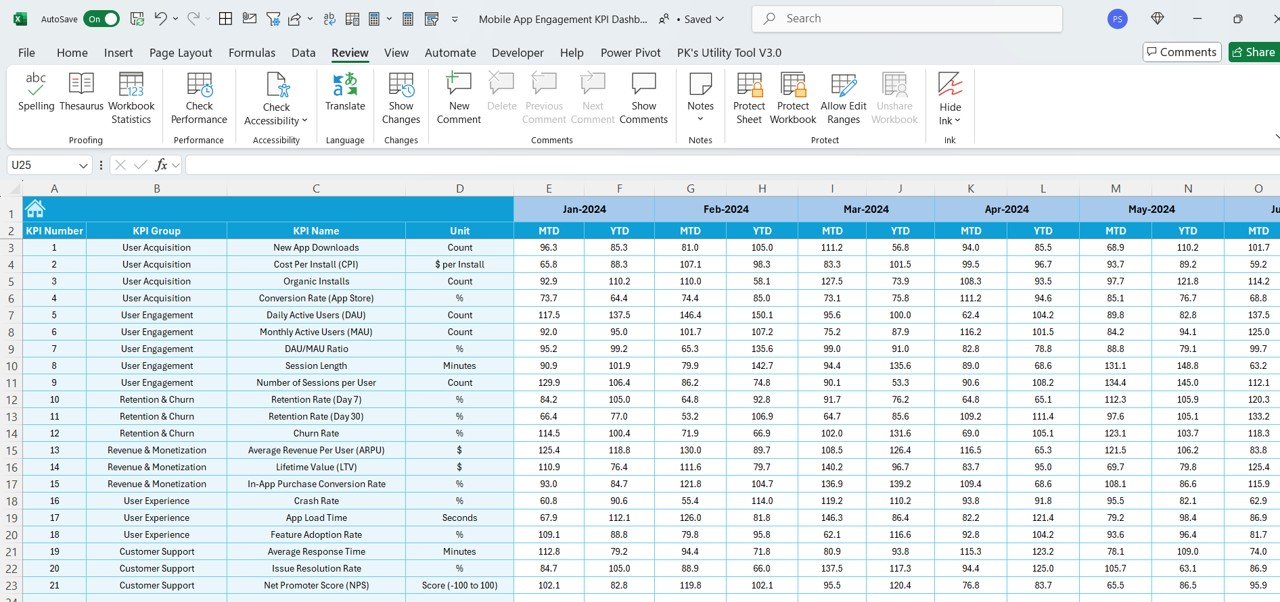
2️⃣ Input Your App Data: Enter user engagement metrics, conversion rates, and retention data into the dashboard.
3️⃣ Track & Monitor KPIs: Use the dashboard to track daily and monthly active users, retention rates, session duration, and more.
4️⃣ Analyze & Optimize: Use the insights to optimize user experience, marketing strategies, and app features.
5️⃣ Generate Reports: Create detailed reports on engagement metrics, retention, conversion rates, and more for your team or stakeholders.
Who Can Benefit from the Mobile App Engagement KPI Dashboard in Excel?
🔹 App Developers & Product Managers
🔹 Mobile App Marketers & Growth Teams
🔹 Data Analysts & Business Intelligence Teams
🔹 Marketing & Customer Acquisition Teams
🔹 App Performance & User Experience Analysts
🔹 Entrepreneurs & Startups in Mobile App Development
Optimize your mobile app’s performance and user engagement with the Mobile App Engagement KPI Dashboard in Excel. Track essential metrics, improve retention, and boost your app’s success with data-driven insights.
Click here to read the Detailed blog post
Visit our YouTube channel to learn step-by-step video tutorials
Youtube.com/@PKAnExcelExpert


Reviews
There are no reviews yet.