Mining operations generate massive volumes of operational and financial data every day. From production output and equipment utilization to operational costs, downtime, safety performance, and profitability, mining companies must continuously monitor performance to remain competitive. However, many organizations still rely on fragmented spreadsheets and manual reporting processes, making it difficult to identify performance issues quickly.
The Mining Dashboard in Google Sheets is a powerful, ready-to-use analytics solution designed to transform complex mining data into clear, actionable insights. Built entirely in Google Sheets, this cloud-based dashboard centralizes mining performance metrics into one interactive reporting environment, allowing teams to analyze operations efficiently and make faster data-driven decisions.
Instead of reviewing multiple reports across departments, decision-makers can monitor key performance indicators (KPIs) through dynamic charts, KPI cards, and interactive filters. Because Google Sheets supports real-time collaboration, teams across mine sites and offices can access updated dashboards instantly from anywhere. ⛏️📊
## Key Features of Mining Dashboard in Google Sheets
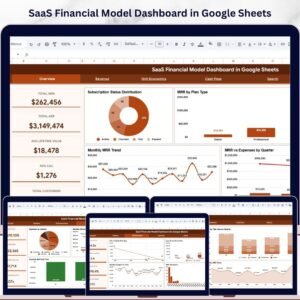
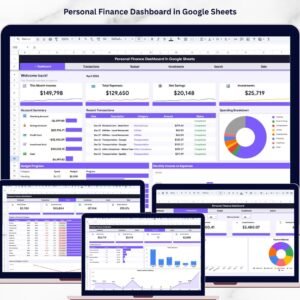
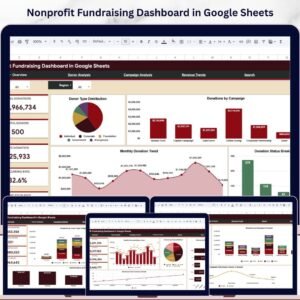
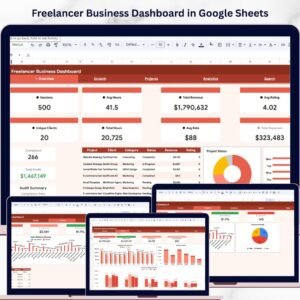
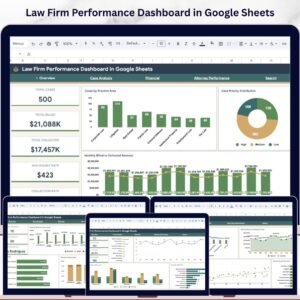
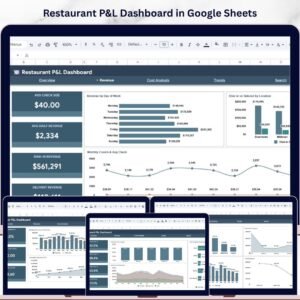
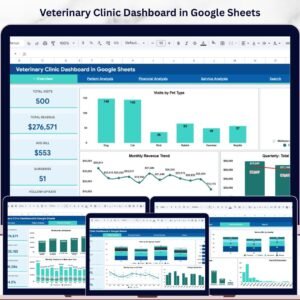
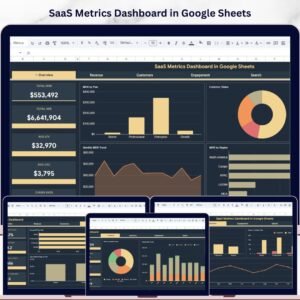
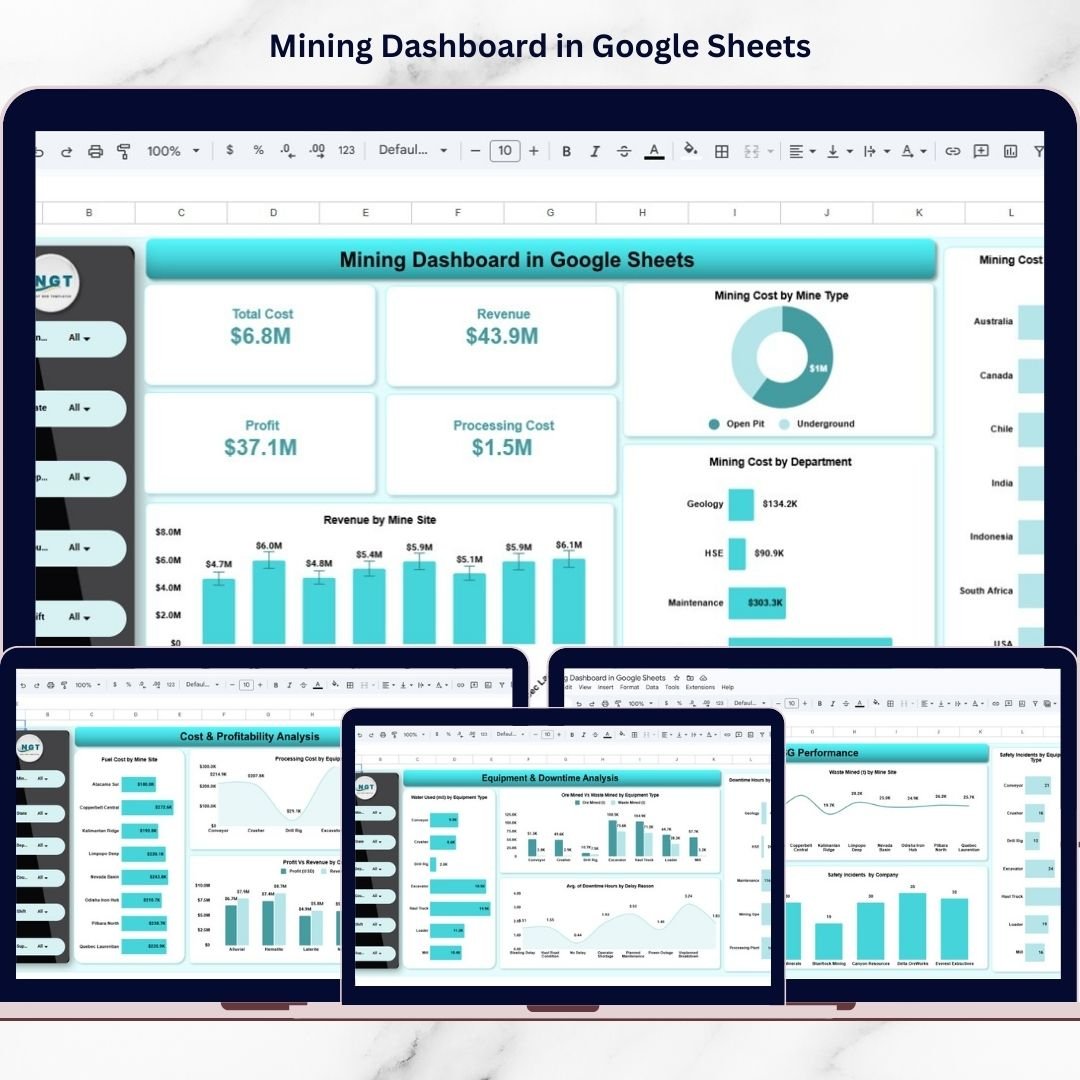
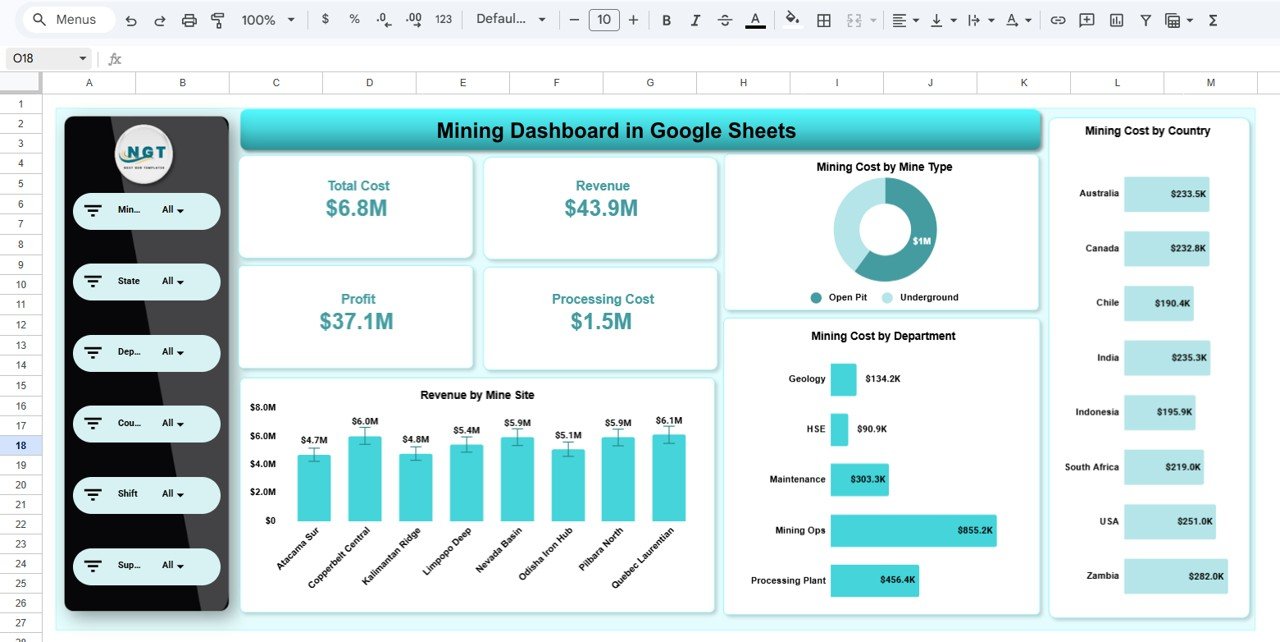
📊 Executive KPI Dashboard – Monitor mining costs, revenue, profit, and processing expenses at a glance.
🎛️ Interactive Filters & Slicers – Analyze performance by Mine, State, Department, Country, Shift, and Supervisor.
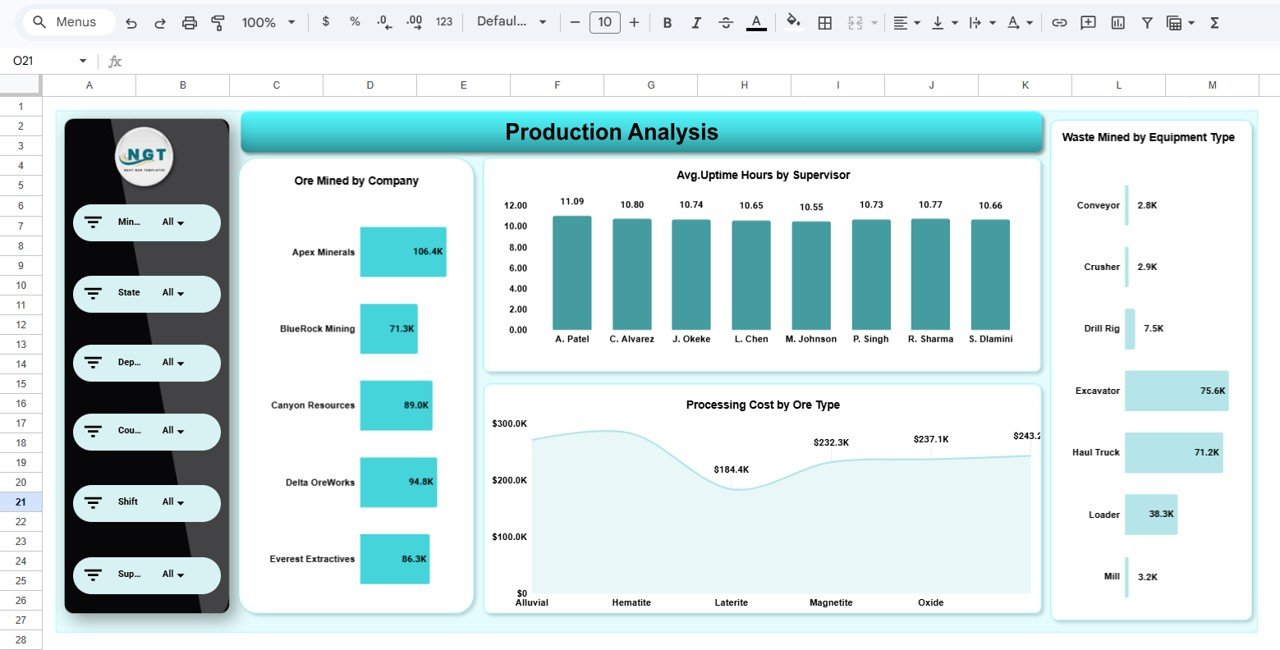
⛏️ Production Performance Analytics – Track ore mined, waste mined, and operational output.
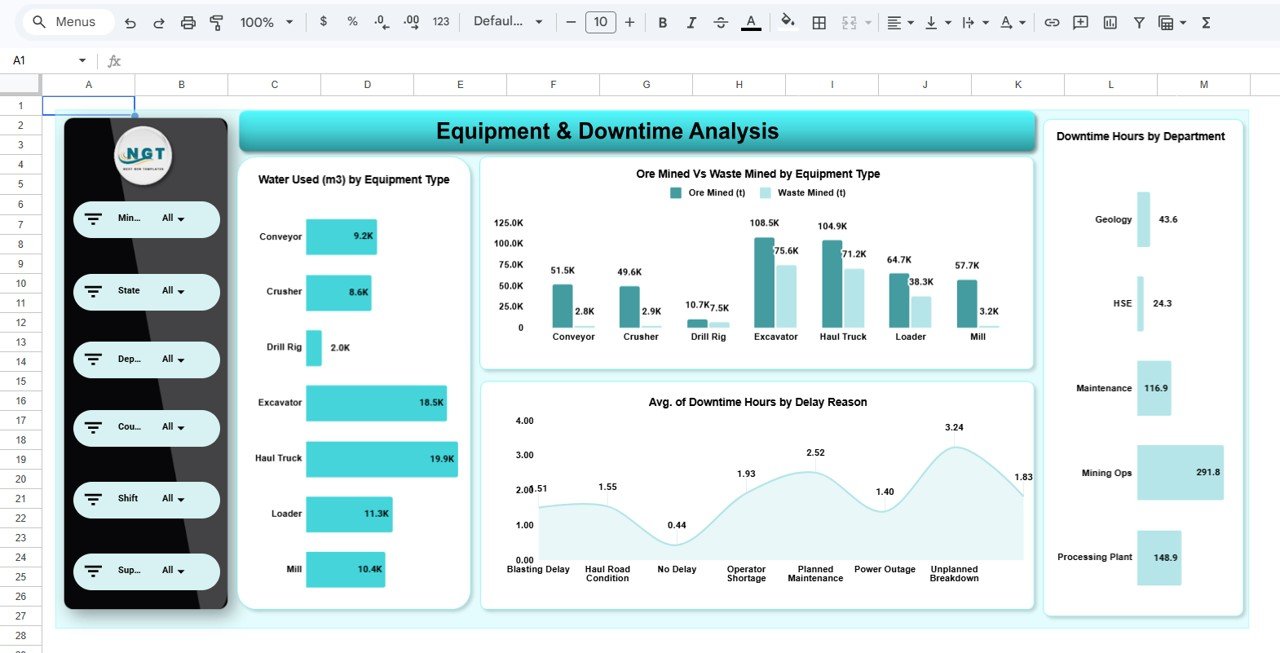
⚙️ Equipment & Downtime Analysis – Identify bottlenecks and equipment inefficiencies quickly.
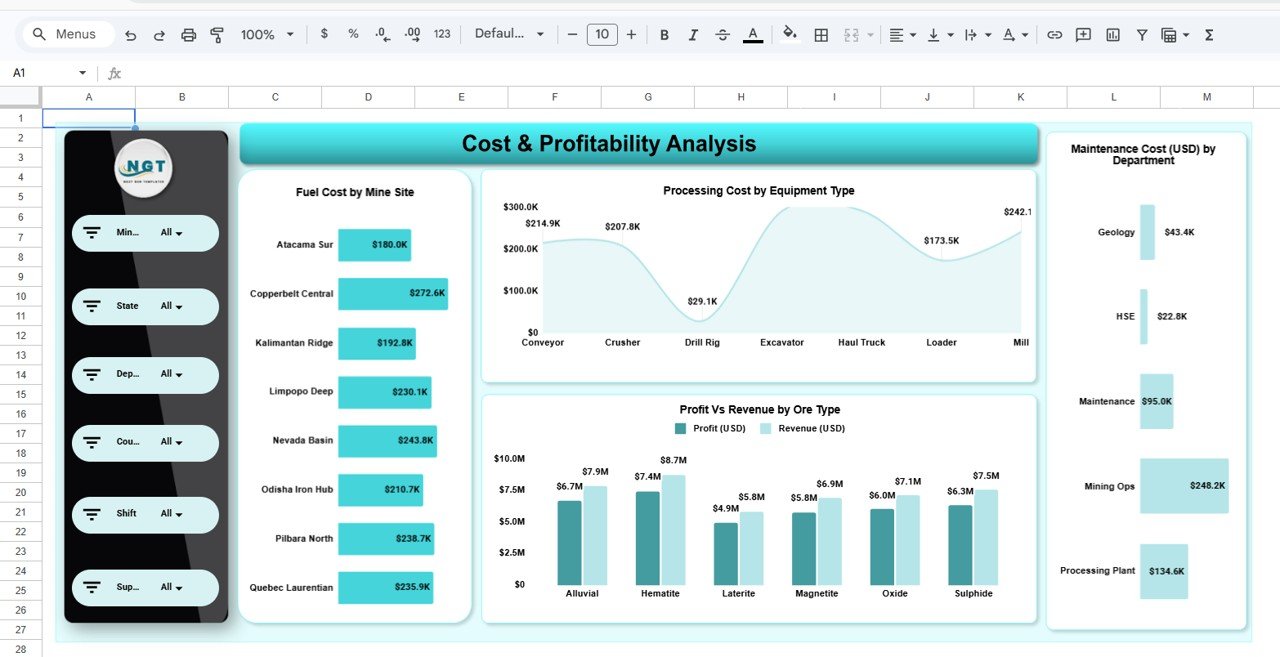
💰 Cost & Profitability Monitoring – Evaluate financial performance across operations.
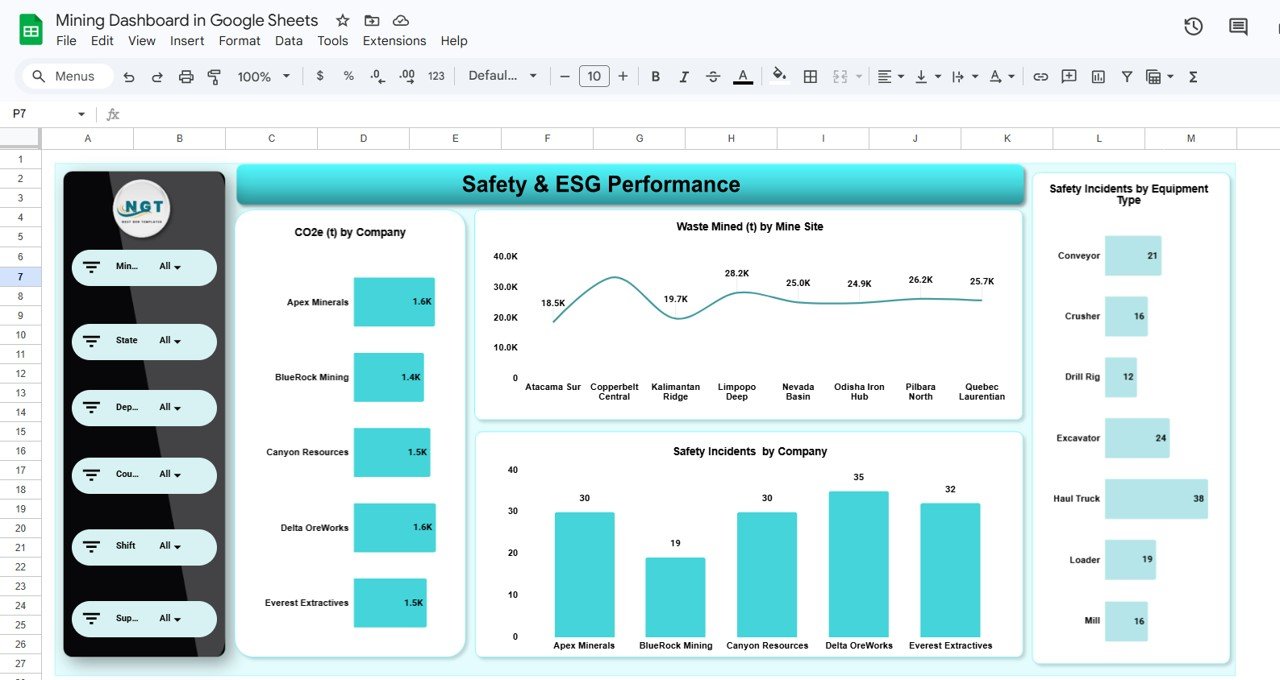
🌱 Safety & ESG Tracking – Monitor safety incidents and environmental performance metrics.
📈 Dynamic Visual Charts – Automatically updated visuals simplify complex mining analysis.
☁️ Cloud-Based Collaboration – Share dashboards across teams in real time.
These features convert Google Sheets into a lightweight mining business intelligence platform.
## What’s Inside the Mining Dashboard in Google Sheets
This ready-to-use dashboard includes multiple analytical pages:
✅ Executive Overview – High-level mining performance summary with KPI cards and financial visuals.
✅ Production Analysis Page – Operational output and efficiency analysis across sites.
✅ Equipment & Downtime Analysis Page – Equipment utilization and delay reason insights.
✅ Cost & Profitability Analysis Page – Financial performance and expense monitoring dashboards.
✅ Safety & ESG Performance Page – Environmental and safety tracking analytics.
Each page provides focused insights while remaining connected through interactive filters.
## How to Use the Mining Dashboard in Google Sheets
Using the dashboard is simple and user-friendly:
1️⃣ Update operational and financial data in the data sheet.
2️⃣ Open the Executive Overview dashboard.
3️⃣ Apply filters such as mine, department, or supervisor.
4️⃣ Review KPI cards and visual charts.
5️⃣ Analyze production, equipment, and cost performance pages.
6️⃣ Monitor safety and ESG metrics for compliance insights.
Within minutes, organizations can begin analyzing mining performance professionally.
## Who Can Benefit from This Mining Dashboard in Google Sheets
This dashboard is ideal for:
⛏️ Mining operations managers
👷 Site supervisors and engineers
📊 Financial and performance analysts
⚙️ Equipment and maintenance managers
🛡️ Safety and ESG officers
📈 Mining executives and leadership teams
From operational monitoring to strategic planning, this dashboard supports every decision-making level.
A centralized analytics system empowers mining organizations to operate smarter. By combining KPI tracking, interactive reporting, and automated visual insights, the Mining Dashboard in Google Sheets helps companies improve efficiency, reduce downtime, and enhance profitability.
Instead of relying on delayed reports, teams gain real-time operational visibility that supports faster decisions and sustainable mining performance. ✅
### Click here to read the Detailed blog post
Watch the step-by-step video tutorial:
Visit our YouTube channel to learn step-by-step video tutorials:
👉 YouTube.com/@NeotechNavigators