Managing performance in microfinance institutions is never simple. You must track portfolio quality, growth, efficiency, outreach, and sustainability—often across multiple branches and teams. However, when this data lives in scattered Excel files and manual reports, visibility drops and decisions slow down.
That is exactly where the Microfinance Institutions KPI Dashboard in Excel becomes a game-changer 🚀.
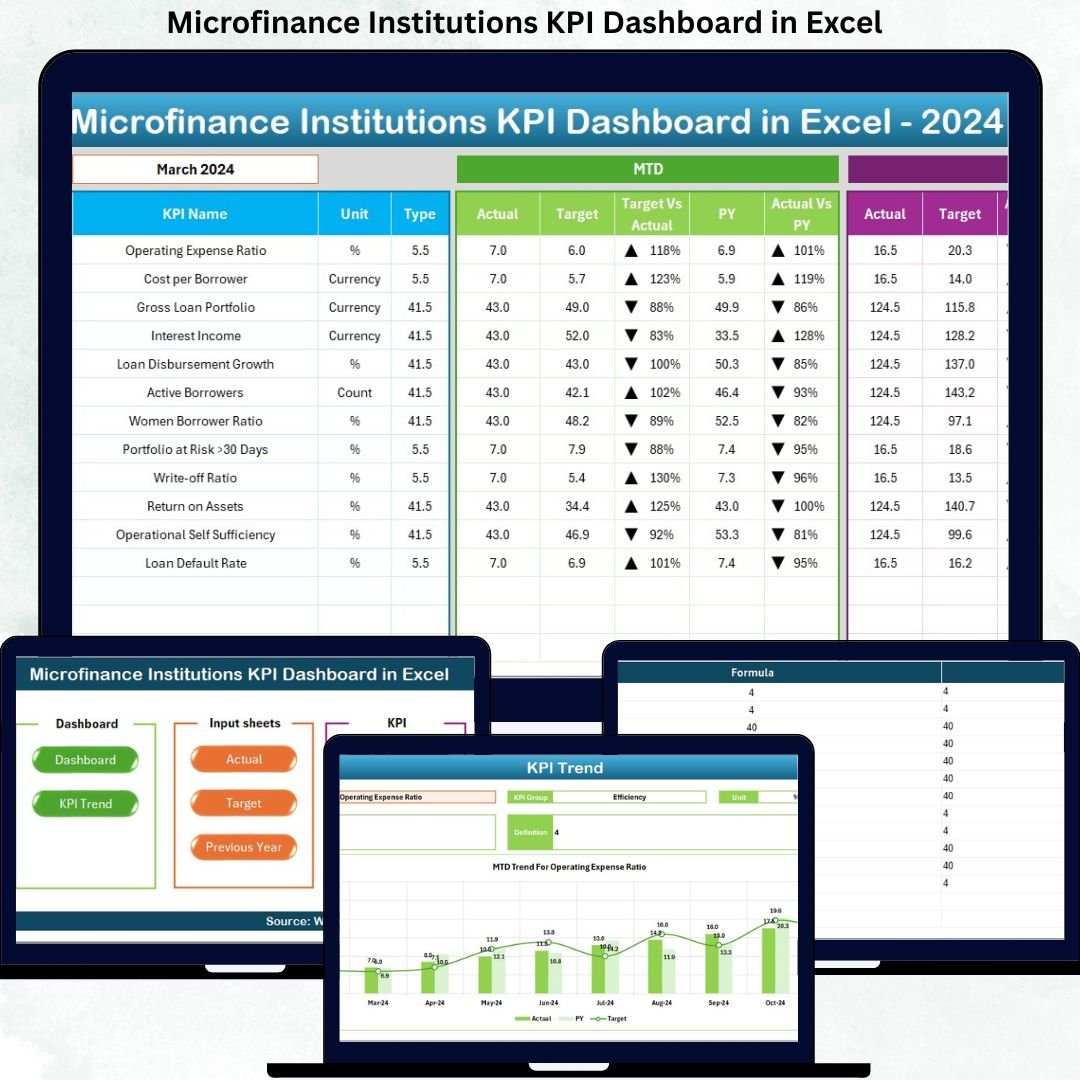
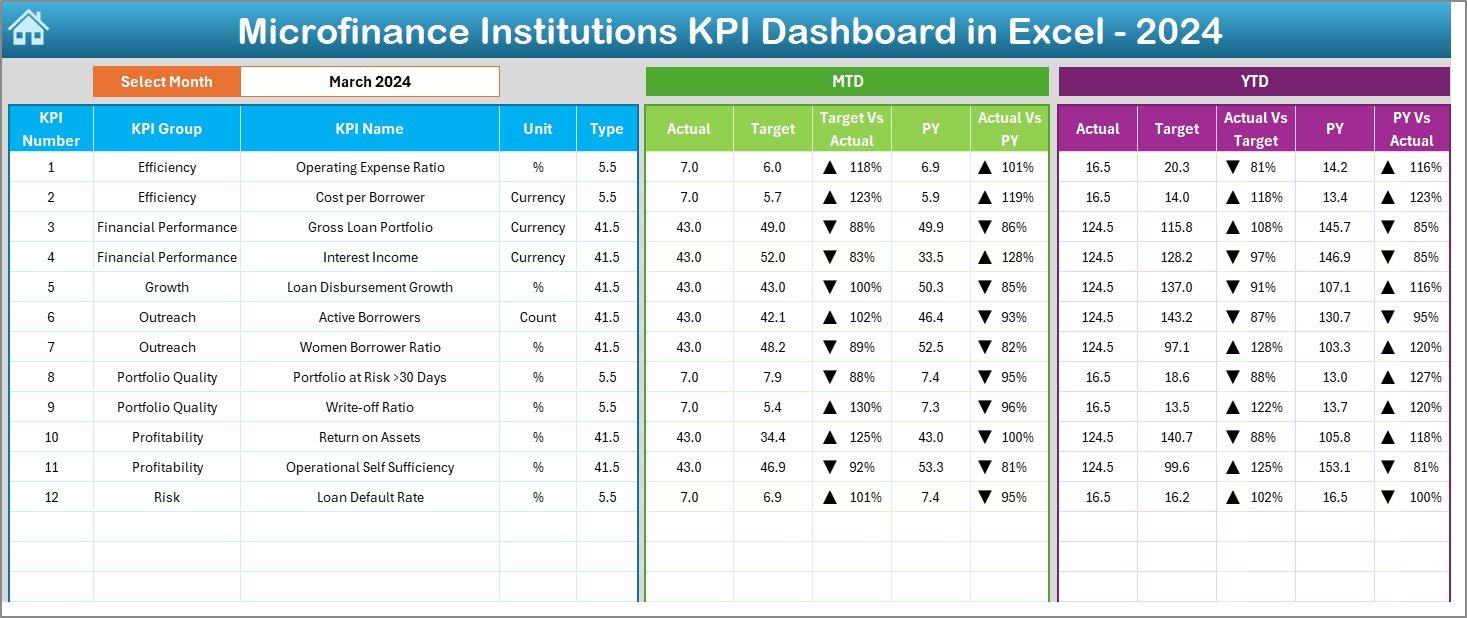
This ready-to-use Excel dashboard transforms raw microfinance data into clear, visual, and actionable insights. It helps management monitor performance faster, identify risks early, and make confident decisions—without investing in expensive BI tools.
Designed specifically for microfinance institutions, NBFCs, and lending organizations, this dashboard delivers clarity, speed, and control in one powerful Excel file.
🔑 Key Features of Microfinance Institutions KPI Dashboard in Excel
📌 Interactive Month Selection
Analyze performance month-by-month using a simple drop-down control. One click updates the entire dashboard instantly.
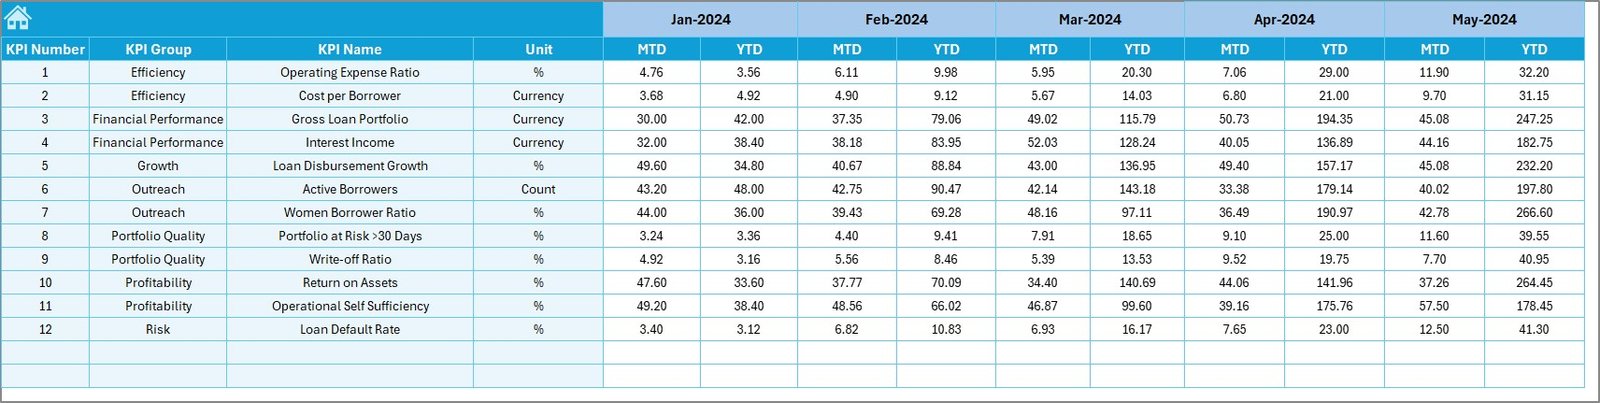
📊 MTD & YTD Performance Tracking
Monitor both Month-to-Date and Year-to-Date KPIs with Actual, Target, and Previous Year comparisons.
📈 Smart Variance Analysis
Automatically calculate Target vs Actual (%) and Previous Year vs Actual (%) for quick performance evaluation.
🚦 Conditional Formatting Indicators
Visual up/down arrows highlight underperformance and improvement trends at a glance.
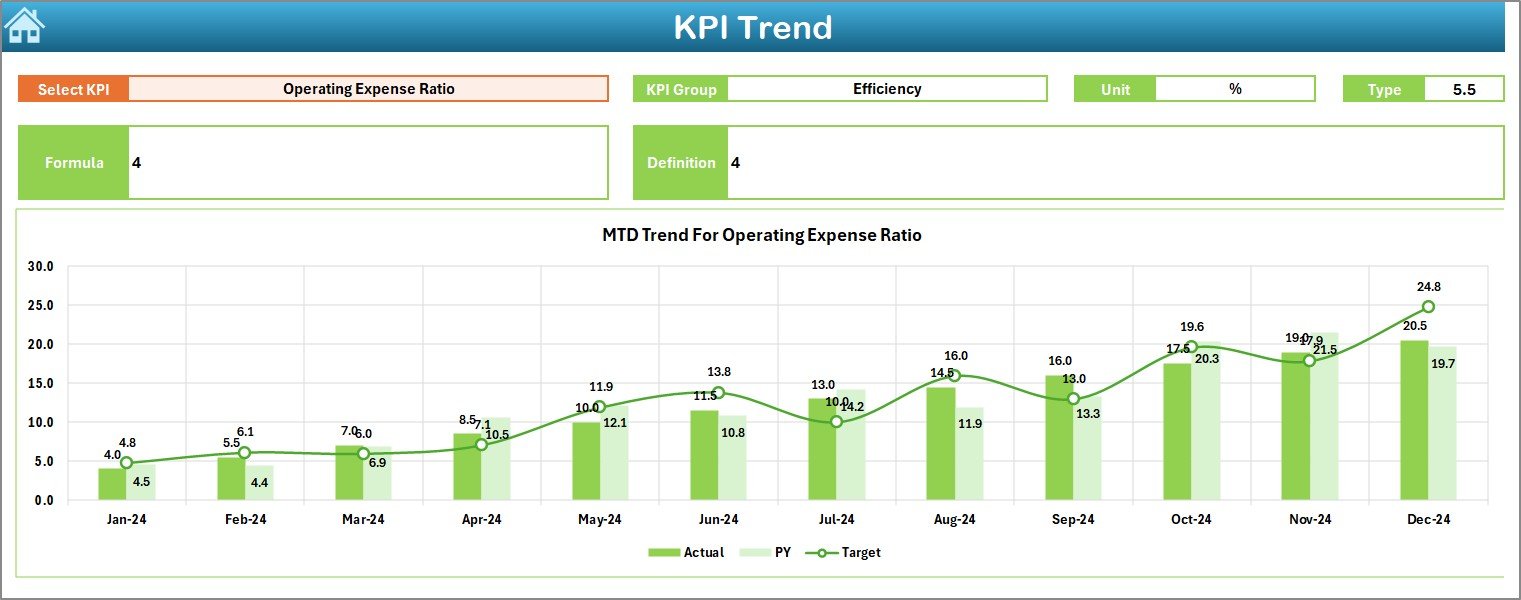
📉 Detailed KPI Trend Analysis
Track individual KPI trends with interactive MTD and YTD charts for deeper insights.
🧩 Structured & Scalable Design
Add new KPIs, targets, or periods easily without breaking formulas or layouts.
💰 Cost-Effective & Excel-Based
No need for expensive BI software—everything works seamlessly inside Excel.
📦 What’s Inside the Microfinance Institutions KPI Dashboard in Excel
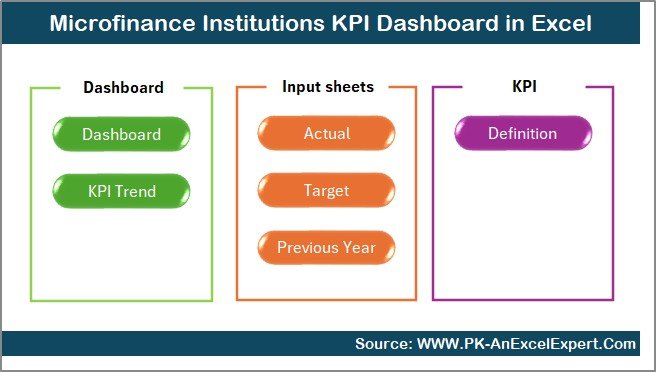
This dashboard includes 7 professionally structured worksheets, each serving a clear purpose:
📍 Summary Page – A navigation hub with buttons to jump instantly to any section
📍 Dashboard Sheet – Central performance view with all key KPIs
📍 Trend Sheet – KPI-wise deep analysis with charts and definitions
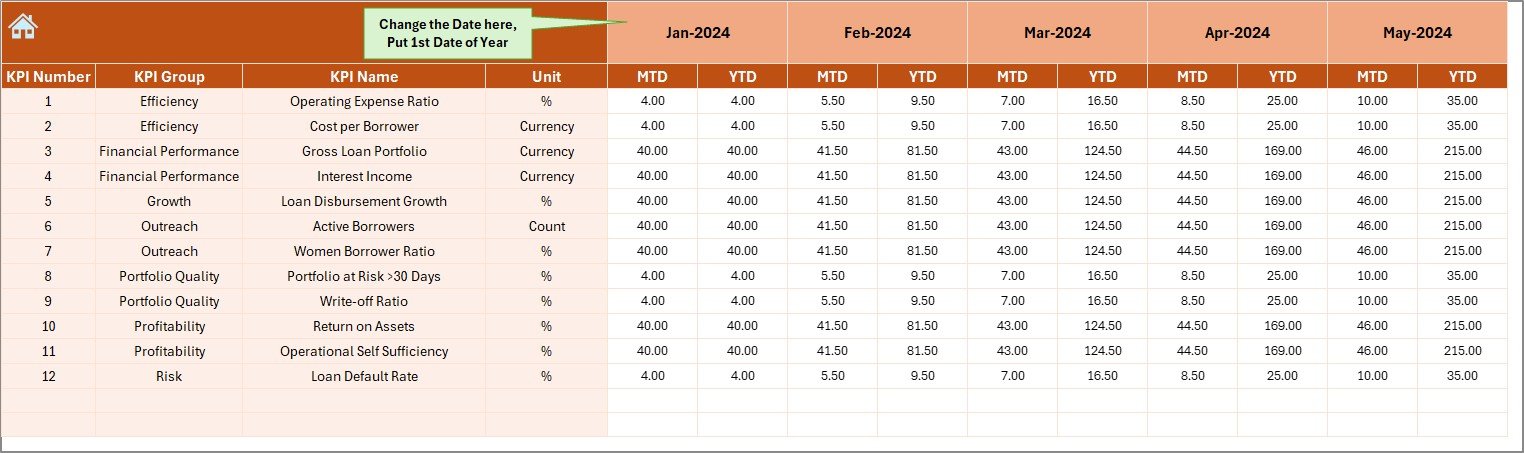
📍 Actual Numbers Input Sheet – Centralized data entry for actual values
📍 Target Sheet – Monthly and YTD target planning
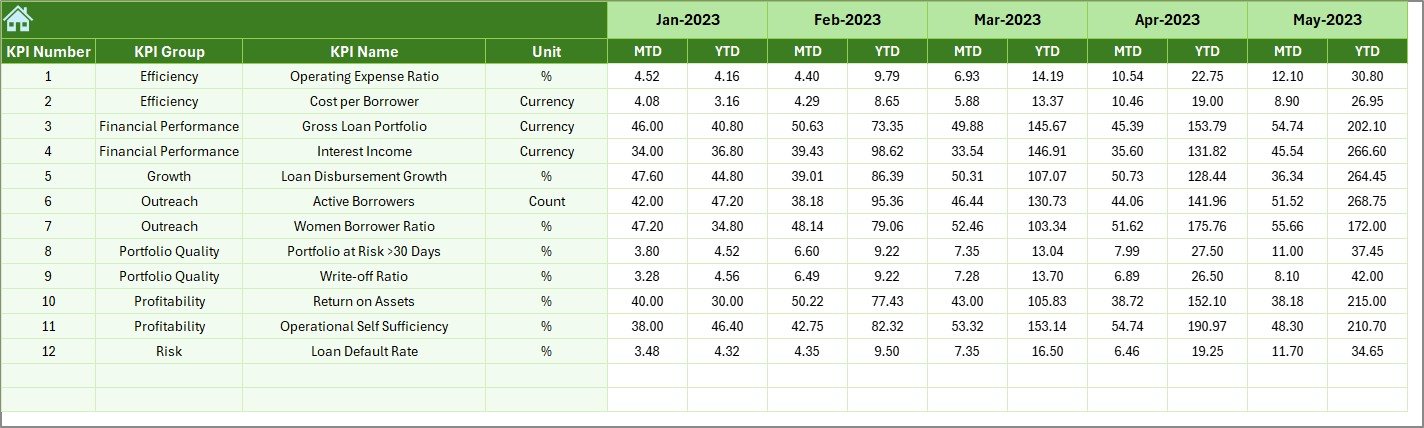
📍 Previous Year Numbers Sheet – Year-on-year performance comparison
📍 KPI Definition Sheet – KPI governance with formulas, units, and definitions
Together, these sheets create a complete performance monitoring ecosystem for microfinance institutions.
🧭 How to Use the Microfinance Institutions KPI Dashboard in Excel
📝 Step 1: Enter KPI definitions, targets, and previous year values
📅 Step 2: Input monthly MTD and YTD actual numbers
📊 Step 3: Select the month from the dashboard drop-down
🔍 Step 4: Analyze performance using KPIs, variance indicators, and trend charts
📈 Step 5: Use insights for reviews, strategy meetings, and reporting
No technical skills are required. Once data is entered, everything updates automatically—saving hours every month.
🎯 Who Can Benefit from This Microfinance Institutions KPI Dashboard in Excel
This dashboard is ideal for:
🏦 Microfinance Institutions
📊 NBFCs and Lending Companies
🌱 Micro-lending NGOs
🏘️ Cooperative Credit Societies
📉 MIS, Finance, and Operations Teams
📈 Senior Management & Decision-Makers
Whether you manage a small lending operation or a large microfinance network, this dashboard scales effortlessly to your needs.
Click here to read the Detailed Blog Post
Watch the step-by-step video tutorial:


Reviews
There are no reviews yet.