Are you still managing medical device KPIs in scattered spreadsheets? That approach is slowing your growth. In a highly regulated industry where precision, compliance, and performance matter every single month, you cannot afford delayed insights.
The Medical Devices KPI Dashboard in Power BI is a ready-to-use, fully interactive performance monitoring solution designed specifically for medical device manufacturers, distributors, and healthcare suppliers. It centralizes production, quality, regulatory, sales, and service KPIs into one powerful Power BI report.
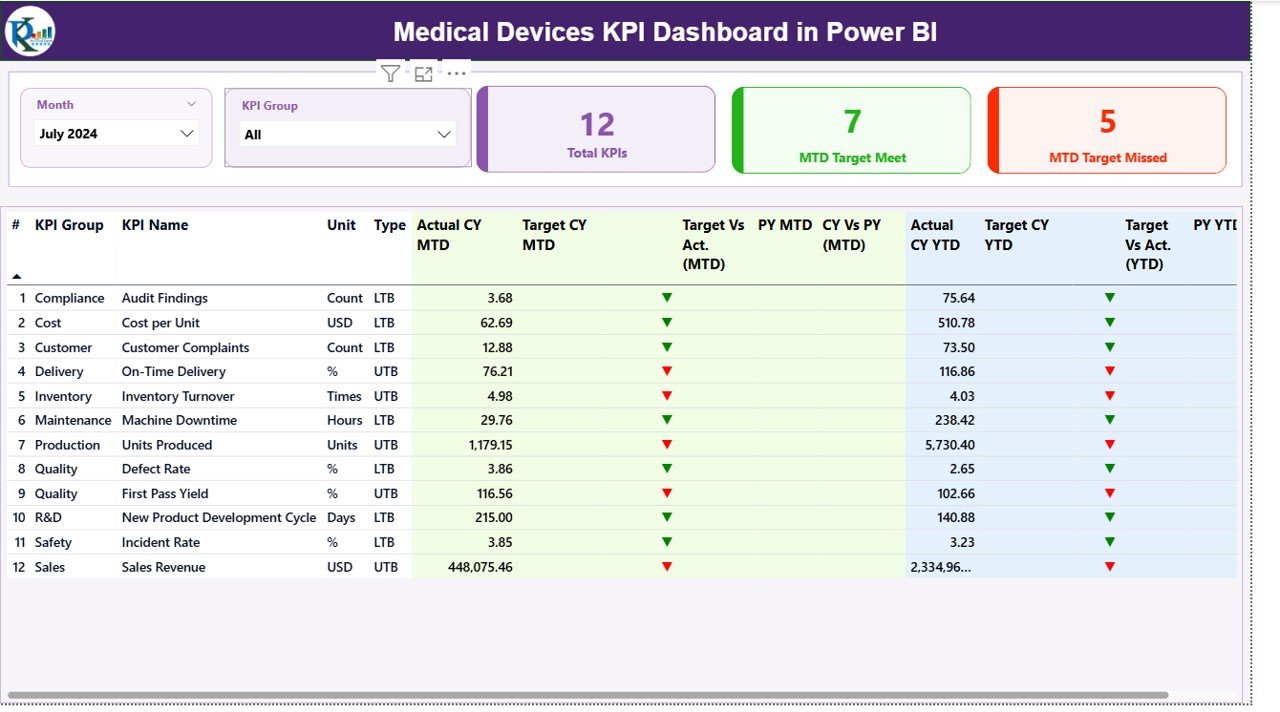
Track MTD vs YTD, compare Actual vs Target, analyze Current Year vs Previous Year, and make confident decisions — all from a single dashboard.
This is not just a report. It is your performance command center.
🚀 Key Features of Medical Devices KPI Dashboard in Power BI
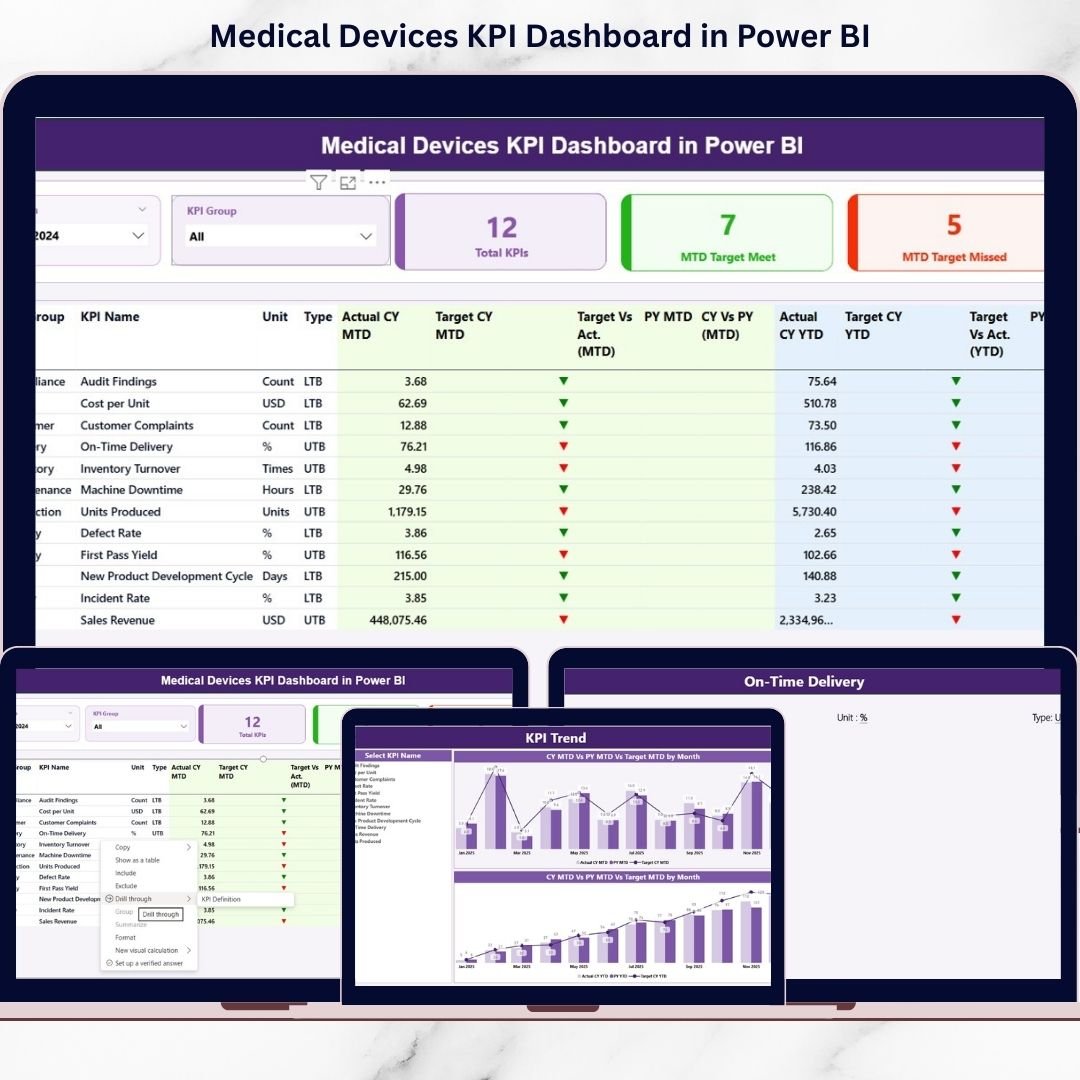
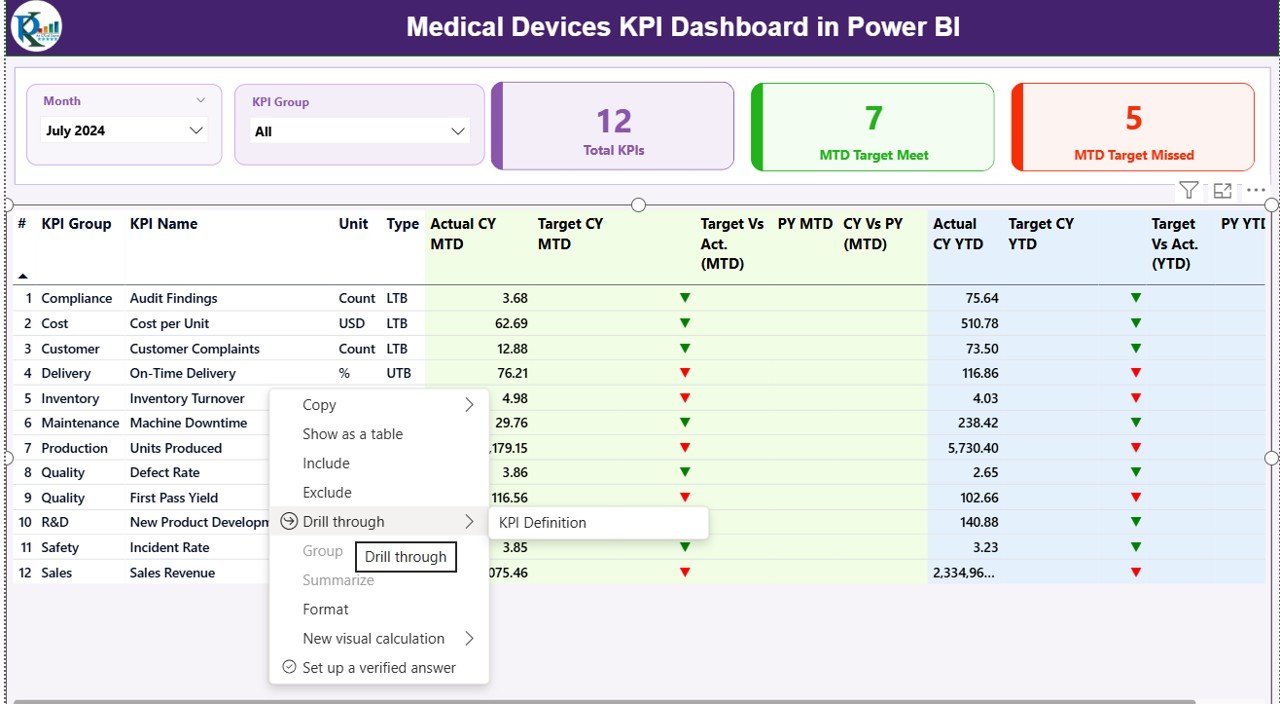
✨ Interactive Summary Page – Filter KPIs by Month and KPI Group using dynamic slicers.
📊 Smart KPI Cards – Instantly view Total KPIs, MTD Target Met Count, and MTD Target Missed Count.
📈 MTD & YTD Tracking – Compare Actual vs Target and Current Year vs Previous Year performance.
🎯 Performance Icons (▲ / ▼) – Visual indicators highlight whether KPIs are improving or declining.
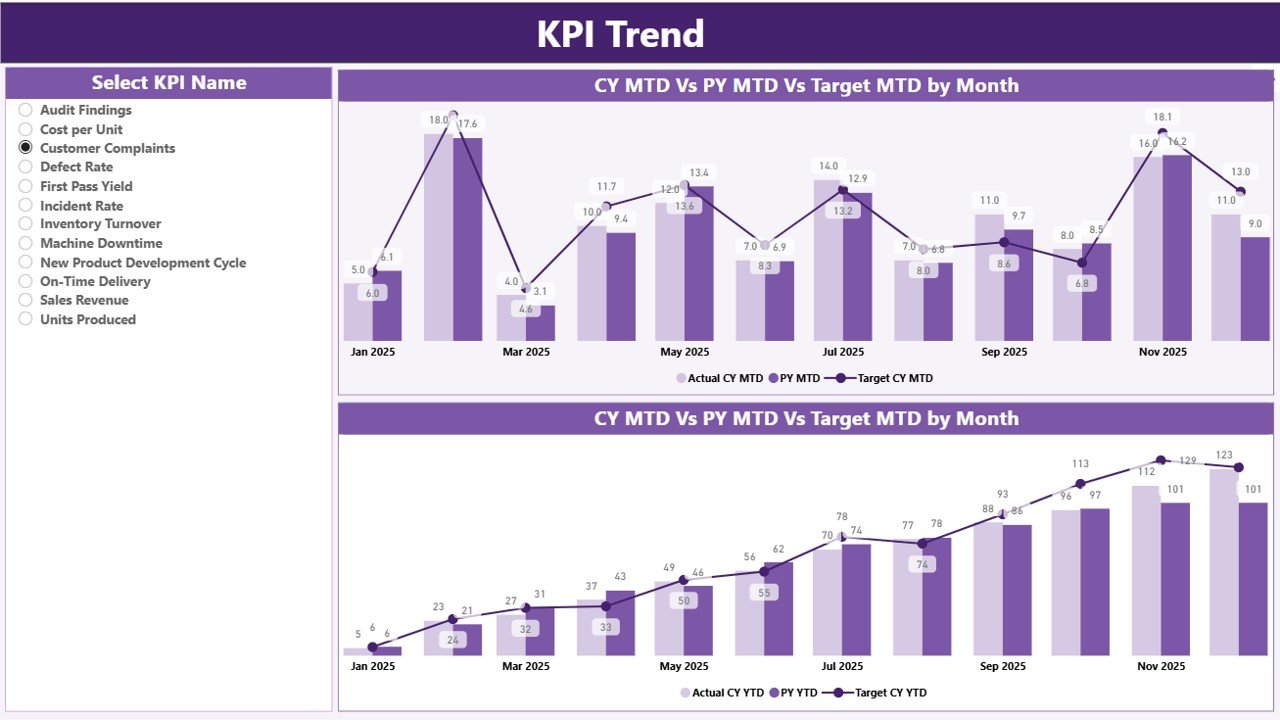
📉 KPI Trend Page – Analyze monthly and yearly trends with combo charts.
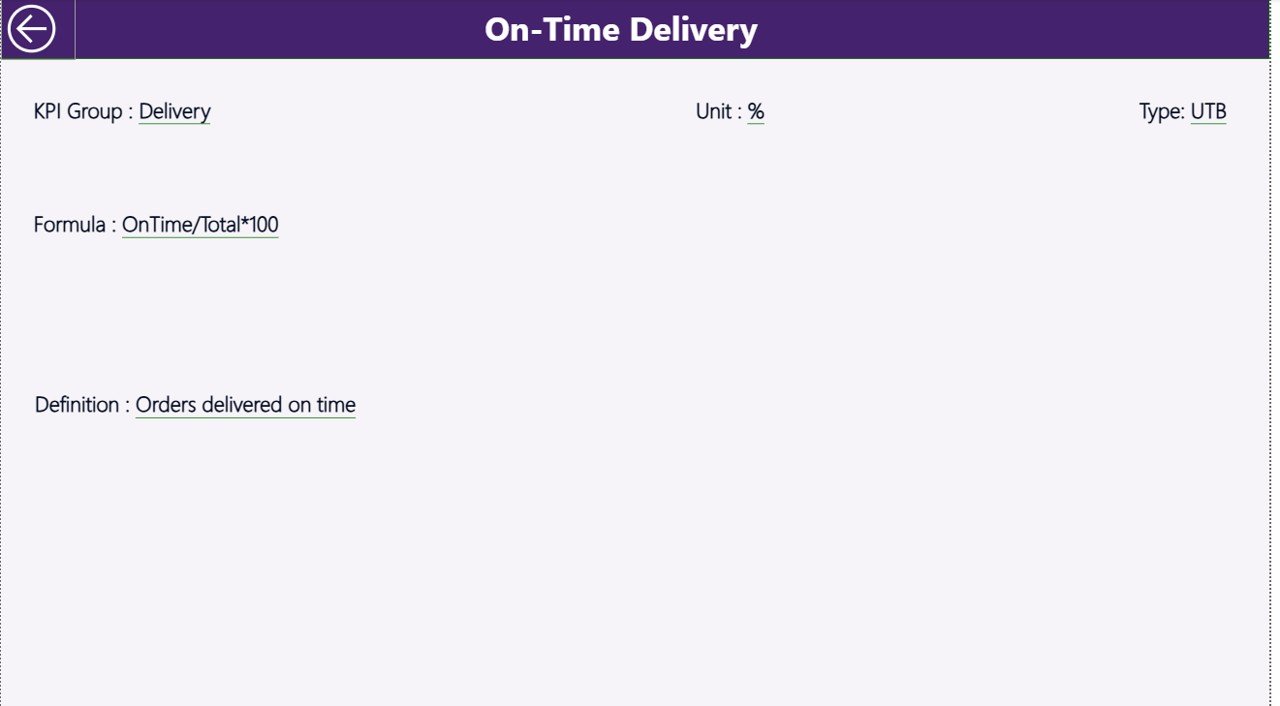
🔍 Drill-Through KPI Definitions – Right-click any KPI to view formula, type (LTB/UTB), and explanation.
📂 Excel-Based Data Source – Simple structured sheets for Actual, Target, and KPI Definitions.
⚙️ Scalable Structure – Add new KPIs anytime without rebuilding the dashboard.
This dashboard gives leadership instant visibility while empowering operational teams to act faster.
📦 What’s Inside the Medical Devices KPI Dashboard in Power BI
When you download this product, you receive:
✔️ Power BI Desktop file with 3 fully designed interactive pages
✔️ Summary Page with KPI table and performance comparison
✔️ KPI Trend Page with MTD and YTD visual analysis
✔️ KPI Definition Page with drill-through functionality
✔️ Structured Excel file containing:
-
Input_Actual sheet
-
Input_Target sheet
-
KPI Definition sheet
The Excel structure makes updates easy. You simply enter monthly numbers and refresh Power BI. No complex modeling required.
🛠️ How to Use the Medical Devices KPI Dashboard in Power BI
Using this dashboard is simple:
1️⃣ Open the Excel data file.
2️⃣ Update monthly MTD and YTD values in the Input_Actual sheet.
3️⃣ Enter monthly targets in the Input_Target sheet.
4️⃣ Add or modify KPIs in the KPI Definition sheet if needed.
5️⃣ Refresh the Power BI file.
That’s it.
The dashboard automatically calculates:
-
Target vs Actual percentages
-
Current Year vs Previous Year comparisons
-
MTD and YTD progress indicators
Within minutes, you get a complete performance overview.
👥 Who Can Benefit from This Medical Devices KPI Dashboard in Power BI
This dashboard is ideal for:
🏭 Medical Device Manufacturers
🧪 Quality Assurance Teams
📋 Regulatory & Compliance Managers
📊 Operations Managers
💼 Sales & Distribution Leaders
🏥 Healthcare Equipment Suppliers
If your organization tracks production volume, defect rate, CAPA closures, compliance score, revenue growth, service response time, or warranty claims — this dashboard is built for you.
It improves accountability, reduces compliance risk, and enhances strategic decision-making.
Medical device companies operate in a competitive and regulated environment. Production delays, rising defect rates, compliance risks, and missed sales targets can significantly impact performance.
This dashboard eliminates guesswork. It gives you:
✔ Centralized KPI monitoring
✔ Real-time target comparison
✔ Year-over-year performance insights
✔ Improved transparency
✔ Faster strategic planning
Instead of reacting to problems, you start predicting them.
If you want structured performance tracking, visual clarity, and better executive control, this dashboard delivers exactly that.
Click here to read the Detailed blog post
Watch the step-by-step video tutorial:


